Developing an IFC interoperability
specification for integrated and energy
efficient building design
Prepared by: Victor Muñoz
Supervisor: Professor Yusuf Arayici
School of Built Environment
University of Salford, Salford, UK
Submitted in Partial Fulfilment of the Requirements of the Degree
of Master in Philosophy
Contents
Figures ... 7
Table ... 9
Abbreviations ... 10
Abstract ... 12
Acknowledgement ... 13
Chapter 1. Introduction... 14
1.1. Motivation ... 14
1.2. Research Question ... 15
1.3. Aim ... 15
1.4. Objectives ... 16
1.5. Research contribution ... 16
1.6. Dissertation structure ... 16
Chapter 2 Sustainable development and the AEC industry ... 18
2.1. Towards sustainable development ... 18
2.1.1. Triple Bottom Line paradigm ... 21
2.1.2. Criticizing TBL ... 24
2.2. What is climate change? ... 25
2.2.1. Evidence of changes in global climate... 26
2.2.2. Greenhouse effect ... 32
2.2.3. Source of GHGs... 33
2.2.4. Projections of climate change ... 35
2.3. Carbon emission reduction agreements ... 39
2.3.1. The Kyoto Protocol ... 39
2.3.2. The Copenhagen Accord ... 40
2.3.3. The Paris Agreement ... 41
2.4. Sustainable building rating system and standards ... 42
2.4.1. Sustainable building rating systems ... 43
Chapter 3 Building Information Modelling and sustainable development... 48
3.1 Building Information Modelling ... 48
3.1.1 BIM characteristics ... 50
3.1.2 Uses of BIM in the design process... 50
3.1.3 BIM benefits ... 53
3.1.4 BIM challenges ... 54
3.1.5 BIM information delivery ... 55
3.2 Building Performance Simulation ... 60
3.2.1 Benefits of BPS ... 61
3.2.2 Limitations of BPS ... 61
3.2.3 Review of software ... 62
3.3 Integrating BIM/BPS ... 66
3.3.1 Integrating workflows ... 66
3.3.2 Benefits of an integrated workflow ... 67
3.3.3 Integration challenges ... 68
3.4 Exchange schemas for interoperability ... 71
3.4.1 Model schema ... 71
3.4.2 Schema languages ... 75
Chapter 4. Methodology and research design ... 79
4.1. Research methodology ... 79
4.1.1. Research philosophy ... 80
4.1.1.1. Philosophical assumptions ... 82
4.1.2. Research approach ... 85
4.1.2.1. Deduction ... 85
4.1.2.2. Induction ... 86
4.1.3. Research strategy ... 87
4.1.3.1. Experiment ... 88
4.1.3.2. Survey ... 88
4.1.3.3. Case study ... 89
4.1.3.4. Action research ... 89
4.1.3.5. Grounded theory ... 90
4.1.3.6. Ethnography ... 90
4.1.3.7. Archival research ... 90
4.1.4. Research choices ... 90
4.1.4.1. Quantitative research ... 90
4.1.4.2. Qualitative research ... 91
4.1.4.3. Multiple methods ... 91
4.1.5. Time horizons ... 91
4.1.6. Techniques and procedures ... 92
4.2. Research design ... 92
4.2.1. Philosophy ... 93
4.2.2. Research approach ... 94
4.2.3. Strategy ... 95
4.2.4. Research choice ... 96
4.2.5. Time horizon ... 96
4.2.6. Technique and procedures ... 96
Chapter 5 Developing interoperability via IDM methodology ... 101
5.1 Information exchange methods ... 101
5.1.1 Integrated process for delivering IFC based data exchange ... 102
5.2 What is IDM? ... 104
5.3 Design for Energy project ... 105
5.3.1 Scenarios ... 106
5.3.2 Interoperability framework ... 107
5.4. Developing the Information Delivery Manual (IDM) ... 109
5.4.1.1. Use ases odelli g ... 113
5.4.2. Exchange models ... 114
5.4.3. Exchange objects ... 115
Chapter 6 Developing interoperability via MVD methodology ... 117
6.1 What is MVD? ... 117
6.1.1 Goals for MVD ... 118
6.2 Developing MVDs ... 118
6.3 MVD example ... 120
Appendix A , Information Delivery Manuals ... 126
A.1 Needs identification and feasibility studies ... 126
A.1.1 Use case model for gathering requirements ... 129
A.1.2 Use case model for study alternatives ... 131
A.1.3 Use case model for feasibility studies ... 133
A.2 Concept design, design and simulation ... 135
A.2.1 Use case model for early design modelling ... 138
A.2.2 Use case model for environmental analysis ... 141
A.3 Concept design, energy matching ... 143
A.3.1 Use case model for the approval of the concept design ... 146
A.4 Detailed design, detailed design ... 148
A.4.1 Use case model for HVAC detailed design ... 150
A.5 Final design, design review ... 153
A.5.1 Use case model for integrated design review (HVAC) ... 156
A.5.2 Use case model for the integrated design review (electrical) ... 159
Appendix B , Model View Definitions ... 161
B.1 Needs identification and feasibility studies ... 161
B.1.1 MVD # 01, lifecycle cost ... 161
B.1.2 MVD # 02, usage indicators ... 163
B.1.3 MVD # 03, self-efficiency rate ... 165
B.2 Concept design, design and simulation ... 167
B.2.1 MVD # 04, Site potential and features ... 167
B.2.2 MVD # 05, U-Value ... 169
B.2.3 MVD # 06, new material slabs ... 171
B.3 Concept design, energy matching ... 172
B.3.1 MVD # 07, walls ... 172
B.3.2 MVD # 08, columns ... 174
B.3.3 MVD # 09, slabs ... 176
B.4 Concept design, energy matching ... 178
B.4.1 MVD # 10, HVAC components ... 178
B.4.2 MVD # 11, BACS components ... 179
B.5 Concept design, energy matching ... 181
B.5.1 MVD # 13, cost estimation of HVAC systems ... 181
B.5.2 MVD # 14, HVAC equipment for cooling ... 182
B.5.3 MVD # 15, photovoltaic panels ... 183
7
Figures
Figure 2.1. Triple Bottom Line ... 24
Figure 2.2. Globally averaged combined land and ocean surface temperature ... 27
Figure 2.3. Globally averaged sea level change ... 28
Figure 2.4. Global anthropogenic CO2 emissions ... 29
Figure 2.5. Globally averaged greenhouse gas concentrations ... 30
Figure 2.6. Widespread impacts attributed to climate change ... 31
Figure 2.7. Greenhouse effect ... 32
Figure 2.8. GHG emissions by economic sector ... 34
Figure 2.9. Global building energy consumption ... 34
Figure 2.10 Global average surface temperature ... 36
Figure 2.11 Global mean sea level rise ... 36
Figure 2.12 Projected changes in temperature and precipitation ... 37
Figure 2.13 Projected risks ... 38
Figure 2.14 ZEB system ... 46
Figure 3.1 BIM uses throughout a building lifecycle ... 51
Figure 3.2 Information delivery cycle ... 57
Figure 3.3 US DOE´s website ... 63
Figure 3.4 Integrating BIM and BPS tools ... 67
Figure 3.5 Time consumed in energy analysis... 69
Figure 3.6 Relationship schema-language ... 71
Figure 3.7 STEP schema ... 73
Figure 3.8 IFC schema architecture with conceptual layers ... 75
Figure 3.9 EXPRESS-G schema ... 78
Figure 4.1. Research methodology based on the Onion Model ... 80
Figure 4.2. Deductive approach ... 86
Figure 4.3. The Inductive approach ... 87
Figure 4.4. The research design ... 93
Figure 4.5. Case study procedure ... 97
Figure 4.6. Types of case study design ... 98
Figure 4.7. Integrated method for interoperability specification development ... 99
Figure 5.1 Integrated process overview ... 103
Figure 5.2 Definitions and configurations ... 105
Figure 5.3 D4E scenarios ... 106
Figure 5.4 General overview of the interoperability framework ... 108
Figu e . P o ess odel fo e ui e e ts aptu e, eigh ou hood, a d feasi ilit studies... 112
Figure 5.6 Use case model for gathering design requirements ... 113
Figure 5.7 Exchange objects for key criteria ... 115
Figure 6.2 Summary of the outputs from the design check and energy matching in use case 3 ... 119
8
Figure A.1 Process model for requirements capture, neighbourhood, and feasibility studies ... 128
Figure A.2 Use case model for gathering design requirements ... 129
Figure A.3 Exchange objects for key criteria ... 130
Figure A.4 Use case model for generating study alternatives ... 131
Figure A.5 Exchange objects for energy benchmark data ... 132
Figure A.6 Use case model for feasibility study ... 133
Figure A.7 Exchange objects for feasibility results ... 134
Figure A.8 Process model for early design modelling, environmental analysis, building performance assessment ... 137
Figure A.9 Use case model for early design modelling ... 138
Figure A.10 Exchange objects for the personal component catalogue ... 139
Figure A.11 Exchange object of material data ... 140
Figure A.12 Use case model for environmental analysis ... 141
Figure A.13 Exchange objects for concept design alternatives ... 142
Figure A.14 Process model for concept design, sketching building design ... 145
Figure A.15 Use case model for energy matching at the neighbourhood level ... 146
Figure A.16 Exchange objects BIM model alternatives ... 147
Figure A.17 Process model for detailed design and optimisation ... 149
Figure A.18 Use case model for approval of the concept design ... 150
Figure A.19 Exchange objects for personal component catalogue ... 151
Figure A.20 Exchange objects for obtaining HVAC indicators ... 152
Figure A.21 Process model for final design, integrated design review ... 155
Figure A.22 Use case model for integrated design review ... 156
Figure A.23 Exchange objects for energy performance simulation results of the HVAC design .... 157
Figure A.24 Exchange objects for the final design BIM model ... 158
Figure A.25 Use case model for integrated design review for electrical design ... 159
Figure A.26 Exchange objects for detailed electrical design BIM model ... 160
Figure B.1 Lifecycle cost ... 162
Figure B.2 Usage indicators ... 164
Figure B.3 Self efficiency rate ... 166
Figure B.4 Site potential and features ... 168
Figure B.5 U-Value ... 170
Figure B.6 New material slabs ... 171
Figure B.7 MVD Walls ... 173
Figure B.8 MVD columns ... 175
Figure B.9 MVD slabs ... 177
Figure B.10 HVAC system ... 178
Figure B.11 BACS components ... 179
Figure B.12 Energy performance of HVAC ... 180
Figure B.13 Cost estimation of HVAC systems ... 181
Figure B.14 HVAC cooling equipment ... 182
9
Table
Table 3.1 Comparing BPS tools ... 65
Table 4.1. Summary of research philosophies and assumptions ... 84
Table 5.1 Exchange model for key criteria ... 114
Table A-1 Key design criteria ... 130
Table A-2 Information exchange for energy benchmark data ... 132
Table A-3 Information exchange requirements for feasibility results ... 134
Table A-4 Obtaining building component information for personal component catalogue ... 139
Table A-5 Information exchange requirements for suggesting sustainable materials ... 140
Table A-6 Information exchange requirements for sharing concept design alternatives . 142 Table A-7 Information exchange requirements for sharing the selected design alternatives ... 147
Table A-8 Information exchange requirements for the personal components catalogue 151 Table A-9 Information exchange requirements for obtaining indicators ... 152
Table A-10 Information exchange requirements for energy performance simulation results ... 157
Table A-11 Information exchange requirements for sharing the final HVAC design model ... 158
10
Abbreviations
AEC: Architecture, Engineering and Construction
BEP: BIM Execution Plan
BIM: Building Information Modelling
BPMN: Business Process Modelling Notation
BPS: Building Performance Simulation
BREEAM: Building Research Establishment Environmental Assessment Method
CBP: Cross-organizational Process Business Processes
CO2: Carbon Dioxide
DOE: US Department of Energy
EPBD: Energy Building Performance Directive
GHG: Greenhouse Gases
IFC: Industrial Foundation Classes
IPCC: Intergovernmental Panel on Climate Change
LEED: Leadership in Energy and Environmental Design
MIDP: Master Information Delivery Plan
NASA: National Aeronautics and Space Administration
PIP: Project Implementation Plan
PIM: Project Information Model
PPM: Parts Per Million
SD: Sustainable Development
STEP: STandard for the Exchange of Product
11
UKCIP: United Kingdom Climate Impacts Programme
UML: Unified Modelling Language
UN: United Nations
UNCHE: United Nations Conference on the Human Environment
UNFCCC: United Nations Framework Convention on Climate Change
USGBC: U.S. Green Building Council
WCED: World Commission on Environment and Development
12
Abstract
Human activities release greenhouse gases (GHG) that are warming and changing the
climate and putting at risk the life on the planet. Among these activities, the building
sector has an important position as it consumes 30-40% of global energy. The primary use
of energy is domestic heating, and it contributes 12% of GHGs. More efficient housing
design should mean a reduction in the carbon emissions generated by the building sector.
Unfortunately, current energy design tools are not sufficient enough to deal with this
problem. Energy rating and standards are able to evaluate energy performance and
reduce energy consumption respectively, but they are not able to represent the
complexity of the multiple variables involved in energy performance. Recent
methodologies such as Building Information Modelling (BIM) and Building Performance
Simulation (BPS) have been able to handle the complexity of energy simulation.
Nonetheless, the current interoperability issues need to be improved to allow the
collaboration of both disciplines.
This research proposes to develop an interoperability specification for integrated and
energy efficient building design. This standard will allow any user to integrate BIM and BPS
tools in order to facilitate the workflows between both disciplines and to promote an early
collaboration with the energy designer to achieve a better energy performance and,
13
Acknowledgement
Before starting with the acknowledgements I would like to express what this
dissertation has meant for me. From an academic point of view, it has become a
challenging task pushing me to go deeply into topics that I have tried to avoid before
such as actually understanding how the IFC structure works or how to execute an
energy simulation. From a personal point of view, it has made me aware as to how real
the environmental problem is. At the time of writing these acknowledgements, it has
been identified that one of the biggest ecosystems in the world, the Great Barrier
Reef, has an irrecoverable damage of 30%. Fortunately, there is good news too, in that
last April Portugal was able to work for four days entirely utilising only renewable
energy, becoming clear proof that countries can work using these kinds of energies.
Now to proceed to the acknowledgements. Firstly, I would like to thank my tutor,
Yusuf Arayici, for his patience and for giving me this opportunity with this new degree.
It was something unexpected for me, and I really appreciate what he has done for me.
I did my best, and I hope not disappoint him. Secondly, I would like to thank the
Director of the THINKlab, Terrence Fernando, for allowing me to be involved in this
research and allowing me to keep growing professionally and as a person. Thirdly,
thanks to Hanneke van Dijk for her valuable help in suggesting changes and
proofreading this dissertation. Thanks, Hanneke! Finally, but not least importantly,
thanks to my parents: gracias papas por el apoyo y animo que me han brindado a la
distancia. Espero haber sido digno de su ejemplo, y espero poder abrazarlos y besarlos
luego, los quiero.
In this world there is room for everyone. And the good earth is rich and can provide for
everyone. The way of life can be free and beautiful, but we have lost the way.
14
Chapter 1.
Introduction
1.1. Motivation
For years there has been discussion about the veracity of climate change and the role of
human activities as the main instigators of it. Some sectors have denied this situation
stating that global warming is a natural cycle of the weather on the planet. Nonetheless,
there is enough data to set human activities as the primary cause for this issue. The
change in the climate will affect the environment and living beings across the planet in
multiple ways.
The climate issue has been discussed in several conferences attended by multiple
governments. These conferences have focused on reaching agreements and setting goals
to control the warming problem. The most recent conference (held in December 2015)
brought about the Paris Agreement. This agreement came to an understanding regarding
keeping global warming below 2°C but with an urgent call to limit it to 1.5°C above
pre-industrial levels. Thus, to meet this goal, each country will be required to adjust their
economic activities in order to reduce their carbon emissions. The building sector is a
major carbon producer. This sector consumes 30-40% of the global energy with around
25% of it being utilised in heating and cooling buildings. Thus, improving energy design,
would mean a reduction in energy consumption and, consequently, fewer carbon
emissions.
Currently, energy design is a very backwards field that is based on the use of rating
systems to evaluate performance or standards to reduce energy consumption.
Unfortunately, these tools are not able to represent all the variables involved in a project,
and their results will present a possible solution but not necessarily the best option that
maximises the beneficial factors involved in a project. Indeed, the right procedure should
15 In recent years Building Information Modelling (BIM) has advanced as a promissory
method in designing and coordinating multiple strands of information throughout the
whole lifecycle of a project. Indeed, this discipline is understood as a natural complement
to Building Performance Simulation (BPS).
However, both disciplines are not integrated yet. As a consequence, energy simulation is
undertaken as late as possible within the architectural design (i.e., when the design has
been mostly defined) to avoid losing time in adding missed data in the model. A late
energy analysis makes it impossible to introduce significant changes in the project because
any change at this stage will mean a low-performance impact but a high financial cost.
Keeping in mind this problem, this research proposes to develop an interoperability
standard to integrate BIM and BPS tools. This specification will be vital for the project
Design4Energy (D4E) which aims to predict the current and future energy efficiency of a
project both at the individual and neighbourhood level. The design data will be created for
different stakeholders at various stages; then the appropriate interoperability will allow
for the sharing and reusing of the output from multiple designers.
1.2. Research Question
How can BIM/BPS tools work collaboratively to enhance energy efficient design during
the design stage?
1.3. Aim
To define an interoperability specification to allow a collaborative energy efficient
16
1.4. Objectives
- To conceptualise a BIM-based collaborative platform using a range of models such
as IDM and MVD.
- To identify the core challenges, including process, technology, and people related
issues within energy efficient design.
- To explore the state–of-the-art for interoperability to build up a contextual
understanding of integrated design.
- To explore the sustainable development concept and how such a concept can be
implemented to understand the importance of energy efficient design.
1.5. Research contribution
This research will build up knowledge around the interoperability between BIM and BPS
tools. This knowledge will be fundamental to the success of the D4E project, thus allowing
for the information exchange of data generated by different stakeholders using different
tools at different stages of the project lifecycle.
1.6. Dissertation structure
This dissertation is divided into seven chapters plus an Appendix. Chapter 1 presents the
motivation, the research question, aim and objectives, and the contribution of this study.
Chapter 2 introduces the concept of sustainable development, the consequences of
climate change, and the energy ratings and standards currently used in sustainable design.
Chapter 3 presents the BIM and BPS concepts, their features and challenges, and the
state-of-the-art within the field of interoperability. Chapter 4 introduces the research
methodology used in this study (the onion methodology has been selected) and then each
component of this method is presented with the objective of explaining how this research
will be undertaken. Chapter 5 introduces the first part of the research. It focuses on
17 Chapter 6 uses the outputs from chapter 5 to develop the interoperability from a technical
point of view using MVD methodology. Finally, the Appendix presents the results from
18
Chapter 2
Sustainable development and the AEC industry
This chapter, as its objective, wishes to note the importance of the concept of sustainable
development and the negative impact that a lack of it has on the environment. Climate
change is the most important consequence of economic growth that does not take into
consideration environmental and social factors. Once the chapter has introduced the
concept of sustainable development and theimplications of climate change, the protocols
to address carbon emissions will be presented. Finally, there is a discussion of the design
methods that architecture, engineering and construction (AEC) are using to reduce
carbon emissions from within their projects.
2.1. Towards sustainable development
Sustainable development (SD) is a relatively new concept. Indeed, it was only in the early
1960s when different environmentalist organisations warned about the threats caused by
issues such as population growth, pollution, natural resource depletion and what these
would mean for the environment and, consequently, for humankind (Peura, 2013).
Defining SD has been challenging because of the need to integrate issues and interests
from different areas. Mebratu (1998) identifies three distinct stages that define what SD
has gone through in order to reach what can be regarded as the current concept:
- Pre Stockholm Conference
This stage covers the period before the Stockholm Conference on the Human Environment
(1972), and it is characterised by a total unawareness of the impact of human activities on
the environment and a complete absence of the SD concept. However, several experts
had described how a lack of natural resources had affected their areas, e.g. Georg
Agricola, a German mining engineer, described the negative impact of woodcutting and
mining on wildlife in the 16th century; Marchand and Wilhelm Gottfried Moser, forestry
experts, criticised the overconsumption of wood in the 18th century, and they put forward
19
this stage is A essa o the p i iple of populatio itte i the de og aphe
and political economist, Thomas Robert Malthus. In this document, Malthus recognised a
possible lack of resources when food production could not keep pace with the growth of
population (Paul, 2008).
- From Stockholm Conference to the UN World Commission on Environment and
Development (WCED)
This stage is between the Stockholm Conference on the Human Environment(1972) and
the UN World Commission on Environment and Development in 1987. This period is
distinguished for the awareness of the risks that environmental issues such as population
growth, pollution, and natural resource depletion would mean for the whole of life on the
planet (Du Pisani, 2006; Peura, 2013). An increase in concern about environmental
problems was due mainly to the book The Li its to G o th published in 1972 by a
group of eminent economists and scientists, known as the Club of Rome. This document
had a great impact because it used computer simulations to show the limited supply of
natural resources that the planet has and, consequently, how overexploitation could
endanger humankind (Du Pisani, 2006).
This publication was criticised because of its extreme environmentally-centred view
leading to proposals for drastic schemes such as limiting or banning economic growth to
protect natural resources (Kidd 1992; Hill and Bowen, 1997). The opponents to such an
approach argued that any commercial restrictions would increase inequalities between
countries (Du Pisani, 2006; Paul, 2008) especially in developing countries that need a
higher economic growth to reduce poverty (Mitcham, 1995). Another problem with this
approach is the assumption that there will be an exponential growth of population and
industrial capital; as a result, pollution and the demand for resources would grow in the
same way until depletion (Paul, 2008).
Additionally, in 1972, the United Nations Conference on the Human Environment (UNCHE)
was held in Stockholm to discuss for the first time the environmental problem as a
20 changing world opinion about economic development and its consequences on
environmental degradation and the well- ei g of the o ld s populatio (Kidd, 1992) but
it was unable to integrate fully the environmental approach with the need for economic
development. The partially integrated approach was particularly rejected by developing
countries who viewed this approach as an excuse by developed economies to put a brake
on developing countries growing economies (Mebratu, 1998).
In 1987, the UN World Commission on Environment and Development (WCED) tried to
integrate both environmental and economic approaches by publishing the Brundtland
Report. This publication was focused on the social and economic goals of society and on
ensuring a global equity for future generations by redistributing resources towards poorer
nations to promote their economic growth (Du Pisani, 2006; Hill & Bowen, 1997).
SD is defined by WCED (WCED, 1987, pp 43) as the development …that eets the eeds
of the present without compromising the ability of future generations to meet their own
eeds… . This definition has two key ideas: firstly, the concept of 'needs' considers
economic and social needs in a generic way because these needs can be different for
developed and developing countries. Secondly, this statement contains the idea of soft
limitations imposed by the current state of the technology and social organisations on the
environment´s ability to meet present and future needs (Kidd, 1992).
Even though this definition has been able to balance social, economic and environmental
needs (Du Pisani, 2006), this balance does not mean a call for any transformation in
economic growth (Carter, 2007). Indeed, the ambiguity in this meaning of SD (Bartlett,
2006) has made possible new interpretations of the concept according to the needs of any
economic sector. As a result of these multiple interpretations, many organisations see the
term SD as a form to perpetuate corporate interests but giving the impression of
21
- Post WCED
Previous stages focused on recognising and identifying sustainable development issues. In
this stage, there is a call for action through multiple meetings to reach agreements that
allow for a reduction in the impact of human activities on the environment.
In 1992, the UN Commission on Sustainable Development (UNCED) held an Earth Summit
in Rio de Janeiro. This meeting gathered together 114 heads of state, 10,000
representatives from 178 countries and 1,400 non-governmental organisations to discuss
how to achieve SD (Paul, 2008). The key outcomes of the conference were the Rio
Declaration on Environment and Development and Agenda 21 (Nef, 2009). The Rio
Declaration acknowledged the responsibility that developed countries have in global
environmental degradation and, as a consequence, the fact that these countries need to
pursue sustainable development because of the impact that their population has had on
the environment and on the technologies and financial resources that they have. Agenda
21 is a set of practices and recommendations to be implemented by each country to
develop their sustainable development strategy. Also via Agenda 21, developed countries
reaffirmed contributing 0.7 percent of their annual gross national product (GNP) for
development assistance and the transfer of environmental technologies to developing
countries (Murphy & Drexhage, 2012).
2.1.1. Triple Bottom Line paradigm
As pointed out above, the WCED´s definition for SD became the starting point for new
interpretations. Indeed since 1987 almost 400 new definitions have been developed
(Johnston et al., 2007; Woodhouse, Howlett, & Rigby, 2000). Even though this number is
large, all these definitions have been developed in terms of the three dimensions
proposed in the WCED definition: environment, economy and society (Kuhlman &
Farrington, 2010; Harris, 2003).
The most important of these interpretations was made by Elkington in his book ´Cannibals
22 paradigm that SD will play in the 21st century, highlighting the need for the adaptation of
economic systems to new requirements from governments and business leaders as a
solution for a broad range of problems on the international agenda (Elkington, 1997).
Using the elements introduced by the Brundtland Report, Elkington challenged the
traditional ´bottom line´ which focuses on economic performance, to create an accounting
and report tool called Triple Bottom Line (TBL). This tool puts together economic,
environmental and society needs as indicators of the success of a company (Curtis,
Davidson & Mitchell, 2007; Jonker & Harmsen, 2012; Kuhlman & Farrington, 2010).
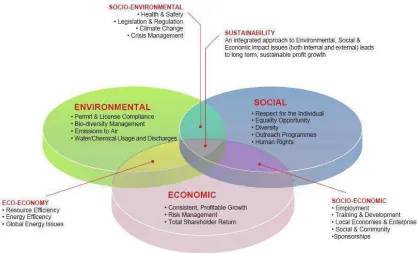
Figure 2.1 shows each dimension and their interaction under the TBL paradigm (Elkington,
1997; Harris, 2003):
- Environmental: this aspect is concerned with how natural resources are affected
by current and future operations, ensuring a stable base of natural resources,
avoiding over-exploitation of renewable resources and proposing mitigation
activities for the exploitation of non-renewable resources.
- Social: this dimension promotes fairness in distribution, opportunities and access
to social services. Equality in access to resources will lead to trust between
different groups making working together easier for a common purpose such as
sustainability.
- Economic: this dimension produces goods and services that are
constant in time, creating profitable growth for stakeholders under controlled risks
and avoiding imbalances which could damage industrial production.
Jointly alongside these three dimensions, TBL introduces multiple interactions or ´shear
zones´ between each dimension; thus to achieve the goals will require the fulfilling of the
requirements of these new sub-dimensions. The intersection of any bottom line defines
23 - Eco-economy: the delivery of competitively-priced goods and services satisfying
human needs and quality of life. It implies reducing ecological impact through the
efficient use of resources and energy.
- Socio-environmental: deals with natural resources to ensure they will remain
available in the short and long term for future generations.
- Socio-economic: changes the traditional relationship between
companies-employers-communities, creating companies which are socially responsible and
which are concerned about their actions and the impact that they have on
different actors.
Finally, figure 2.1 shows an overlap between the three bottom lines. The intersection of
these dimensions defines SD as an attempt to achieve economic growth while also
protecting the environment without any trade-off and links social equity to the
environment (Carter, 2007). For Elkington, SD is not a matter of business ethics, it is a
strong metric based on financial performance, impact on the economy, the environment
and the society in which it operates (Savitz & Weber, 2006). The success of any company
24 Figure 2.1. Triple Bottom Line (Mann, 2009)
2.1.2. Criticizing TBL
The TBL paradigm was widely accepted and distributedby companies such as AT&T, Dow
Chemical, Shell and British Telecom which saw in this approach a chance to balance
environmental, social and economic needs (Curtis-Davidson & Mitchell, 2007; Jonker &
Harmsen, 2012; Norman & MacDonald, 2004). Multiple governments adopted the TBL
approach because of the enthusiastic reception given it by industry. Finally, TBL was
adopted in the United Nations World Conference on Sustainable Development in 1992
(Jonker & Harmsen, 2012).
Despite the broad acceptation of Elkington´s definition, the literature shows some
drawbacks in the TBL paradigm:
- A lack of Key Performance Indicators (KPIs): the absence of a clear set of indicators
to measure organisational performance (Jackson, Boswell & Davis, 2011; Sridhar,
25 (Curtis-Davidson & Mitchell, 2007). As a result, a company will not be able to
compare outputs over goals and, consequently, it will not be able to take
appropriate actions to grow sustainably. Thus any goal and objective will just be a
declaration of good intentions (Mitchell, Curtis & Davidson, 2008).
- Difficulty in accounting for the social dimension: social impacts cannot be precisely
defined since impacts in a community and on individuals are varied, e.g. metrics
such as loyalty and charitable donations are complex to determine because they
regularly change (Sridhar, 2011). Norman and MacDonald (2004) state that it is
impossible to find a universal scale to weigh the ´good´ and ´bad´ impacts caused
by a firm, thus to create a methodology to measure this dimension is not possible.
2.2. What is climate change?
Climate change has been a matter of discussion for years. During the first half of the
twentieth century, it was thought as a natural phenomenon caused by volcanic activity or
by a change in the amount of energy emitted by the sun (Emmanuel & Baker, 2012).
Nonetheless, there is substantial evidence to suggest that natural factors on their own
cannot influence or change the climate to the levels observed in the latter half of the last
century. Thus it is clearly seen that this change is driven by external factors (Lockwood &
Fröhlich, 2007; Somerville & Jouzel, 2008; Terpstra & Russow, 2011).
In 1989 the United Nations (UN) asked the Intergovernmental Panel on Climate Change
(IPCC) to develop a series of assessments to understand the climate issue and its
importance for public policy (Somerville & Jouzel, 2008). These reports recognised climate
change as a real problem that could represent a threat to life on the planet. In the Third
Assessment Report (TAR) published in 2001, the IPCC concluded: ´there is new and
stronger evidence that most of the observed warming observed over the last 50 years is
attributable to human activities´ (IPCC, 2001, pp5). This conclusion was reinforced in 2007
26 that anthropogenic greenhouse gas increases have caused most of the observed increase
in global average temperatures since the mid-20th century´ (Jenkins, Perry & Prior, 2008).
For the UN (UN, 1992, pp 7) climate change is …a ha ge of li ate hi h is attri uted
directly or indirectly to human activity that alters the composition of the global
atmosphere and which is in addition to natural climate variability observed over
o para le ti e periods… . Whereas for the IPCC (IPCC, 2007, pp 30) climate change
means ...a ha ge i the state of the limate that can be identified (e.g. using statistical
tests) by changes in the mean and/or the variability of its properties, and that persists for
an extended period, typically decades or longer. It refers to any change in climate over
time, whether due to atural aria ility or as a result of hu a a ti ity …
2.2.1. Evidence of changes in global climate
The indicators used to measure changes in the environment are multiple, and they differ
from one organisation to another. For example, the United Kingdom Climate Impacts
Programme (UKCIP) uses temperature in Scotland and Northern Ireland, precipitation over
the UK, North Atlantic oscillation, storminess, coastal sea-surface temperature, and the
sea level around the UK. On the other hand, the IPCC uses GHG emission levels,
atmospheric GHG concentration levels, changes in global mean temperature and a rise in
sea-level, changes in regional climate variables and modifications in the intensity or
frequency of extreme events. Independent of any organisation, the most important
parameter is the global average surface temperature (UKCIP02, 2002), because it is a
parameter that is easy to identify, and there are a large number of observations dating
from the mid-19th century. Thus it establishes a solid database to understand recent
changes (IPCC, 2013).
In this dissertation, the IPCC´s parameters will be used because of their universal
character. Also, the facts shown by IPCC are more consistent, having developed reports in
1990, 1995, 2001, 2007 and 2014. In each of them, the data is compared with the previous
report and a projection for the coming report is also undertaken (Somerville & Jouzel,
27 - Changes in global mean temperature and a rise in sea-level: The atmosphere and
the oceans have increased in warmth by 0.85°C during the twentieth century
(IPCC, 2013; Jenkins, Perry & Prior, 2008) with most of this rise occurring in the last
25 years (IPCC, 2007).
Figure 2.2 shows information on temperatures from three different sources. It is
clear that the combined temperature of the land-ocean has been rising since the
1950s. Indeed, the period 1983-2012 was the warmest 30 year period in the last
1,400 years in the Northern Hemisphere (IPCC, 2014a). Additionally, the National
Aeronautics and Space Administration (NASA) has pointed out that 2015 has been
the warmest year since modern temperature records started in 1880 (Norton,
2016).
Figure 2.2. Globally averaged combined land and ocean surface temperature (IPCC, 2014a)
The oceans have absorbed around 80% of this warming in the atmosphere
(Somerville and Jouzel, 2008). As a consequence, the temperature in the oceans
has increased at a rate of 0.11°C per decade between 1971 and 2010 (IPCC, 2014).
The polar masses have been affected by this overheat. The Arctic ice is losing mass
at a rate of 3.5-4.1% per year while the Antarctic ice is gaining 1.2-1.8% of mass
28 the melting icecaps. The rate has been rising at 1.7 mm per year during the last
[image:28.612.88.550.137.337.2]century (Terpstra & Russow, 2011).
Figure 2.3. Globally averaged sea level change (IPCC, 2014a)
- GHG emission levels: Undoubtedly, human activities are responsible for increasing GHG emissions (carbon dioxide, methane and nitrous oxide) (Marland & Boden
2002). Figure 2.4 shows that half of GHG emissions have happened between 1970
to 2010, with CO2 being the main contributor with 78% of the emissions (IPCC,
2014a).
Each GHG has a different lifetime in the atmosphere (50 to 200 years) before being
absorbed by the ocean, vegetation or by a chemical reaction (Gautier & Le Treut,
2008). Nonetheless, the atmosphere is not capable of absorbing an overload of
29 Figure 2.4. Global anthropogenic CO2 emissions (IPCC, 2014a)
- Atmospheric GHG concentration levels: along with the increase in emissions, the
concentration of GHGs is rising too. GHG concentration has grown faster since the
1950s to reach levels not recorded in 800,000 years (IPCC, 2014a).
As shown in figure 2.5, the concentration of CO2 (shown by the green line) reached
a worrying level of 350 parts per million (PPM) early in the 1990s. Concentrations
over that level will make it difficult to keep the global temperature going up by
below 2°C by the end of the 21st century (Terpstra & Russow, 2011). Even worse,
the concentration levels have kept growing in recent years with a CO2
concentration of 403.19 ppm in 2016 (Tenenbaum, 2016). According to Barnola et
al. (1999), the last time that the GHG concentration exceeded 300 ppm was
30 Figure 2.5. Globally averaged greenhouse gas concentrations (IPCC, 2014a)
- Changes in regional climate variables: there is substantial evidence on how
climate change is affecting natural and human systems. These changes are altering
the availability and quality of water because of altered precipitation patterns and
altered amounts of snow and ice (IPCC, 2014a).
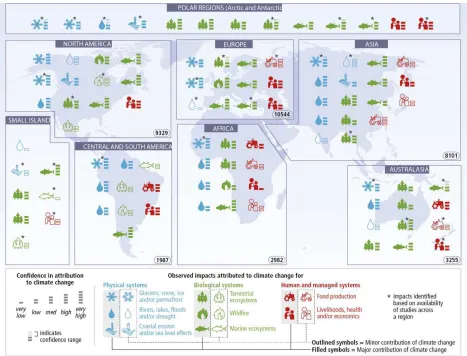
Figure 2.6 summarises where the main effects of climate change can be seen
across the world:
- Rivers, lakes, floods and/or drought across North, Central and South America,
Africa, Asia and Australasia.
- Glaciers, snow, ice and/or permafrost in all continents and the Polar Regions.
- Terrestrial ecosystems in North America, Europe, Asia, Africa and Australasia.
- Marine ecosystems in North, Central and South America, Europe, Africa, Asia and
Australasia.
- Food production in Central and South America, Africa and Australasia.
31 Figure 2.6. Widespread impacts attributed to climate change (IPCC, 2014a)
- Variations in the intensity or frequency of extreme events: the number of extreme events which have been observed has increased since 1950. The main
events include a decrease in cold temperature extremes, an increase in warm
temperature extremes, an increase in the extreme high sea levels, an increase in
the number of heavy precipitation in some regions, and an increase in the
32
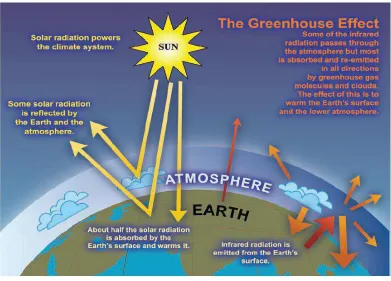
2.2.2. Greenhouse effect
The sun emits energy in the form of infra-red radiation. This energy passes through the
atmosphere and is absorbed by elements on the surface of the planet such as water, air,
soil and vegetation. The GHGs reflect the portion of energy not absorbed by the
atmosphere (see figure 2.7). Because of this, the temperature of the planet has increased
from -18°C to 15°C (Gautier & Le Treut, 2008; Mitchell, 1989) making possible the climate
conditions to support life (Krause, Bach & Kooney, 1995).
While the g ee house effe t a e e efi ial, hu a a ti ities su h as u i g fossil fuels, deforestation, altered land uses and wetland changes, and the use of CFCs in
refrigeration systems are increasing the amount of GHGs in the atmosphere (Emmanuel &
Baker, 2012). A large concentration of GHGs will boost the greenhouse effect of the
atmosphere not allowing the escape of heat and thus sending it back to the surface and
[image:32.612.110.501.389.670.2]increasing the temperature on the planet (IPCC, 2007).
33 The effect of each GHG will differ because of their different lifetimes in the atmosphere.
Water vapour evaporates in a few weeks, and its concentration is not affected by human
activities. By contrast, the other three gases have a long lifetime (50-200 years). Thus the
gases are concentrated in the atmosphere for a long before being absorbed by the oceans,
vegetation or chemical reactions (Gautier & Le Treut, 2008).
2.2.3. Source of GHGs
As mentioned above, climate change is caused by an increase of GHGs as a consequence
of human activities. Thus, there is a need to identify the different economic activities that
are generating emissions to find suitable methods to deal with them. Because of the need
to find such methods this research is focused on energy consideration within building
designs and this analysis is focused on this sector. Eve though GHGs e issio s ight
seem to be a problem that is related to other industries rather than to the built
environment industry, the literature is clear in pointing out that the AEC industry can be a
key driver in reducing GHGs (Riley, 2013; Emmanuel & Baker, 2012).
In 2010, the building sector consumed approximately 30-40% of global energy (Emmanuel
& Baker, 2012; IPCC, 2014a), mainly coming from oil. This amount of energy consumption
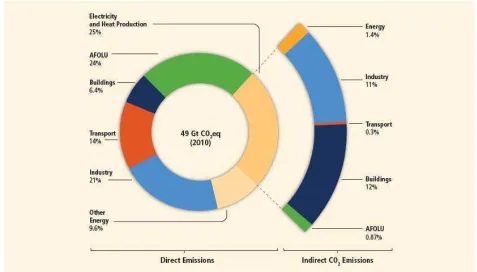
released 49 GtCO2eq into the atmosphere (IPCC, 2014a). These emissions are broken
down as follows in figure 2.8: industry (21%); transport (14%); buildings (6.4%);
agriculture, forestry and other land use (AFOLU, 24%); electricity and heat production
(25%), and other energy (9.6%). Looking only at the emissions that come from electricity
and heat production it shows that buildings contribute 12% in the generation of GHGs.
Usually, a building uses 30-40% of energy for heating and cooling (Ward, 2009). IPCC
(2014a) differentiates between residential and commercial consumption (see figure 2.9).
According to this separation, the consumption for residential is 36% while for commercial
it is 49% (including both heating and cooling). Furthermore, the demand is likely to grow
34 Figure 2.8. GHG emissions by economic sector (IPCC, 2014b)
[image:34.612.85.559.411.675.2]35
2.2.4. Projections of climate change
- Projections in global mean temperature and a rise in sea-level: The recent
temperature increase might be considered by some as unimportant whereas, in
fact, it is critical. Indeed, a temperature increase of over 2°C has not been
experienced by humans during last 125,000 years; an increase of 2-4°C would
mean a climate never experienced by human beings; an increase over 5°C has not
been experienced for tens of millions of years (Krause, Bach & Kooney, 1995).
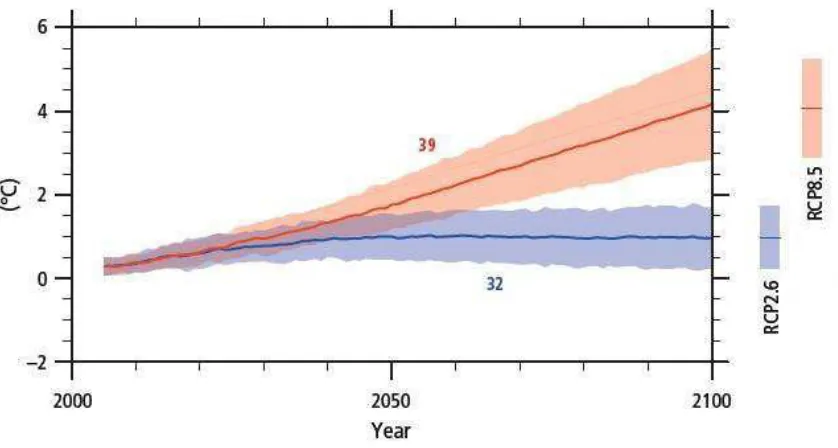
In figure 2.10 two possible scenarios are introduced for temperature behaviour up
to the year 2100. The red line indicates medium confidence, while the blue one
indicates high confidence. There are two sections in the curves, from 2016-2035
there is a possible increase in temperature between 0.3°C to 0.7°C. For the second
period, there is a potential increase of between 0.3°C to 1.7°C for the red line,
while the blue one has a possible increase of between 2.6°C to 4.8°C. Thus,
according to figure 2.10, it is highly likely that the suspected goal temperature of
2°C will be exceeded by 2100. Figure 2.12(a) shows similar temperature ranges
but is detailed by geographic area.
With an increase in temperature, the Arctic will continue warming and will
accelerate the rise in the sea level. It is highly likely that the sea level will rise
36 Figure 2.10 Global average surface temperature (IPCC, 2014a)
Figure 2.11 Global mean sea level rise (IPCC, 2014a)
- Precipitation: Figure 2.12(b) shows that changes in precipitation patterns will not
be regular. The high latitudes and the equatorial Pacific region will increase their
37 regions, the rainfall will decrease by 10%while in the mid-latitude wet regions
precipitation will increase. Extreme precipitation will intensify in the mid-latitude
wet regions and wet tropical areas.
Figure 2.12 Projected changes in temperature and precipitation (IPCC, 2014a)
- Changes in regional climate variables:
In the coming future, the impact of global warming will keep growing and will continue
affecting the climate. These changes will increase the risk of negative impacts on the
environment in different ways, e.g. the oceans will increase in acidification, the levels of
oxygen will decrease, and the rising temperatures will generate unbearable conditions for
marine ecosystems; subsequently the extinction risk for several marine species will
increase. Furthermore, climate change will have an impact on human activities, increasing
illnesses in developing countries, economies and ecosystems.
Current and future risk is detailed in figure 2.13. The risk is described in four categories;
38 and the third and fourth are long-term scenarios (2080-2100). These last two scenarios
are differentiated by an increase in temperature of 2°C and 4°C respectively.
Figure 2.13 Projected risks (IPCC, 2014a)
From figure 2.13 the following effects can be observed.
- Vulnerable ecosystems such as the Arctic, the Antarctic and the oceans have
already been affected without a chance of decreasing the current risk.
- In North America, currently, the risk levels are medium; however, they might
increase quickly over the 2030-2040 period.
- In South America, the current level of risk on activities is rated as medium. Food
production might suffer in the near future and can be identified as having a high
39 a great chance for the mitigation of this. However, a high-risk level might occur in
the near term.
- Africa has a similar situation to South America. It is currently at medium risk, but
there is a high potential to increase this risk in the near term.
- Europe might have increased risk from floods in the current term and the near
term. Also, there is a possible medium risk level for water restrictions.
- Asia will need to face manyflood issues in the short term and the near term. Also,
an increase in heat will affect human life conditions causing high mortality in the
short, near and long terms.
- Australasia will have to face a change in its coral reef systems in the short, near,
and long terms. Also, there is a risk that floods will be experienced in the short,
near and long terms.
2.3. Carbon emission reduction agreements
Since the 1970s multiple meetings have been held to deal with climatic issues such as the
Stockholm Conference (1972), the Brundtland Report (1987) and the Rio de Janeiro Earth
Summit (1992), just to name a few. All these conferences have focused on setting out
concepts, principles and plans for action rather than calling for action through setting
measurable objectives. The Kyoto Protocol was the first conference able to set out clearly
measurable goals with deadlines and to propose methods to fulfil the objectives. Below
the main meetings that have set goals regarding climate issues are introduced.
2.3.1. The Kyoto Protocol
In 1997 the United Nations Framework Convention on Climate Change (UNFCCC) obtained
an agreement with 39 developed countries incorporating the European Union, United
States, Australia and transition economies such as Bulgaria, Croatia, the Czech Republic,
the Russian Federation, to name a few. In this protocol, the above countries agreed to
reduce the emission of the main GHGs (carbon dioxide, methane and nitrous oxide) in a
40 2008 to 2012 (UNFCCC, 2014a). The protocol assigned a range of reducing emissions as a
goal rather than listing specific values; in so doing , it recognised different contribution
levels in the creation of GHGs for each country. As a consequence, the reduction efforts
were to be greater for the most polluting countries (Grubb, Vrolijk and Brack, 1999).
The Kyoto Protocol proposed multiple methods for achieving carbon reduction:
- International Emissions Trading: this allowed guarantor countries to exchange
emissions in the form of units of one tonne of CO2. In this method, the emission
units can be traded like any other commodity, and thus a guarantor country can
buy emission units from other guarantors with spare units and can redistribute the
emissions with this transaction (Grubb, Vrolijk and Brack, 1999).
- Joint implementation: this allowed guarantor countries to sponsor projects in
other guarantor countries that had as an objective the cutting of GHGs e.g.
reforestting or research projects to reduce carbon emissions. In exchange, the
sponsored country will provide emission reduction units to the investor country
(UNFCCC, 2014b).
- Clean development mechanism: this is similar to joint implementation but it
differed in that guarantor countries could sponsor non-gua a to ou t ies
projects. The objective was to promote clean development in developing countries
with activities such as investing in renewable energies (INFCCC, 2014c).
2.3.2. The Copenhagen Accord
In 2009 the UNFCCC called for a new meeting in Copenhagen to discuss a new framework
regarding carbon emissions that would come in force in 2012 when the Kyoto Protocol
expired. This meeting was attended by 115 world leaders and more than 40,000 people
representing governments, nongovernmental and intergovernmental organisations
41 The major global economies agreed with the key points in the agreement, and they
offered to pledge specific actions to mitigate the GHG emissions (C2ES, 2010). The main
points agreed were (INFCCC, 2014d):
- The long-term goal of limiting the maximum global average temperature increase
to no more than 2°C above pre-industrial levels.
- Developed countries promised to fund actions to reduce GHGs; the capital
committed would be US$30 billion for the period 2010-2012, and US$100 billion a
year by 2020.
- Developing countries with significant GHG contributions (Brazil, Indonesia, Saudi
Arabia, South Korea and China) would report their emissions and mitigation
actions.
Unfortunately, the Copenhagen Accord was legally weak and non-binding (Marshall, 2010;
Spak, 2010); thus the key points set in the Accord could not be forcibly implemented;
instead, they were based on the goodwill of each country who voluntarily pledged to
reduce its emission targets (Yamaguchi 2012). Because there was little pressure to take
much action, the most polluting countries were weak in tackling their objectives e.g. the
U.S. and China gave vague promises about reducing their emissions in the next one or two
decades (Spak 2010). The EU, Australia, Russia, Norway and New Zealand committed to
the lower end of their previously pledged ranges (Marshall, 2010).
2.3.3. The Paris Agreement
After the failed Copenhagen Accord, the UNFCCC called for a new meeting in Paris during
2015. In this meeting, 196 countries discussed a new legally binding framework to replace
the Kyoto Protocol in an effort to reduce carbon emissions. Paris provided a significant
and substantial international Agreement that removed the differences between
developed and developing countries, pushing them to make their best efforts to reduce
GHGs (C2ES, 2015). While this Agreement removed the differences between developed
and developing countries, it still recognised the differences in the responsibilities and
42 emphasis from mitigation to adapting processes that were able to reduce emissions at
source (ClimateFocus 2015).
The key points from the Paris Agreement were (ClimateFocus, 2015; C2ES, 2015; Willis et
al., 2014):
- Reaffirmation of the long-term goal of keeping global warming below 2°C but with
an urgent call to limit it to 1.5°C above pre-industrial levels. The idea of reducing
the maximum temperature is to stabilise the atmosphere as soon as possible
during the second half of this century.
- All countries would communicate their target emissions and the progress made in
implementing and achieving them through successive nationally determined
contributions (NDC). This data will be reviewed every five years.
- The current funding of US$100 billion a year in support by 2020 is extended up to
2025; after that year, a higher goal will be set.
2.4. Sustainable building rating system and standards
In 2003 the Energy Building Performance Directive (EPBD) was created with the objective
of promoting the energy performance of buildings within the EU. This organisation is
focused on four key points (BRE, 2006):
- Setting a calculation methodology for the energy performance of buildings.
- Regulating a minimum energy performance requirement for new buildings and the
large existing building stock.
- The need for an energy performance certificate that is available whenever
buildings are constructed, sold or rented out.
- The inspection of boilers and air-conditioning.
To achieve the above points, the AEC industry uses building rating systems such as LEED
43 introduced the main rating systems and standards that are used for buildings to improve
their energy performance.
2.4.1. Sustainable building rating systems
A sustainable building rating system is a tool to evaluate a project based on assigning a
score given to the features of the project in achieving specific national building
regulations and standards (CIBSE, 2015; Fowler & Rauch, 2006). The rating system offers a
reliable basis for comparing and evaluating the technical aspects of different projects
(Fowler & Rauch, 2006).
There are multiple rating systems, e.g. Fowler and Rauch (2006) identified at least 34
different systems, most of them adaptations of LEED or BREEAM in a local context. Say
and Wood (2008) pointed out that LEED, BREEAM, GreenStar and CASBEE are the most
popular systems around the world. Despite the several rating systems that exist the
literature is clear in identifying to BREEAM and LEED as the most used across the world
(Rivera 2009; Say & Wood 2008). The key features of both systems are analysed below.
2.4.1.1. BREEAM
BREEAM (Building Research Establishment Environmental Assessment Method) was
developed in the United Kingdom in 1990. This system is able to analyse a series of
projects including offices, homes, industrial units, retail units, and schools (Fowler &
Rauch 2006). This system focuses on evaluating the reduction of CO2 in particular
categories such as management, health and wellbeing, energy, transport, water,
materials, waste, land use and ecology, and pollution (CIBSE, 2015). Subsequently, each of
these categories is weighted to reflect the contribution to the overall Energy Performance
Ratio of the new construction (Portalatin et al., 2010). The building is classified under one
of the following categories: Unclassified (<30%), Pass ≥ % , Good ≥ % , Very good
≥ % , E elle t ≥ % , o Outsta di g ≥ % (Portalatin et al., 2010).
2.4.1.2. LEED
LEED (Leadership in Energy and Environmental Design) was developed in the U.S. in 1998.
44 In the same way as BREEAM, LEED is a point based system, but the categories that are
evaluated in this case are sustainable sites, water efficiency, energy and atmosphere,
materials and resources, indoor environmental quality, and the innovation and design
process (Fowler & Rauch, 2006).
The project team collects evidence for the assessment process; then this information is
sent to the U.S. Green Building Council (USGBC). This organisation checks the evidence
and calculates the final score. Accordingly, a project can achieve a certification of Silver,
Gold or Platinum (Portalatin et al., 2010).
2.4.1.3. Criticism of sustainable building rating systems
While sustainable building rating systems have been adopted worldwide within several
projects, they are not free of issues. Heard and Jessop (2008) point out that these rating
tools have confused the terms ´green´ with ´sustainable´ building. The first concept
considers the environmental dimension while the second term considers the social and
economic aspects of a problem. Hes (2007) supports this idea. Studying the effectiveness
of rating tools Hes concluded that rating tools are useful in improving energy use, water
use and waste reduction; however, only some social issues were improved while the
economic dimension showed unpredictable behaviour. In addition, Hes (2007) highlights
the bureaucratic nature of these tools in that they do not seem to support dynamic
behaviour in design and development.
2.4.2. Energy efficiency standards
2.4.2.1. PassivHaus
PassivHaus is a methodology that defines a very high standard for the design and
construction of a wide range of projects, from houses to schools, supermarkets, offices
and apartment buildings (PassREg, 2015). This standard will ensure high quality, comfort,
low energy consumption , low bills (PassREg, 2015; PassivhausTrust, 2011) and,
consequently, a meaningful reduction in CO2 (PassREg, 2015). However, it must be borne
in mind that the focus of this methodology is on reducing energy consumption rather than
45 ´Passive house´ must not be confused. The first one refers to applying a well-defined
standard while ´Passive house´ refers to using passive design features (e.g. a passive solar
design) (BRE, 2010).
To achieve the PassivHaus standard it is necessary to demonstrate that the project meets
the quality assurance requirements. If it is not possible to demonstrate this, the project
will not be awarded the certification even if the project meets the performance
requirements.
2.4.2.3. ZEB
According to EPBD 2010/31/EU, a nearly zero-e e g uildi g )EB i di ates a uildi g
that has a very high energy performance. The nearly zero or very low amount of energy
required should be covered to a very significant extent by energy from renewable sources,
including energy from renewable sources produced on-site or nearby´ (EU, 2010). Also,
the EPBD sets out that Member States shall ensure that by 31 December 2020, all new
buildings will be nearly zero-energy buildings and, after 31 December 2018, new buildings
occupied and owned by public authorities will be nearly zero-energy buildings (EU, 2010).
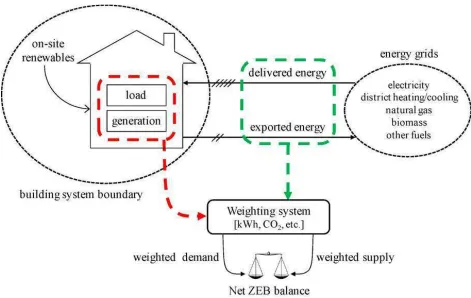
A ZEB contains at least three elements (see figure 2.14):
- A physical boundary which can be a building or a group of buildings that are
connected to a particular electrical grid. The physical boundary, shown in red in
figure 2.14, allows for the identification of the elements in the system where the
energy will be imported or exported (Sartori et al., 2012).
- A balance boundary which determines which energy uses will be connected to the
grid (heating, cooling, ventilation, domestic hot water and fixed lighting) (Sartori et
al., 2012).
- Boundary conditions which are a series of parameters (functionality, space
effectiveness, climate and comfort) that allow monitoring of the system and an
46 A ZEB uses local renewable systems to produce energy on site. If the ZEB system is not
able to generate enough energy, then it will be taken from an energy grid that works at
providing energy via renewable methods such as biofuel. If the ZEB produces more energy
than it can use then, this difference will be exported to the energy grid (Dokka et al.,
[image:46.612.84.555.218.516.2]2013).
47 2.4.2.3. Drawbacks of standards
There are drawbacks within the standards as presented below.
- PassivHaus
o It is not a zero carbon standard. While this specification reduces energy
consumption, it is not synonymous with zero emission. Indeed, because energy consumption is 15kWh/m2/yr, there will be an amount of carbon emission (Jones, 2013).
o It is a very hard standard to meet (Jones, 2013).
o It requires knowledge to manage the building during the operational stage,
e.g. it is not possible to open windows when the ventilation needs boosting, or filters will need to be replaced (Jones, 2013).
- ZEB
o It requires the creation of a roadmap where each EU member would show
their objectives and the concrete measures undertaken to achieve ZEB (Janssen, 2011).
o A zero-energy building needs to be fed from the grid in periods of high
demand and to be able to deliver the ZEB surplus when the demand decreases. However, a building will not experience a reduction in energy costs if the peak demand and utility bills are not managed (Zeiler, 2010).
o The smart grid works in the same way as traditional grids. Thus it needs to