comm
en
t
re
v
ie
w
s
re
ports
de
p
o
si
te
d r
e
sea
rch
refer
e
e
d
re
sear
ch
interacti
o
ns
inf
ormation
MONKEY:
i
dentifying conserved transcription
-
factor binding sites
in multiple alignments using a binding site-specific evolutionary
model
Alan M Moses
*†
, Derek Y Chiang
‡
, Daniel A Pollard
*
, Venky N Iyer
§
and
Michael B Eisen
†‡§
Addresses: *Graduate Group in Biophysics, University of California, Berkeley, CA 94720, USA. †Center for Integrative Genomics, University of California, Berkeley, CA 94720. ‡Department of Molecular and Cell Biology, University of California, Berkeley, CA 94720, USA. §Department of Genome Sciences, Genomics Division, Ernest Orlando Lawrence Berkeley National Lab, 1 Cyclotron Road, CA 942770, USA.
Correspondence: Michael B Eisen. E-mail: [email protected]
© 2004 Moses et al; licensee BioMed Central Ltd.
This is an Open Access article distributed under the terms of the Creative Commons Attribution License (http://creativecommons.org/licenses/by/2.0), which permits unrestricted use, distribution, and reproduction in any medium, provided the original work is properly cited.
Identifying conserved transcription-factor-binding sites
<p>MONKEY is a new method for identifying conserved transcription-factor binding sites from multiple-sequence alignments.</p>
Abstract
We introduce a method (MONKEY) to identify conserved transcription-factor binding sites in multispecies alignments. MONKEY employs probabilistic models of factor specificity and binding-site evolution, on which basis we compute the likelihood that putative binding-sites are conserved and assign statistical significance to each hit. Using genomes from the genus Saccharomyces, we illustrate how the significance of real sites increases with evolutionary distance and explore the relationship between conservation and function.
Background
Different types of genomic features have characteristic pat-terns of evolution that, when sequences from closely related organisms are available, can be exploited to annotate genomes [1]. Methods for comparative sequence analysis that exploit variation in rates and patterns of nucleotide evolution can identify coding exons [1,2], noncoding sequences involved in the regulation of transcription [3,4] and various types of RNAs [5-7]. While most of these methods have been developed for and applied to pairwise comparisons, sequence data are increasingly available for multiple closely related species [8]. It is therefore of considerable importance to develop sequence-analysis methods that optimally exploit evolutionary information, and to explore the dependence of these methods on the evolutionary relationships of the spe-cies in comparison.
Sequence-specific DNA-binding proteins involved in tran-scriptional regulation (transcription factors) play a central role in many biological processes. Despite extensive biochem-ical and molecular analysis, it remains exceedingly difficult to predict where on the genome a given factor will bind. Tran-scription factors bind to degenerate families of short (6-20 base-pairs (bp)) sequences that occur frequently in the genome, yet only a small fraction of these sequences are actu-ally bona fide targets of the transcription factor [9]. A major challenge in understanding the regulation of transcription is to be able to distinguish real transcription factor binding sites (TFBSs) from sequences that simply match a factor's binding specificity. Because the evolutionary properties of TFBSs are expected to be different from their nonfunctional counter-parts, comparative analyses hold great promise in helping to address this challenge.
Published: 30 November 2004 Genome Biology 2004, 5:R98
Received: 28 August 2004 Revised: 21 October 2004 Accepted: 28 October 2004 The electronic version of this article is the complete one and can be
In the past few years, several methods have been introduced to identify conserved (and presumably functional) TFBSs for a factor of known specificity (in contrast to the larger set of methods that use comparative data in motif discovery or to otherwise identify sequences likely to be involved in cis -regu-lation). Each of these methods explicitly or implicitly adopts one of several distinct definition of a conserved TFBS. These include a binding site in a reference genome that is perfectly or highly conserved [8,10-12]; a binding site in a reference genome that lies in a highly conserved region [4]; or a posi-tion at which the binding model predicts a binding site in all species [13-18].
In a previous study we characterized the evolution of experi-mentally validated TFBSs in the Saccharomyces cerevisiae
genome, finding that functional TFBSs evolve more slowly than flanking intergenic regions, and more strikingly, that there is considerable position-specific variation in evolution-ary rates within TFBSs [19]. We further showed that evolu-tionary rate at each position is a function of the selectivity of the factor for bases at that position.
Our goal here is to incorporate these specific evolutionary properties of TFBSs into the search for conserved TFBSs. Or, more precisely, to develop a method that, given the specificity of a transcription factor, identifies conserved binding sites in multiple alignments by taking into account the sequence spe-cificity and patterns of evolution expected for TFBSs, while still fully exploiting the phylogenetic relationships of the spe-cies being compared.
In addition to developing new methods, there are several hypotheses regarding the comparative annotation of TFBSs that we are interested in testing. It has been noted that the effectiveness of such analyses will depend critically on the evolutionary distance separating the species used. At very close distances TFBSs will appear conserved because there has been insufficient time for substitutions to occur. As dis-tance increases, and substitutions occur most rapidly at non-functional positions, our ability to detect constrained binding sites should improve until we are no longer able to reliably assign orthology based on sequence alignment. To overcome this problem of divergence distances exceeding what can be aligned, the sequences of multiple closely related species can be used to span the same evolutionary distances (and pre-sumably provide the same discriminatory power) as fewer more distantly related ones. However, aside from these qual-itative expectations, the dependence of the ability to identify conserved TFBSs on evolutionary distance and tree topology has not been rigorously investigated. Because the software MONKEY can be applied to multiple alignments of varying numbers of species and produces scores that can be meaning-fully compared across different sets of species, we are now able to address these issues.
Results
OverviewWe developed an approach to identify conserved TFBSs that combines probabilistic models of binding-site specificity [20-22] with probabilistic models of evolution [23,24]. Starting with an alignment of sequences from multiple related species, we use the known sequence specificity for a transcription fac-tor to compare the likelihood of the sequences under two evo-lutionary models - one for background and one for TFBSs. The central feature of this method that underlies its ability to identify conserved TFBSs is that it uses a specific probabilistic evolutionary model for the binding sites of each transcription factor. The evolutionary model we use for TFBSs [25] assumes that sites were under selection to remain binding sites throughout the evolutionary history of the species being studied. This model uses the sequence specificity of the factor to predict patterns and rates of evolution that recapitulate the patterns and rates observed in real TFBSs [19].
MONKEY: scanning alignments to identify conserved transcription factor binding sites
MONKEY, our tool for identifying conserved TFBSs, takes as input a multiple sequence alignment, a tree describing the relationship of the aligned species, a model of a transcription factor's binding specificity and a model for background non-coding DNA. It returns, for each position in the alignment, a likelihood ratio comparing the probability that the position is a conserved binding site for the selected factor compared to the probability that the position is background.
Extending matrix searches to multiple sequence alignments
For the model of binding specificity, we use a traditional fre-quency matrix [20-22]. The values in the matrix - fib - repre-sent the probability of observing the base b (A, C, G or T) at the ith position in a binding site of width w. For the model of the background, we use a single set of base frequencies gb.
A widely used statistic for scoring the similarity of a single sequence to a frequency matrix is the log likelihood ratio com-paring the probability of having observed a sequence X of width w under the motif model (a frequency matrix, desig-nated as motif) to the probability of having observed X under the background model (designated by bg), which can be easily reduced to:
where Xib is an indicator variable which equals 1 if base b is observed at position i, and zero otherwise.
This classifier can be motivated by the approximation that the data are distributed as a two-component mixture of sequences matching the frequency matrix and sequences drawn from a uniform background. In practice, we compute
S X p X motif
p X bg X
f g
ib ib
b b
i i w
( ) ( | )
( | ) ,
= =
∑
∑
= =
log log
comm en t re v ie w s re ports refer e e d re sear ch de p o si te d r e sea rch interacti o ns inf ormation
this score using a position-specific scoring matrix (PSSM) with entries, Mib = log(fib/gb), and find S for a particular w -mer by adding up the entries that correspond to the bases in the query sequence.
In extending this to a pair of aligned sequences X and Y, we want to perform the same calculation on their common ancestor A. Since A is not observed, we consider all possible ancestral sequences by summing over them, weighting each by their probability given the data (X and Y), the phylogenetic tree (T) that relates the sequences, and a probabilistic evolu-tionary model [23].
We can write a new score representing the log-likelihood ratio that compares the hypothesis that X and Y are a conserved example of the binding site represented by the frequency matrix to the hypothesis that they have been drawn from the background:
where Rmotif and Rbg are rate matrices describing the substitu-tion process of the binding site and background respectively. Using the conditional independence of the sequences X and Y
on the ancestor, A, and writing TAX for the evolutionary dis-tance separating sequence X from A, this becomes:
The class of evolutionary models used by MONKEY define a substitution matrix, p(Xi|Ai, t) = eRt, that represents the
prob-ability of observing each base at position i in the extant sequence (X) given each base in the ancestral sequence (A) after t units of evolutionary time or distance, given some rate matrix, R [23]. Since these models retain positional inde-pendence, we can rewrite this as:
This can be extended to more than two sequences, that is,
(X, Y, ..., Z), by replacing the probabilities of X and Y with the probability with the left and right branches of the tree below, and performing the calculation at the root. The proba-bilities of the left and right branches of the tree can be calcu-lated recursively as has been described previously [23].
Once again, for practical purposes we can convert these scores to a PSSM, whose entries are given for the pairwise case by:
where at each position we now index by the bases a and b in the two sequences. For multiple alignments of n species, each position requires 4n entries.
Evolutionary models
The use of evolutionary models is critical to the function of MONKEY. Myriad of such models exist, and in principle all can be used in MONKEY. For the background, it is natural to use a model appropriate for sites with no particular con-straint, such as the average intergenic or synonymous rates. MONKEY allows the use of the JC [26] or HKY [27] models, and here we use the latter with the base frequencies, rates and transition-transversion rate-ratio estimated from noncoding alignments assuming a single model of evolution over the noncoding regions (see details in Materials and methods). It is also possible to estimate the evolutionary model separately for each intergenic alignment, although the small size of yeast intergenic regions leads to variable estimates.
In principle, the JC and HKY models can also be used for the motif, with rates set according to our expectation of the over-all rate of evolution in functional binding sites, which has been estimated as two to three times slower than the average intergenic rate [19]. However, we have previously shown that there is position-specific variation in evolutionary rates within functional transcription factor binding sites [19] and that positions in a motif with low degeneracy in the binding-site model evolve more slowly than positions with high degen-eracy; this relationship between the equilibrium frequencies and the position-specific evolutionary rates is accurately pre-dicted by an evolutionary model from Halpern and Bruno (HB model) [25].
In using this model, we assume that sequences evolve under constant purifying selection to maintain a particular set of equilibrium base frequencies. The use of this model corre-sponds to a definition of a conserved TFBS as a sequence position where there has always been a binding site for the transcription factor. Although the model does not strictly require that a binding site be present in each of the observed species, positions lacking such sites will have lower probabil-ities as they require the use of less probable substitutions. The rate of change from residue a to b at position i in the motif is given by:
where Q is the (position independent) underlying mutation matrix, which we set equal to the background model
ˆ( , ) ( , | , , ) ( , | , , )
S X Y p X Y motif T R
p X Y bg T R motif
bg =log
ˆ( , ) ( | , , ) ( | , , ) ( | )
S X Y
p X A T R p Y A T R p A motif
p
AX motif AY motif A
=log
∑
(( | ,X A TAX,Rbg) ( | ,p Y A TAY,Rbg) ( |p A bg) .
A
∑
ˆ( , )
( | , , ) ( | , ,
S X Y
p X A T R p Y A T R
i
w i ib AX motif i ib AY moti
=
= =
=
∑
log1
1 1 ff ib
b
i ib AX bg i ib AY bg b b
f
p X A T R p Y A T R g
)
( , , ) ( | , , ) .
∑
∑
+ =1 =1ˆ
S
ˆ ( , | , , )
( , | , ,
M p X Y motif T R
p X Y bg T R
iab ia ib motif
ia ib
= = =
= =
log 1 1
1 1 bbg)
R i Q
(Q = Rbg), and f is the frequency matrix describing the specificity
of the factor. Thus, for each position in the motif, the HB model predicts the rates of each type of substitution as a function of the frequency matrix, and the background model.
Comparing hits for different factors and evolutionary distances: computing the null distribution
To compare scores from different evolutionary distances and different factors, it is critical that we are able to assign signif-icance to a particular value of the score. To do so, we need to compute the distribution of the score under the null hypothe-sis that the sequence is part of the background. Calculating a
p-value for a score S in a single sequence requires the enu-meration of all possible w-mers that have a score S or greater under the background model. For n aligned sequences this requires the enumeration all 4wn possible sets of aligned w
-mers with scores S or greater under the background model. While the number of possible alignments of n w-mers can be unmanageably large for even small values of n and w, because we treat each position independently we can enumerate these possibilities efficiently using an algorithm developed for matrix searches of single sequences [28,29].
Every observed score is a sum of w numbers, one from each column of the matrix. The probability of observing exactly score S is the number of paths through the matrix whose entries add up to S, weighted by the probability of the path. By converting the matrix to integers, we can compute this prob-ability for all values of S recursively. We initialize Pi(S) (the probability of observing score S after i columns in the matrix) by setting P0(S) = 1 for S = 0, and P0(S) = 0 for S ≠ 0. We then compute the values of the function for i = [1, w] as follows:
For aligned sequences, c represents a column in the align-ment, and the sum is over all 4n possible columns an
align-ment of n sequences. The probability distribution function (PDF) of scores is Pw(S), and from this the cumulative distri-bution function (CDF), the probability of observing a score of
S or greater, can be directly computed. Although in principle we can compute the probabilities to arbitrary precision, because the time complexity increases with the number of possible scores, we limit the precision to within approxi-mately 0.01 bits.
Figure 1 compares empirical p-values from 5,000 pairs of sequences evolved in a simulation (see Materials and meth-ods) with those computed by this method, and shows that they agree closely. We have used this method to compute the CDFs for alignments of up to six species, and therefore can apply our method to most comparative genomics applica-tions. We note, in addition, that the likelihood ratio scores are approximately Gaussian (data not shown). As the means and variance of the scores under each model can be computed
effi-ciently (see Materials and methods) we can estimate p-values using a Gaussian approximation (Figure 1) when the number of sequences in the alignment is large.
Heuristics for alignments with gaps
The treatment of alignment gaps in identifying conserved TFBSs is somewhat problematic. One the one hand, nonfunc-tional sequences may be inserted and deleted over evolution more rapidly than functional elements [30-32], and thus the presence of a gap aligned to a predicted binding site could indicate that it is nonfunctional. On the other hand, align-ment algorithms are imperfect, and must often make arbi-trary decisions about the placement of gaps. We sought to design a heuristic that accommodated both these aspects of genomic sequence data by locally optimizing alignments for the purpose of comparative annotation of regulatory elements.
The idea is to assign a poor score to regions of the alignment with a large number of gaps, but to locally realign regions with a small number of gaps to identify conserved but misaligned binding sites. To do this, we scan along the ungapped version of one of the aligned sequences - the 'reference' sequence. For each position in the reference sequence pr, we define a win-dow in each other sequence around ps, the position in sequence s aligned to position pr. The window runs from
P Si Pi S Mic p c bg T Rbg c
( )=
∑
−1( − ˆ ) ( | , , ) [image:4.612.316.557.86.333.2]Accuracy of p-value estimations Figure 1
Accuracy of p-value estimations. To examine the accuracy of our p-value estimates, we compared the empirical p-value (computed from the observed distribution of scores) to p-values computed using either the exact method described above (black points) or Gaussian approximation (gray points). The scores represent the simple score at a distance of 0.1 substitutions per site calculated using the Gcn4p matrix from SCPD [33]. Other models and matrices produce similar results.
1
0.001 0.01 0.1 1
Empirical p-value
Predicted
p
-value
0.001 0.01 0.1 Gaussian
Exact
comm
en
t
re
v
ie
w
s
re
ports
refer
e
e
d
re
sear
ch
de
p
o
si
te
d r
e
sea
rch
interacti
o
ns
inf
ormation
ps - (a + b)to ps + w + (a + b), where a and b are the number of
gaps in the aligned versions of sequences r and s in position p
to p + w, where p is the position in the alignment of pr. For each subsequence of length w in the window, we calculate the percent identity to the reference sequence, and create an alignment of pr to pr + w (in the reference sequence) to the most similar word in the window of each other sequence. This locally optimized alignment is then scored. Note that if a and
b are zero (meaning there are no gaps in the aligned sequence), no optimization is done. If a is too large (in most contexts greater than five) we exclude that region of the align-ment from further. This heuristic encapsulates the idea that too many gaps are indicative of lack of constraint, but con-servatively allows for a few gaps due to alignment or sequence imperfections.
Application to Saccharomyces
The genome sequences of several species closely related to the budding yeast Saccharomyces cerevisiae have recently been published and become models for the comparative identifica-tion of transcripidentifica-tion factor binding sites [8,11]. We aligned the intergenic regions of S. cerevisiae genes to their orthologs in S. paradoxus, S. mikatae, S. bayanus and S. kudriavzevii
genomes using CLUSTALW (see Materials and methods) and sought to evaluate the effectiveness of MONKEY under differ-ent evolutionary models and distances.
Ideally, we would use several diverse transcription factors with known binding specificity, where the set of matches to the factor's matrix in the S. cerevisiae genome could be divided into two reasonably sized sets: those known to be bound by the factor (positives) and those known not to be bound by the factor (negatives). Unfortunately, even in yeast, the number of such cases is limited. For many factors we can identify true positives by combining high- and low-through-put experimental data that supports the hypothesis that a particular position in the genome is bound by a given factor. A true negative set, however, must be constructed on the basis of lack of evidence that a sequence is functional, as the
inter-pretation of negative results almost always is ambiguous. In the case of transcription factor binding sites this is particu-larly problematic, because DNA-binding proteins have over-lapping specificity, and we may therefore observe conservation of a binding site because it is bound by another factor with similar specificity. After evaluating all factors with binding specificity in Saccharomyces cerevisiae Promoter Database (SCPD) [33], we focus on Gal4p and Rpn4p for fur-ther analysis (see Table 1 for properties of these factors, and Materials and methods for a description of the selection of positive and negative sets).
The effects of evolutionary models on the discrimination of functional binding sites
To evaluate the performance of our evolutionary method in correctly identifying bona fide binding sites, we calculated the
p-values of the positive and negative sites for each factor, using MONKEY on alignments of all five genomes for Rpn4p and four species (with S. kudriavzevii excluded because too few sequences were available) for Gal4p. We compared the performance of MONKEY with the HB model to scores from
S. cerevisiae alone and to a 'simple' score (equal to the aver-age of the single sequence log likelihood ratios) that utilizes all the comparative data without an evolutionary model.
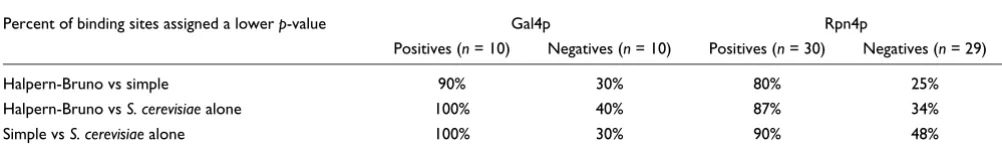
The results are summarized in Table 2. An ideal scoring method would assign low p-values to real sites (positives) and high p-values to spurious sites (negatives), and we therefore compared the p-values assigned by monkey based on the HB model to those based on the 'simple' score. Not surprisingly, both methods were a great improvement over searching in S. cerevisiae alone. Overall, when compared to each other, the HB score assigned lower p-values to the binding sites more often in the positive sets (90% for Gal4p and 80% for Rpn4p) and less often in the negative sets (20% for Gal4p and 25% for Rpn4p) than did the simple score. We note that some of the supposedly functional Rpn4p sites were assigned higher p -values in S. cerevisiae alone, suggesting that they are not in fact conserved; these will be discussed below.
Table 1
Definition of positive and negative sets of matrix matches
Criterion Gal4p Rpn4p
Unique specificity Spacer of 11 bp [50] Atypical zinc finger [42]
Well characterized specificity Protein-DNA co-crystal [51] Large number of binding sites, low degeneracy [42]
Well characterized target gene set Classic genetic system [52] and high-throughput studies [45,46]
Targets include almost all proteasomal subunits [42] stereotypical expression pattern [48]
Criteria used to define positive and negative sets to use in this study. It is important to avoid factors whose specificity overlaps with other factors, because binding sites that are not occupied by one factor may be constrained because of binding by another, and to choose factors with
The effect of evolutionary distance on the discrimination of functional binding sites
As evolutionary distance increases, we expect fewer matches to the matrix to be conserved by chance, which implies that the probability of observing matches as highly conserved as the functional sites should decrease. Similarly, we expect the nonfunctional sites to show many substitutions and their p -values to increase over evolution. To explore the change in p -values over evolutionary distance, we scored the functional and nonfunctional sets of binding sites at a variety of evolu-tionary distances by creating alignments of different combi-nations of species (see Materials and methods). The median
p-value of the positive set of TFBSs decreases monotonically with evolutionary distance, with the rate of decrease an approximately constant function of evolutionary distance (see Figure 2). The median p-value for the binding sites in the negative set increases with evolutionary distance, although somewhat erratically. This demonstrates that MONKEY effectively exploits evolutionary distance, and confirms our intuition that as evolutionary distance increases, functional elements should be increasingly easy to distinguish from spu-rious predictions.
To test this hypothesis on a more quantitative level we sought to compare the observed scores with the expected scores assuming that binding sites evolved precisely according to the evolutionary models used by MONKEY. Briefly, given a bind-ing-site model and a phylogenetic tree, we assume we have observed a binding site in the reference genome, and that this site evolves along the tree under either the motif model (HB) or background model (HKY), representing functional and nonfunctional binding sites, respectively (see Materials and methods for details). The expected p-values associated with the functional binding sites (Figure 2, solid lines) showed rea-sonable agreement with the models, consistent with previous observations that they are evolving under constraint that is well modeled by the purifying selection on the base frequen-cies in the specificity matrix [19].
Pairwise versus multi-species comparisons
The comparisons at the different evolutionary distances used in Figure 2 employed variable numbers of species, with the
shorter distances representing primarily pairwise compari-sons and the longer distances comparicompari-sons of three or more species. While we expect the variation in p-values with differ-ent combinations of species to be primarily a function of the evolutionary distance spanned by these species, there will also be effects related to the number of species and the topol-ogy of the three. For example, in the limit of very long branch lengths, the evolutionary p-values are on the order of the power of the number of species and are independent of evolu-tionary distance. In contrast, in the limit of very short branch lengths, the evolutionary p-values depend only on the dis-tance spanned by the comparison, as most of the information provided by additional species is redundant. However, because most comparisons that are actually carried out are far from either of these extremes, we sought to evaluate the effects of species numbers and tree topology for the Saccha-romyces species analyzed here.
First, we recomputed the expected p-values for all the dis-tances analyzed in Figure 2, except that instead of using the real tree topology, we used a single pairwise comparison at the same evolutionary distance (Figure 2, dotted lines). For example, for the Rpn4p analyses using all five species we assumed a pairwise comparison at an evolutionary distance of around 1.1 substitutions per site. Note that this is considera-bly more distant than any of the pairwise comparisons available among these species. The predictions for the pair-wise and multi-species comparisons are very similar, suggest-ing that at the evolutionary distances spanned by these species there is little difference in using multiple species alignments relative to a pairwise alignment that spans the same evolutionary distance. Only at the longest distances considered (greater than 0.8 substitutions per site) does the power of the pairwise comparison begin to level off, although there are other reasons that multiple species comparisons might still be preferred (see Discussion).
To complement this theoretical analysis, we were interested in using empirical data to compare pairwise and multi-spe-cies analyses. Fortuitously, the evolutionary distance between
[image:6.612.56.557.120.193.2]S. cerevisiae and S. kudriavzevii is almost exactly equal to the evolutionary distance spanned by S. cerevisiae, S. paradoxus
Table 2
Performance of different scores in recognizing functional and nonfunctional sites
Percent of binding sites assigned a lower p-value Gal4p Rpn4p
Positives (n = 10) Negatives (n = 10) Positives (n = 30) Negatives (n = 29)
Halpern-Bruno vs simple 90% 30% 80% 25%
Halpern-Bruno vs S. cerevisiae alone 100% 40% 87% 34%
Simple vs S. cerevisiae alone 100% 30% 90% 48%
comm
en
t
re
v
ie
w
s
re
ports
refer
e
e
d
re
sear
ch
de
p
o
si
te
d r
e
se
a
rch
interacti
o
ns
inf
o
rmation
and S. mikatae (median tree length approximately 0.5 substi-tutions per site; see Figure 3a). Because our models predict that we are in a regime where evolutionary distance is the pri-mary determinant of the p-values, we expect searches using these different sets of species to yield similar results. We tested this hypothesis by calculating the p-values associated with the Rpn4p-binding sites using the sequences from these two comparisons. The median p-values in both the positive and negative sets are very similar (Figure 3b), confirming that at these relatively short evolutionary distances, the power of the comparative method is independent of the number of spe-cies considered (see Discussion).
Taken together, these results strongly support the idea that when appropriate methods are used, data from multiple spe-cies can be combined effectively to span larger evolutionary distances. Note that this in no way implies that the addition of extra species to an existing pairwise comparisons is not useful - such additions will always increase the evolutionary dis-tance spanned by the species and thus will increase the power of the comparison.
Testing the power of comparative annotation of transcription factor binding sites
At the distances spanned by all available sequence data, the p -values are so small that we no longer expect to find matches of the quality of those in the positive set by chance, especially for Rpn4p. To test this further, we scanned both strands of all the available alignments of all five sensu stricto species (around 2.7 Mb) to identify our most confident predictions of conserved matches to the Rpn4p matrix. We chose the p -value cutoff of 1.85 × 10⁻⁸, which corresponds to a probability
of 0.05 of observing one match at that level over the entire search (using a Bonferroni correction for multiple testing). After excluding divergently transcribed genes, there were 56 genes that contained putative binding sites at that p-value. Of 32 genes in our positive set that had sequence available for all five species, 30 had binding sites below this p-value. Of the 28 genes in the negative set for which sequences were available, only three had binding sites below this cutoff. In this (nearly ideal) case we have ruled out nearly 90% of the negative set at the expense of less than 10% of the positives.
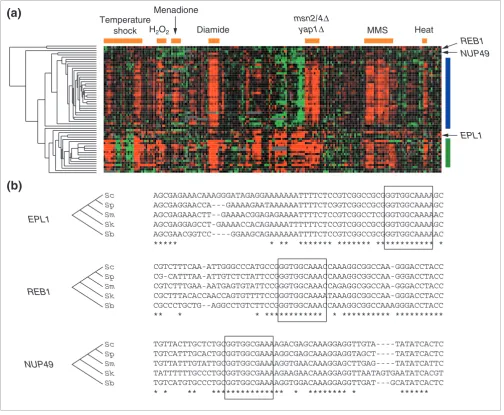
[image:7.612.56.555.86.371.2]Examining the expression patterns of these genes (Figure 4a) allows them to be divided into three major classes. The first is Significance of matches increases with evolutionary distance
Figure 2
Significance of matches increases with evolutionary distance. Median p-values for the positive (black squares) and negative (white triangles or white triangle points) sets of binding sites for (a) Gal4p and (b) Rpn4p at different evolutionary distances represented by comparing S. cerevisiae to different subsets of the available species. For both factors, as evolutionary distance increases, the median p-value of the functional matches decreases, indicating that they are less likely to have appeared by chance. Conversely, the median p-value of the nonfunctional matches (negative set, white symbols) increases. These observations agree with our predictions for the behavior of the p-values (solid traces) under either the HB evolution for the motif or HKY evolution for the background. There is little difference between these predictions and similar ones that assume that all the comparisons were pairwise (dotted traces).
Positive set
Negative set
p
-value
Evolutionary distance (substitutions per site)
Prediction
Gal4p Rpn4p
Prediction (pw) 1E-11
1E-10 1E-09 1E-08 1E-07 1E-06 1E-05 0.0001
0.0010 0.2 0.4 0.6 0.8 1 0.2 0.4 0.6 0.8 1 1.2
(a)
(b)
a group (indicated by a blue bar) containing 30 genes (28 of which were in our original positive set and two other genes) that show a very similar pattern over the entire set of condi-tions. The second group (indicated by a green bar) contains 11 genes (of which only one was in our original positive set) that show uncoordinated gene expression changes in some condi-tions in addition to the stereotypical Rpn4p expression pat-tern. It is possible that these genes' regulation is controlled by multiple mechanisms under different conditions [34], and regulation by Rpn4p is one contribution to their overall pat-tern of expression. Further supporting this hypothesis, only one of these genes (UFD1) is annotated as involved in protein degradation, and three (YBR062C, YOR052C and YER163C) have unknown functions.
Finally, and most surprising from the perspective of compar-ative annotation, is a third set of 14 genes, including one from our original positive set and three from our negative set, most of which show no evidence of the proteasomal expression pat-tern associated with Rpn4p (Figure 4b). It is extremely unlikely that these sequences have been conserved by chance, and we suggest that they represent matches that are con-served for reasons other than binding by Rpn4p (see Discussion).
Nonconserved binding sites in regulated genes
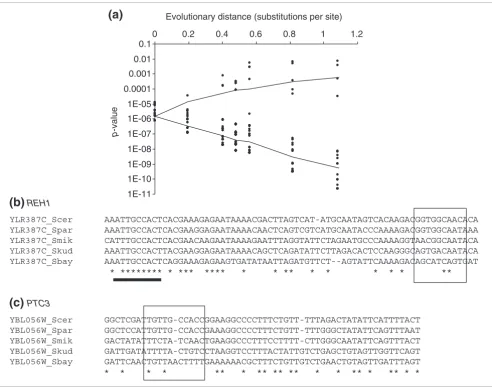
Having identified examples of conserved binding sites whose nearby genes showed no evidence of function, we decided to examine the converse: binding sites near regulated genes, and therefore presumably functional, that are not conserved. Fig-ure 5 shows the p-values of individual positive Rpn4p sites at different evolutionary distances. While most of the sites fol-low the trajectory predicted for sites evolving under the HB model, the p-values for four of the positive sites seem to be well-modeled by the 'background' or unconstrained model. This is surprising because we expect these binding sites to be functional, and therefore under purifying selection. One explanation is that some of these sites may have been misan-notated as functional. For example, in addition to a noncon-served positive site, the upstream region of REH1 contains another binding site that is a weaker match to the Rpn4p matrix (Figure 5b) and did not pass our threshold for inclusion in the positive set (see Materials and methods). This weaker match is more highly conserved and may represent the functional site in this promoter. In the case of PTC3, how-ever, we can find no other candidate binding sites nearby (Figure 5c). This represents a possible example of binding-site gain, a proposed mechanism of regulatory evolution at the molecular level (see Discussion).
Significance of binding sites in pairwise or three-way comparisons at similar evolutionary distance Figure 3
Significance of binding sites in pairwise or three-way comparisons at similar evolutionary distance. (a) Histogram of the percent identities of all aligned noncoding regions of S. cerevisiae and S. kudriavzevii (open squares) and S. cerevisiae, S. paradoxus and S. mikatae (filled squares). (b) Median p-values of functional matches (positive set, gray bars) and the nonfunctional matches (negative set, open bars) for S. cerevisiae and S. kudriavzevii alignments (left) and S. cerevisiae, S. paradoxus and S. mikatae alignments (right). The similarity of these p-values supports the idea that multiple similar genomes can be used to span longer evolutionary distances, but at these close evolutionary distances provide little additional power.
S. cerevisiae S. kudriavzevii
S. cerevisiae S. paradoxus S. mikatae
S. cerevisiae S. kudriavzevii
S. cerevisiae S. paradoxus S. mikatae
Percent of alignments
Percent identity
Median
p
-value
Positive set Negative set 0.06
0.05
0.04
0.03
0.02
0.01
0
0.2 0.4 0.6 0.8 1
0.00000001 0.0000001 0.000001 0.00001 0.0001 0.001
comm
en
t
re
v
ie
w
s
re
ports
refer
e
e
d
re
sear
ch
de
p
o
si
te
d r
e
se
a
rch
interacti
o
ns
inf
o
rmation
Different factors have different relationships between significance and evolutionary distance
The optimal selection of species for comparative sequence analysis remains an open question. To analyze this question for transcription factor binding sites, we examined the rela-tionship between evolutionary distance and the MONKEY p -values for several S. cerevisiae transcription factors (Figure 6) for which sufficient characterized binding sites were avail-able in SCPD [33]. We find that while all factors show the ten-dency for p-values to decrease with evolutionary distance, the
p-values for each factor remain very different. For example,
[image:9.612.54.558.87.502.2]with alignments of four species spanning about 0.8 substitutions per site, we expect a conserved match to the Gcn4p matrix as good as the median functional binding site (Figure 6a, red triangles) approximately every million bases of aligned sequence. This in contrast to Rpn4p, for which in the same alignments we expect such a match (Figure 6a, vio-let crosses) only once in about 1 billion base pairs. Thus, the evolutionary distance required to achieve a desired p-value is different for different factors. Understanding the relationship between a frequency matrix and the behavior of its p-values is an area for further theoretical exploration. We note that, once Relationship between conserved Rpn4p-binding sites and expression
Figure 4
Relationship between conserved Rpn4p-binding sites and expression. (a) We identified 56 Rpn4p-binding sites with p-values below 1.85 × 10⁻⁸ using all five species and the HB model. The expression patterns of these genes (clustered and displayed as in [44]) fall into two major groups: the 'stereotypical' proteasomal pattern (indicated by a blue bar at the right), and a second group expressed in these and additional conditions (indicated by the green bar). The orange bars above the expression data correspond to (left to right) temperature changes, treatment with H2O2, treatment with the superoxide generating drug menadione, treatment with the sulfhydryl oxidant diamide, deletions of YAP1 and MSN2/4, treatment with the DNA damaging agent methylmethanesulfonate (MMS), and heat shock in deletions of MEC1 and DUN1 [48,49]. (b) Examples of conserved Rpn4p sites (boxed) that do not fall in either expression group (neither blue nor green bar).
YBR049C_Sbay CGCCCTGCTG--AGGCCTGTCTTCCGGGTGGCAAACCAAAGGCGGCCAAAGGGACCTACC
Sc AGCGAGAAACAAAGGGATAGAGGAAAAAAATTTTCTCCGTCGGCCGCGGGTGGCAAAAGC
Sp AGCGAGGAACCA---GAAAAGAATAAAAAATTTTCTCGGTCGGCCGCGGGTGGCAAAAGC
Sm AGCGAGAAACTT--GAAAACGGAGAGAAAATTTTCTCCGTCGGCCTCGGGTGGCAAAAAC
Sk AGCGAGGAGCCT-GAAAACCACAGAAAATTTTTTCTCCGTCGGCCGCGGGTGGCAAAAGC
Sb AGCGAACGGTCC----GGAAGCAGAAAAAATTTTCTCCGTCGGCCGCGGGTGGCAAAAAC
***** * ** ******* ******* ************ *
YBR049C_Scer CGTCTTTCAA-ATTGGGCCCATGCCGGGTGGCAAACCAAAGGCGGCCAA-GGGACCTACC YBR049C_Spar CG-CATTTAA-ATTGTCTCTATTCCGGGTGGCAAACCAAAGGCGGCCAA-GGGACCTACC YBR049C_Smik CGTCTTTGAA-AATGAGTGTATTCCGGGTGGCAAACCAGAGGCGGCCAA-GGGACCTACC YBR049C_Skud CGCTTTACACCAACCAGTGTTTTCCGGGTGGCAAAATAAAGGCGGCCAA-GGGACCTACC
** * * ************ * ********** **********
YGL172W_Scer TGTTACTTGCTCTGCGGTGGCGAAAAGACGAGCAAAGGAGGTTGTA----TATATCACTC YGL172W_Spar TGTCATTTGCACTGCGGTGGCGAAAAGGCGAGCAAAGGAGGTAGCT----TATATCACTC YGL172W_Smik TGTTATTTGTATTGCGGTGGCGAAAAGGTGAACAAAGGAGCTTGAG----TATATCATTC YGL172W_Sbay TATTTTTTGCCCTGCGGTGGCGAAAAGAAGAACAAAGGAGGTTAATAGTGAATATCACGT YGL172W_Skud TGTCATGTGCCCTGCGGTGGCGAAAAGGTGGACAAAGGAGGTTGAT---GCATATCACTC
* * ** *************** * ******** *
EPL1 REB1 NUP49
Sc Sp Sm Sk Sb
Sc Sp Sm Sk Sb
Sc Sp Sm Sk Sb
Menadione
EPL1
NUP49 REB1
(a)
(b)
Temperature
shock H2O2 Diamide
msn2/4∆
yap1∆ MMS Heat
again, we can predict the behavior of these p-values (Figure 6b), and that while our predictions agree qualitatively, there is considerable variability.
Software
MONKEY is implemented in C++. It is available for download under the GPL and can be accessed over the web at [35].
Discussion
By formulating the problem of identifying conserved TFBSs in a probabilistic evolutionary framework, we have both cre-ated a useful tool (MONKEY) for comparative sequence anal-ysis capable of functioning on relatively large numbers of related species, and enabled the examination of several
important questions in comparative genomics. While most previous approaches to this problem have used heuristics to define conserved and nonconserved TFBSs, with the probabi-listic scores and p-value estimates presented here the assumptions underlying our approach can be made explicit, and where those assumptions hold we can be assured the reliability of our method. In addition, the probabilistic frame-work allows us to estimate the amount of evolutionary dis-tance required to achieve a certain level of significance.
Evolutionary models
[image:10.612.65.557.85.473.2]The score based on the evolutionary model proposed by Halp-ern and Bruno [25] effectively discriminated the functional and nonfunctional Gal4p- and Rpn4p-binding sites in S. cer-evisiae (Table 2). We believe the success of the HB model in Some apparently functional Rpn4p-binding sites are not conserved
Figure 5
Some apparently functional Rpn4p-binding sites are not conserved. (a) The MONKEY p-values (points) of all putatively functional Rpn4p-binding sites at varying evolutionary distances, along with the expected values under the HB and HKY models (solid traces). The majority of sites behave as expected for conserved binding sites (lower trace). Several, however, behave as expected for unconstrained sites (upper trace). (b) The predicted binding site (indicated by a box) in REH1, which encodes a protein of unknown function in S. cerevisiae, is not conserved, whereas a binding site with a lower score is conserved (indicated by a black bar). (c) A very poorly conserved match upstream of PTC3; in this case no other sites can be found in the region.
YLR387C_Scer AAATTGCCACTCACGAAAGAGAATAAAACGACTTAGTCAT-ATGCAATAGTCACAAGACGGTGGCAACACA YLR387C_Spar AAATTGCCACTCACGAAGGAGAATAAAACAACTCAGTCGTCATGCAATACCCAAAAGACGGTGGCAATAAA YLR387C_Smik CATTTGCCACTCACGAACAAGAATAAAAGAATTTAGGTATTCTAGAATGCCCAAAAGGTAACGGCAATACA YLR387C_Skud AAATTGCCACTTACGAAGGAGAATAAAACAGCTCAGATATTCTTAGACACTCCAAGGGCAGTGACAATACA YLR387C_Sbay AAATTGCCACTCAGGAAAGAGAAGTGATATAATTAGATGTTCT--AGTATTCAAAAGACAGCATCAGTGAT
* ******** * *** **** * * ** * * * * * **
YBL056W_Scer GGCTCGATTGTTG-CCACCGGAAGGCCCCTTTCTGTT-TTTAGACTATATTCATTTTACT YBL056W_Spar GGCTCCATTGTTG-CCACCGAAAGGCCCCTTTCTGTT-TTTGGGCTATATTCAGTTTAAT YBL056W_Smik GACTATATTTCTA-TCAACTGAAGGCCCTTTCCTTTT-CTTGGGCAATATTCAGTTTACT YBL056W_Skud GATTGATATTTTA-CTGTCCTAAGGTCCTTTACTATTGTCTGAGCTGTAGTTGGTTCAGT YBL056W_Sbay GATTCAACTGTTAACTTTTGAAAAAACGCTTTCTGTTGTCTGAACTGTAGTTGATTTAGT * * * * ** * ** ** ** * * ** * ** * *
Evolutionary distance (substitutions per site)
p
-value
(b)
REH1(c)
PTC30 0.2 0.4 0.6 0.8 1 1.2
1E-11 1E-10 1E-09 1E-08 1E-07 1E-06 1E-05 0.0001 0.001 0.01 0.1
comm
en
t
re
v
ie
w
s
re
ports
refer
e
e
d
re
sear
ch
de
p
o
si
te
d r
e
se
a
rch
interacti
o
ns
inf
o
rmation
predicting position-specific rates of evolution [19] and identi-fying conserved TFBSs reflects its encapsulation of a model of binding sites evolving under constant purifying selection. Although not every functional binding site will remain under purifying selection, as a result of either functional change or binding-site turnover (see below), a large subset of functional binding sites do remain under purifying selection, and for these, the 'HB' score performs better than the 'simple' score. It is interesting to note, however, that the simple score, which is not based on an evolutionary model and does not take into account the relationships of the species used in the compari-son, still shows great improvement over one genome alone, highlighting the value of comparative sequence data even when used suboptimally.
Effects of evolutionary distance
An important hypothesis of the comparative genomics para-digm is that as evolutionary distance increases, observing a match with a given level of conservation should become less and less likely by chance - the p-values for functional sites that are conserved are expected to decrease. We confirm this hypothesis for a small number of factors from S. cerevisiae. In addition, our probabilistic models allow us to quantify this relationship. We can directly measure the confidence that a specific site is a conserved binding site, and we can predict the
evolutionary distance needed to achieve a desired level of significance.
Typical p-values for functional binding sites scored by match-ing a matrix to a smatch-ingle genome are on the order of 10-4 to 10 -6. Even in a relatively small genome like yeast, with roughly 12
million bases, we expect many matches at this significance level to occur by chance. Adding four closely related species that span a total evolutionary distance of approximately one substitution per site reduces these p-values by approximately three orders of magnitude to the range 10-7 to 10-9. In the
yeast genome we expect few, if any, matches to occur at this level of significance by chance. When we search the align-ments of these species with the Rpn4p matrix with a low enough p-value that we expect a match at that significance to occur only once in a random 50 Mb genome, we recover nearly the entire positive set of Rpn4p-binding sites while excluding most of the negative set, highlighting the utility of MONKEY and the statistics we have developed. As a measure of the improvement over searching a single genome alone, we note that even the best possible match to the Rpn4p matrix in one genome does not meet this significance criterion.
The expected relationship between evolutionary distance and
p-value can, in principle, be used to guide to choice of species The evolutionary distance required to confidently identify conserved binding sites varies among transcription factors
Figure 6
The evolutionary distance required to confidently identify conserved binding sites varies among transcription factors. (a) Median p-values for functional binding sites for various factors at different evolutionary distances. The evolutionary distance needed to obtain a desired significance varies between factors. (b) Predicted dependence of the p-values on evolutionary distance. Specificity data and functional binding sites were obtained from the SCPD.
Gcn4p
Abf1p
Mcm1p
Gal4p
Rpn4p
p
-value
Evolutionary distance (substitutions per site)
1E-10 1E-09 1E-08 1E-07 1E-06 1E-05 0.0001 0.001
0 0.2 0.4 0.6 0.8 0 0.2 0.4 0.6 0.8
to be sequenced for comparative analyses. However, the dependence of p-values on evolutionary distance is not the same for all factors (Figure 6). This suggests that our ability to annotate functional sequences by comparative methods will depend on the type of sequences that we are trying to annotate, and that there is no single evolutionary distance sweet-spot for identifying TFBSs.
Pairwise versus multiple species comparisons
In theory, for a given reference genome it should be possible to pick a single comparison species at an evolutionary distance sufficient to identify any conserved feature of inter-est. Our results suggest that at distances of up to approxi-mately 0.6 substitutions per site, pairwise alignments provide essentially the same amount of resolving power as multiple comparisons spanning the same evolutionary distance. We showed that S. cerevisiae and S. kudriavzevii span almost exactly the same evolutionary distance as S. cerevisiae, S. paradoxus and S. mikatae, and that that distance is well below 0.6 substitutions per site. Consistent with this, MON-KEY produces nearly identical p-values for conserved binding sites from these two sets of species. Thus, our results suggest that from a theoretical perspective, if the goal of comparative analysis is to identify conserved binding sites for factors like the ones considered here, it is not necessary to sequence spe-cies much more closely related than this limit.
We note, however, that there are myriad practical reasons other than evolutionary resolving power (the only factor con-sidered in our models) for sequencing multiple closely related sequences. First, there may simply be no extant species at the exact evolutionary distance desired. Second, the quality of DNA alignments is expected to be much higher for multiple closely related species than for more distant pairwise align-ments - if alignment errors prevent correct assignment of orthology, conserved binding sites will not be identified. For the factors considered here, the pairwise comparison per-formed nearly as well as the multiple species comparison well beyond the evolutionary distances at which pairwise ments are reliable [36], suggesting that the necessity of align-ment will limit the maximum distance between species. Finally, and perhaps most important, is the assumption that our models make about constant functional constraint over evolution. To illustrate this, consider the binding sites for Gal4p used in the analysis in Figure 2a. These binding sites could not be included in Figure 3 because S. kudriavzevii
orthologs for these genes were not available in SGD, appar-ently because of the degeneration of the galactose-utilization pathway in this species [37]. Sequencing multiple closely related species provides insurance against such functional changes, because they are less likely to have occurred in all the lineages.
Conserved sites and binding-site turnover
MONKEY was very effective in identifying functional Rpn4p-binding sites from the alignment of five Saccharomyces
spe-cies. In our search, 41 of 56 (73%) predicted sites were found near genes showing the expected expression pattern, and are therefore likely to be functional. Even at this level of strin-gency, however, there are highly conserved sequences that match the matrix, but do not appear to be near genes that are regulated by Rpn4p. It is very unlikely that these sites are con-served by chance. One possible explanation for this high degree of conservation is that these are functional sites, but that the expression of these genes is not accurately detected in high-throughput assays, or their function has not been accu-rately determined. A more likely possibility is that these sites are conserved because they perform other, unknown func-tions. Consistent with this hypothesis is the fact that many of these matches fall near other highly conserved sequences (Figure 4b), suggesting that they may be parts of larger con-served features.
In addition to the conserved sequences that are unlikely to represent bona fide binding sites, we also found examples of binding sites associated with properly regulated genes that do not seem to be conserved (Figure 5). Once again there are sev-eral possible explanations for this observation. First, these binding sites may not actually be functional and may have been included in our positive set erroneously. While this is a possible explanation for the case of the Rpn4p-binding sites shown in Figure 5 (and may be likely in the case of REH1, where we could identify another apparently conserved bind-ing site in the region) we have also found nonconserved examples among the TFBSs in the SCPD database (approxi-mately 20% of TFBSs we examined, see Additional data file 1), all of which have at least some direct experimental support.
Another potential explanation is that these binding sites are actually conserved, but were not aligned correctly. While this is difficult to rule out in general, in the few nonconserved cases for Rpn4p at least we could not find (by eye) errors in the alignments. Most interesting, of course, would be the situation where these nonconserved binding sites are not due to some error on our part, but rather represent a biological change in the functional constraints on these sequences, pos-sibly resulting in a change in the regulation of the expression of these genes. Our results represent an upper bound on the number of TFBSs for which this has occurred. Cis-regulatory changes have been proposed to be an important source of genetic variation [32]. Gains and losses of functional binding sites represent an important class of these changes [38,39], and an important area for future computational and experi-mental analysis, particularly as the genome sequences of closely related metazoans become available. We expect MONKEY to be a useful tool in the comparative analysis of these genomes, and we have found comparable increases in the significance of functional binding sites in alignments of
comm
en
t
re
v
ie
w
s
re
ports
refer
e
e
d
re
sear
ch
de
p
o
si
te
d r
e
se
a
rch
interacti
o
ns
inf
o
rmation
Conclusions
We have developed a method to identify conserved TFBSs in sequence alignments from multiple related species that pro-vides a quantitative framework for evaluating results. The method - implemented in the open-source software MONKEY - extends probabilistic models of binding specifi-city to multiple species with probabilistic models of evolution. We have found that a probabilistic evolutionary model [25] that assumes binding sites are under constant purifying selec-tion performs effectively in discriminating funcselec-tional binding sites. We have developed methods to assess the significance of hits, and have shown that the significance of functional matches increases while the significance of spurious matches decreases over increasing evolutionary distance. We can explicitly model the relationship between the significance of a hit and evolutionary distance, allowing the assessment of the potential of any collection of genomes for identifying con-served binding sites. Applying MONKEY to a collection of related yeast species we find that most functional binding sites are highly significantly conserved, but also find evidence for conserved sites that are not functional and vice versa. Our results suggest that development of methods that model the evolutionary relationships between species and the evolution of the genomic features of interest yield insight into the chal-lenges for comparative genomics.
Materials and methods
Simulating pairs of sequencesTo generate the empirical p-values shown in Figure 1, random sequences of length w were generated according to the aver-age intergenic base frequencies of the S. cerevisiae genome. These were then evolved according to the Jukes-Cantor sub-stitution model, to a specified evolutionary distance. Likeli-hood ratio scores and p-values were then calculated for each of the pairs of sequences using the method implemented in MONKEY. Finally, all pairs of sequences were ranked by their scores, and the rank divided by the total number of pairs was taken as the empirical p-value.
Preparation of alignments for different groups of species
We aligned the upstream regions of all S. cerevisiae genes to their orthologs in S. paradoxus, S. mikatae, S. bayanus and
S. kudriavzevii by taking the 1,000 bp upstream of each gene, identifying the corresponding region from the other species using data in the Saccharomyces Genome Database [40], aligning them with CLUSTAL W [41] and trimming them to remove regions corresponding to S. cerevisiae coding sequence. We used this strategy rather than simply aligning intergenic regions to control for differences in alignments that might arise from the use of variably sized regions.
To obtain estimates of the evolutionary distance spanned by each comparison, we ran PAML [24] on the entire set of inter-genic alignments, using the HKY model [27], with constant
rates across sites. We used the median PAML estimate of kappa (the transition-transversion rate ratio) of 3.8, the S. cerevisiae background frequencies (ACGT) = (0.3, 0.2, 0.2, 0.3) and the median of the branch lengths estimates as the 'background' evolutionary model. The trees with these branch lengths were used as input to MONKEY to calculate p-values. The distances in Figure 4 represent the sum of the median branch lengths in each comparison. The subsets (with evolu-tionary distances in parentheses) were as follows: S. cerevi-siae and S. paradoxus (0.194); S. cerevisiae and S. mikatae
(0.403); S. cerevisiae, S. paradoxus S. mikatae (0.477); S. cerevisiae and S. bayanus (0.559); S. cerevisiae, S. para-doxus, S. mikatae and S. bayanus (0.816); S. cerevisiae, S. paradoxus, S. mikatae, S. bayanus and S. kudriavzevii
(1.090).
Definition of Rpn4p and Gal4p matrices and positive and negative sets
Rpn4p: we used Rpn4p sites in proteasomal genes [42,43] to build an Rpn4p specificity matrix (using a pseudocount of 1 per base per position). To identify additional likely targets, we obtained expression data from public sources [30,31] and compared the expression patterns of all genes to the average expression pattern of proteasomal genes using the following metric:
where θis the 'uncentered correlation', a commonly used dis-tance metric for gene-expression data [44]. Our score adds a correction for the number of datapoints, n, that are available for each gene. All matches to the Rpn4p matrix (S. cerevisiae
likelihood ratio score > 9) in the upstream region of a gene that matched the proteasomal expression pattern (t > 8) were considered to be true Rnp4p sites. The negative set consists of all sites that matched the Rpn4p matrix with a score greater than 9, and excluded sites in genes with even weak similarity to the proteasomal expression pattern (t > 0) or that were annotated [40] as involved in protein processing or degradation.
Gal4p: we used the matrix from SCPD [33] (with a pseudo count of 1 per base per position). To define a positive set we used the binding sites in SCPD and systematic studies of this Gal4p regulatory system [45,46], and used matches near additional genes that we identified in these studies with scores above the lowest score in the SCPD set. To define a negative set, we again scanned the S. cerevisiae genome with a cutoff equal to the lowest score in the positive set and then eliminated any binding sites near genes that showed evidence for regulation in the systematic studies.
It is important to note that our categorization of sequences as positive and negative is done independently of the compara-tive sequence data, thus avoiding potential circularity.
t= n− − θ
θ