comm
en
t
re
v
ie
w
s
re
ports
de
p
o
si
te
d r
e
se
a
rch
refer
e
e
d
re
sear
ch
interacti
o
ns
inf
o
rmation
GENECODIS: a web-based tool for finding significant concurrent
annotations in gene lists
Pedro Carmona-Saez
*
, Monica Chagoyen
*†
, Francisco Tirado
†
,
Jose M Carazo
*
and Alberto Pascual-Montano
†
Addresses: *BioComputing Unit, National Center of Biotechnology (CNB-CSIC), C/Darwin 3, Campus Universidad Autónoma de Madrid, 28049 Madrid, Spain. †Computer Architecture Department, Facultad de Ciencias Físicas, Universidad Complutense de Madrid, C/Avenida Complutense S/N, 28040 Madrid, Spain.
Correspondence: Alberto Pascual-Montano. Email: [email protected]
© 2007 Carmona-Saez et al.; licensee BioMed Central Ltd.
This is an open access article distributed under the terms of the Creative Commons Attribution License (http://creativecommons.org/licenses/by/2.0), which permits unrestricted use, distribution, and reproduction in any medium, provided the original work is properly cited.
Finding concurrent annotations in gene lists
<p>GENECODIS, a web-based tool for finding annotations that frequently co-occur in a set of genes and ranking them by their statistical significance, is presented.</p>
Abstract
We present GENECODIS, a web-based tool that integrates different sources of information to search for annotations that frequently co-occur in a set of genes and rank them by statistical significance. The analysis of concurrent annotations provides significant information for the biologic interpretation of high-throughput experiments and may outperform the results of standard methods for the functional analysis of gene lists. GENECODIS is publicly available at http:// genecodis.dacya.ucm.es/.
Rationale
High-throughput experimental techniques such as DNA microarrays or proteomics are allowing researchers to study biologic systems from a global perspective. In many cases, the net result of these experiments is a large list of genes or pro-teins that are potentially interesting for the analyzed system, for example genes that are differentially expressed among normal and pathologic tissues. A logical further step in the analysis workflow is to translate such lists of significant genes into functional descriptors that help researchers in the proc-ess of elucidating the biologic meaning of their experimental results.
Since Khatri and coworkers introduced Onto-Express [1], several methods have been proposed within this context, aimed at interpreting and extracting biologic knowledge from large lists of genes or proteins. Most of these applications find biologic annotations that are significantly enriched in a list of
genes with respect to a reference set, usually the whole genome or those genes used in a microarray. Using a specific source of information, for example Gene Ontology (GO) [2], those tools first find all of the GO terms associated with the set of analyzed genes. The number of appearances of each term is then determined in the input and reference lists, and a statistical test - usually the hypergeometric, χ2, bionomial,
or Fisher's exact test - is used to compute p values, which are subsequently adjusted for multiple testing. The result of this analysis is a list of single biological annotations from a given ontology (for instance, GO terms) with their corresponding p
values. Those terms with p values indicating statistical signif-icance are representative of the analyzed list of genes and can provide information about the underlying biologic processes. Good reviews of such methods are available elsewhere [3,4].
Most of the currently available tools, however, are designed to evaluate single annotations, which means that they provide a
Published: 4 January 2007
Genome Biology 2007, 8:R3 (doi:10.1186/gb-2007-8-1-r3)
Received: 3 July 2006 Revised: 29 September 2006 Accepted: 4 January 2007 The electronic version of this article is the complete one and can be
rence patterns can extend our understanding of the biologic events associated with a given experimental system. For example, a set of differentially expressed genes may be asso-ciated with the activation of biologic processes that are restricted to certain cellular organelles. Retrieving such asso-ciations provides meaningful and additional information for the interpretation of the experimental results.
In addition, the analysis of single annotations may show lim-itations in some cases. A simple motivating example of such limitations can be explained by using a hypothetical case of GO terms. There are categories such as 'signal transduction' that, although related to concrete aspects of the cell physiol-ogy, are associated with genes that are involved in disparate biologic processes, and therefore they may be annotated together with other terms such as 'cell proliferation' or 'apop-tosis'. In this scenario, in a list of genes annotated as 'signal transduction' and 'cell proliferation', we may find that none of these terms are significant because a large number of genes in the genome belonging to each one of these categories are not included in the analyzed set. On the contrary, the co-occur-rence of both categories might be significant if most of the genes simultaneously annotated with both terms are included in the list. This co-occurrence information reveals that a sig-nificant proportion of genes in the set are involved in specific signaling pathways related to cell proliferation. Therefore, relevant associations might be underestimated if only single annotations are taken into account.
These observations prompted us to develop GENECODIS, a web-based tool for finding sets of biological annotations that frequently appear together and are significant in a set of genes. It allows the integrated analysis of annotations from different sources (for example, KEGG pathways, Swiss-Prot keywords, GO, and InterPro motifs) and generates statistical rank scores for single annotations and their combinations. We believe that GENECODIS is an important extension of existing tools for the functional analysis of gene lists. GENE-CODIS is publicly available from the application website [5].
The GENECODIS algorithm
The application that we propose is simple in its concept; it takes a list of genes as input and determines biological anno-tations or combinations of annoanno-tations that are over-repre-sented with respect to a reference list. The novelty of this tool relies in the fact that, before computing the statistical test, it incorporates a new functionality to extract all combinations of annotations that appear in at least x genes, with x being a user-defined threshold (Figure 1 shows an overview of the methodology).
uses a modification to the methodology reported by Car-mona-Saez and coworkers [6], which implements the apriori
algorithm to extract associations among gene annotations and expression patterns.
The apriori algorithm was originally introduced by Agrawal and coworkers [7] and has been extensively used to extract association rules from transaction databases. This algorithm generates sets of elements that frequently co-occur in a data-base of transactions. Briefly, the procedure starts by deter-mining the set of all single annotations ('itemset') that appear in at least x genes (also known as support threshold) from the list of interest and establish the frequent k itemsets, where k
= 1. In the second iteration (k = 2), the set of frequent anno-tations found in the previous step is used to produce the new set of candidates of size 2 (2-itemset), and the database is scanned again to explore each gene and counting the fre-quency of each pair of annotations. However, if the set of annotations does not satisfy the minimum support constraint - that is, they do not occur in at least x genes - then they are not further considered to generate larger itemsets. The proce-dure continues until no more combinations are possible. At the end of this search all itemsets that contain the collection of annotations that co-occur in at least x genes are obtained (Additional data file 1).
In our previous work [6] we used the apriori algorithm to extract association rules among gene annotations and expres-sion patterns. However, in this work we use it as the initial step in the methodology included in GENECODIS, namely the extraction of sets of annotation that frequently co-occur in a gene list.
It is important to note that increasing the number of different items (sources of annotation in this case) while decreasing the minimum support value can significantly multiply the number of concurrences and thus the computation time. Additional data file 1 contains a complete study of execution time and size of the itemsets for different support values in real datasets. Very extreme scenarios, such as extracting all possible combinations of terms that appear in at least one gene (support value of 1), is in many cases a computationally unfeasible task. For this reason we have provided the applica-tion with a minimum support value of 3, which is a reasonable threshold to extract significant biological information from gene lists.
Statistical analysis
Once all combinations of annotations that appear in at least x
comm
en
t
re
v
ie
w
s
re
ports
refer
e
e
d
re
sear
ch
de
p
o
si
te
d r
e
se
a
rch
interacti
o
ns
inf
o
rmation
simultaneously co-annotated with those terms. By default, GENECODIS uses as a reference set all genes from the corre-sponding genome at the NCBI Entrez Gene database [8], but users can upload their own reference set (for example, genes in a chip). Then, a statistical test is applied to identify catego-ries, and their combinations, that are significantly enriched in the list of genes. Two statistical tests are implemented in GENECODIS: the hypergeometric distribution and the χ2 test
of independence. For a detailed description of these methods in the context of the ontological analysis of gene lists, see the work of Draghici and coworkers [9] and the online help for the program.
The p values can then be adjusted for multiple tests using a simulation-based correction approach [10,11] or the false dis-covery method proposed by Benjamini and Hochberg [12].
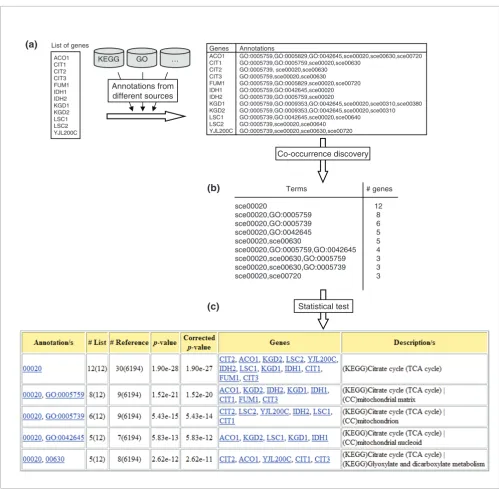
[image:3.612.56.555.84.573.2]Overview of the methodology Figure 1
Overview of the methodology. (a) Annotations from several sources are assigned to genes in the input list. (b) The apriori algorithm is applied to find sets of annotations that frequently co-occur in the input list. (c) The statistical significance of each annotation or set of concurrent annotations is calculated based on its frequency in the input and reference sets. The figure illustrates an example in which a list of yeast genes is annotated with Gene Ontology (GO) terms for 'cellular component' and KEGG pathways. In the output table only the annotations that co-occur in more than five genes are shown.
List of genes
ACO1 CIT1 CIT2 CIT3 FUM1 IDH1 IDH2 KGD1 KGD2 LSC1 LSC2 YJL200C
Co-occurrence discovery ACO1
CIT1 CIT2 CIT3 FUM1 IDH1 IDH2 KGD1 KGD2 LSC1 LSC2 YJL200C
GO:0005759,GO:0005829,GO:0042645,sce00020,sce00630,sce00720 GO:0005739,GO:0005759,sce00020,sce00630
GO:0005739, sce00020,sce00630 GO:0005759,sce00020,sce00630
GO:0005759,GO:0005829,sce00020,sce00720 GO:0005759,GO:0042645,sce00020 GO:0005739,GO:0005759,sce00020
GO:0005759,GO:0009353,GO:0042645,sce00020,sce00310,sce00380 GO:0005759,GO:0009353,GO:0042645,sce00020,sce00310 GO:0005739,GO:0042645,sce00020,sce00640
GO:0005739,sce00020,sce00640 GO:0005739,sce00020,sce00630,sce00720
Genes Annotations
Statistical test
KEGG GO …
Annotations from different sources
sce00020
sce00020,GO:0005759 sce00020,GO:0005739 sce00020,GO:0042645 sce00020,sce00630
sce00020,GO:0005759,GO:0042645 sce00020,sce00630,GO:0005759 sce00020,sce00630,GO:0005739 sce00020,sce00720
12 8 6 5 5 4 3 3 3
Terms # genes
(b)
extracted (as described above) from this random list and their corresponding p values are calculated. This process is repeated 10,000 times and the corrected p value for each k
itemset is calculated as the fraction of simulations having any
k itemset with a p value as good as or better than the p value for that k itemset.
Therefore, the result of the analysis performed by GENECO-DIS consists of a list of annotations or combinations of anno-tations with their corresponding p values. Annotations exhibiting p values below a certain threshold can be consid-ered significantly associated with the list of genes under study and can be used to discern the biologic mechanisms relevant to the experimental system.
Implementation
GENECODIS is a web-based tool that is freely accessible from the application website [5]. It uses the Entrez Gene database [8] as the backbone data structure to link the functional anno-tations imported from GO together with the correspondences among gene identifiers (IDs). It allows users to upload gene lists using different IDs, including, for example, Gene Sym-bols, Entrez Gene, or Unigene IDs (more information about the identifiers supported for each organism can be found in the application website). If duplicated IDs are used in the input list, then they are treated as unique entries.
For each organism GENECODIS provides analysis of differ-ent annotations, including the three GO categories (biological process, cellular component, and molecular function), KEGG pathways, InterPro Motifs, and Swiss-Prot keywords. GO annotations for each gene are imported from the NCBI Entrez Gene database. GENECODIS allows users to select different levels of the GO hierarchy as well as GO Slim terms [13]. Information about metabolic pathways is imported from KEGG database [14], whereas Swiss-Prot keywords and InterPro motifs are imported from Swiss-Prot database.
Regarding the supported organisms, GENECODIS currently works with Arabidopsis thaliana, Bos taurus, Caenorhabdi-tis elegans, Danio rerio, Drosophila melanogaster, Gallus gallus, Homo sapiens, Mus musculus, Rattus norvegicus,
Saccharomyces cerevisiae, and Schizosaccharomyces pombe. More organisms and annotations will be systemati-cally added in future versions of the application.
One relative limitation derived from the in-depth search per-formed is the increase in the computational cost and time as more annotation categories are analyzed. To tackle this limi-tation GENECODIS uses an efficient technique to extract fre-quent itemsets [6]. Additionally, GENECODIS runs on a
16-GENECODIS at work
We provide two examples showing the analysis performed by GENECODIS and how the results obtained as combinations of several biological annotations provide additional informa-tion that may be useful in the interpretainforma-tion of high-through-put experimental data.
Yeast data
To illustrate GENECODIS, we show the results obtained using data generated by Smith and coworkers [15]. They used oligonucleotide-based whole genome microarrays to measure gene expression levels in yeast during growth in oleate (per-oxisome induction) and growth in glucose (per(per-oxisome repression conditions). Using different clustering algorithms they identified 224 yeast genes whose expression patterns were similar to well known peroxisomal genes.
The list of these 224 genes was re-analyzed using GENECO-DIS, selecting biological process (BP) and cellular component (CC) GO Slim annotations. The simultaneous analysis of both categories provided a global picture of the biological proc-esses associated with the experimental system linked to cellu-lar localization information (Figure 2). As was expected, the most significant category associated with this gene list was 'peroxisome' (CC). Other single categories that were highly representative were 'generation of precursor metabolites and energy' (BP), 'carbohydrate metabolism' (BP), and 'lipid metabolism' (BP), which is consistent with the observation that the shift to growth in the presence of oleate activates genes encoding enzymes that are involved in fatty acid degra-dation, allowing efficient use of the new carbon source [16].
comm
en
t
re
v
ie
w
s
re
ports
refer
e
e
d
re
sear
ch
de
p
o
si
te
d r
e
se
a
rch
interacti
o
ns
inf
o
rmation
Another interesting set of annotations that show the useful-ness of the application are those categories related to mito-chondrial genes. Forty-eight out of 887 yeast genes annotated as 'mitochondrion' (CC) were present in the list, and therefore this annotation exhibited a p value of 0.0248 (simulation corrected p value = 0.2; Additional data file 2). Consequently, based on the statistical test, this annotation is not considered significant. Nevertheless, GENECODIS was able to identify a set of significant co-annotations related to mitochondrial genes. For example, 6 out of 21 yeast genes that were simulta-neously annotated with 'mitochondrion' (CC) and 'lipid metabolism' (BP) were present in the list, and this co-annota-tion exhibited a p value of 0.000162 (simulation corrected p
value = 0.0086). Among these genes was, for example, the
CRC1 gene, which is a mitochondrial inner membrane carni-tine transporter that is required for carnicarni-tine-dependent transport of acetyl-coenzyme A from peroxisomes to mito-chondria. In the same way, the co-annotation of
'mitochon-drial membrane' (CC) and 'generation of precursor metabolites and energy' (BP) related to a subset of genes that are component of the mitochondrial respiratory chain was found to be significant, with a simulation corrected p value of 0.004.
Although fatty acid β-oxidation in Saccharomyces cerevisiae
is restricted to peroxisomes, the association of mitochondrion related categories to this set of genes is highly consistent with the important role of these organelles in the metabolism of β -oxidation products. Acetyl-coenzyme A, the final product of the fatty acid β-oxidation pathway in peroxisomes is trans-ported to the mitochondria for the final oxidation to CO2 and H2O [17]. In this way, peroxisomal fatty acid β-oxidation demands a functional mitochondrial electron transport chain for energy production, and either functional peroxisomes and mitochondria are required for growth in the presence of oleate [15].
[image:5.612.56.554.87.429.2]Screenshot depicting results of the analysis of yeast genes Figure 2
reported by Su and coworkers [18]. This dataset was also used by Zhang and colleagues [19] to illustrate the performance of the GOTree Machine (GOTM) software, and therefore it rep-resents a good test case for our method. Zhang and col-leagues, using GOTM, reported four main groups of GO biological process annotations related to the testis gene clus-ter: categories related to cell proliferation, cell cycle, mitosis, and meiosis; categories related to testis specific development; categories related to protein phosphorylation; and categories related to glycerolipid metabolism.
We used our tool to analyze this set of genes using the GO bio-logical process categories and InterPro motifs that appear in at least three genes. The most significant concurrences are shown in Figure 3. Similar results to those reported by Zhang and coworkers [19] were obtained by GENECODIS, except for the case of categories related to glycerolipid metabolism, which were not extracted because they were present in only two genes. In addition, GENECODIS was able to provide new information for the functional interpretation of this set of
biological process categories and contained protein kinase motifs. The importance of this observation is the explicit con-nection between 'protein amino acid phosphorylation' and 'cell cycle' categories.
In order to explain the 'protein phosphorylation' category in the context of the phenotypic feature of the gene cluster, Zhang and colleagues [19] remarked that, 'spermatozoa undergo a series of changes before and during egg binding to acquire the ability to fuse with the oocyte. These priming events are regulated by the activation of compartmentalized intracellular signaling pathways, which control the phospho-rylation status of sperm proteins.'
Results provided by GENECODIS complement this finding and point out that, in this particular case, the 'protein phos-phorylation' category is mainly related to proteins that are involved in cell cycle. Indeed, activation and inhibition of many key regulators of cell cycle are carried out by phospho-rylation/dephosphorylation events.
[image:6.612.60.557.370.674.2]Screenshot depicting results of the analysis of human genes Figure 3
comm en t re v ie w s re ports refer e e d re sear ch de p o si te d r e se a rch interacti o ns inf o rmation
This finding can be confirmed by examining the genes that were co-annotated with both categories: CDC2 (Entrez Gene ID: 983), aurora kinase A (Entrez Gene ID: 6790), NEK2
(Entrez Gene ID: 4751), BUB1 (Entrez Gene ID: 699), and
BUB1B (Entrez Gene ID: 701). All of these have been associ-ated with testis tissues and cell proliferation events in previ-ous studies. For example, the NEK2 gene is predominantly expressed in spermatocytes and appears to be associated with meiotic chromosomes in these cells [20]; expression of the gene BUB1B in testis decreases with advancing age, and it may play a role in regulating infertility [21].
These two examples illustrate the type of information pro-vided by GENECODIS, which can be useful in helping researchers to interpret large lists of genes generated by high-throughput experimental techniques.
Discussion
High-throughput experimental techniques, such as DNA microarrays, have opened new ways to study biological sys-tems from a global perspective. In many cases, these tech-niques generate huge amounts of data in the form of large gene or protein lists that share a common property, for exam-ple genes that are differentially expressed among pathologic and normal tissues. These data can provide a basis for the characterization of unknown genes, and at the same time they are also the basis for elucidating the biological processes asso-ciated with the experimental system. Methods based on the ontological analysis of such lists of genes have proved to be very useful tools for the analysis and interpretation of the underlying biological mechanisms.
However, most of the current applications for functional pro-filing essentially use the same general approach and generate statistical scores for single annotations. They mainly differ on aspects such as the statistical test used, supported annota-tions and organisms, the gene identifiers that they are able to manage, and visualization capabilities. Indeed, a relevant conclusion of a review of such tools recently reported by Khatri and Draghici [3] was that it would be more beneficial if future applications expand the current approach rather than providing endless variations of the same idea.
GENECODIS was designed to expand the biological enrich-ment of annotations by adding the possibility of extracting not only single enriched categories, but also significant com-binations of them. To the best of our knowledge there is no other tool available in the field that integrates information from different sources in a flexible way for concurrent enrich-ment studies. A comparison of GENECODIS with related tools [1,22-25] and an example with test data [26] is provided in Additional data file 3. We hope that this tool will help by complementing available analysis tools for the large genome research community.
Additional data files
The following additional data are available with the online version of this article. Additional data file 1 contains an illus-trative example of the GENECODIS algorithm in operation. Additional data file 2 contains the results obtained by GENE-CODIS in the analysis of the yeast and human gene sets. Addi-tional data file 3 provides a description of a comparative analysis of the results provided by GENECODIS and other related tools.
Additional data file 1
An illustrative example of the GENECODIS algorithm in operation A file containing an illustrative example of the GENECODIS algo-rithm in operation.
Click here for file Additional data file 2
Results obtained by GENECODIS in the analysis of yeast and human gene sets
A file containing the results obtained by GENECODIS in the analy-sis of the yeast and human gene sets.
Click here for file Additional data file 3
Description of a comparative analysis of results provided by GENE-CODIS and other related tools
A compressed file containing a description of a comparative analy-sis of the results provided by GENECODIS and other related tools. Click here for file
Acknowledgements
This work was partially funded by Spanish grants CICYT BFU2004-00217/ BMC, GEN2003-20235-c05-05, CYTED-505PI0058, TIN2005-5619, PR27/ 05-13964-BSCH and S-GEN-0166-2006, and a collaborative grant between the Spanish CSIC and the Canadian NRC (CSIC-050402040003). PCS is recipient of a grant from Comunidad Autonoma de Madrid (CAM). APM acknowledges the support of the Spanish Ramón y Cajal program. We thank Enrique de la Torre and Cesar Vicente for their technical support.
References
1. Khatri P, Draghici S, Ostermeier GC, Krawetz SA: Profiling gene expression using onto-express. Genomics 2002, 79:266-270. 2. Ashburner M, Ball CA, Blake JA, Botstein D, Butler H, Cherry JM,
Davis AP, Dolinski K, Dwight SS, Eppig JT, et al.: Gene ontology: tool for the unification of biology. The Gene Ontology Consortium. Nat Genet 2000, 25:25-29.
3. Khatri P, Draghici S: Ontological analysis of gene expression data: current tools, limitations, and open problems. Bioinfor-matics 2005, 21:3587-3595.
4. Draghici S: Data Analysis Tools for DNA Microarrays Boca Raton, FL: Chapman & Hall/CRC Press; 2003.
5. GENECODIS [http://genecodis.dacya.ucm.es/]
6. Carmona-Saez P, Chagoyen M, Rodriguez A, Trelles O, Carazo JM, Pascual-Montano A: Integrated analysis of gene expression by Association Rules Discovery. BMC Bioinformatics 2006, 7:54. 7. Agrawal R, Imielinski T, Swami A: Mining association rules
between sets of items in large databases. In Proceedings of the ACM SIGMOD International Conference on Management of Data: 26-28 May 1993; Washington, DC Edited by: Buneman P, Jajodia S. New York, NY: ACM Press; 1993:207-216.
8. Maglott D, Ostell J, Pruitt KD, Tatusova T: Entrez Gene: gene-centered information at NCBI. Nucleic Acids Res 2005, 33:D54-D58.
9. Draghici S, Khatri P, Martins RP, Ostermeier GC, Krawetz SA: Glo-bal functional profiling of gene expression. Genomics 2003, 81:98-104.
10. Berriz GF, King OD, Bryant B, Sander C, Roth FP: Characterizing gene sets with FuncAssociate. Bioinformatics 2003, 19:2502-2504.
11. Boyle EI, Weng S, Gollub J, Jin H, Botstein D, Cherry JM, Sherlock G: GO::TermFinder - open source software for accessing Gene Ontology information and finding significantly enriched Gene Ontology terms associated with a list of genes. Bioinfor-matics 2004, 20:3710-3715.
12. Benjamini Y, Hochberg Y: Controlling the false discovery rate: a practical and powerful approach to multiple testing. J R Stat Soc 1995, 57:289-300.
13. GO Slim [http://www.geneontology.org/GO.slims.shtml] 14. Kanehisa M, Goto S, Kawashima S, Okuno Y, Hattori M: The KEGG
resource for deciphering the genome. Nucleic Acids Res 2004, 32:D277-D280.
15. Smith JJ, Marelli M, Christmas RH, Vizeacoumar FJ, Dilworth DJ, Ideker T, Galitski T, Dimitrov K, Rachubinski RA, Aitchison JD: Tran-scriptome profiling to identify genes involved in peroxisome assembly and function. J Cell Biol 2002, 158:259-271.
AP, Vega RG, Sapinoso LM, Moqrich A, et al.: Large-scale analysis of the human and mouse transcriptomes. Proc Natl Acad Sci USA 2002, 99:4465-4470.
19. Zhang B, Schmoyer D, Kirov S, Snoddy J: GOTree Machine (GOTM): a web-based platform for interpreting sets of inter-esting genes using Gene Ontology hierarchies. BMC Bioinformatics 2004, 5:16.
20. Rhee K, Wolgemuth DJ: Tcp10 promoter-directed expression of the Nek2 gene in mouse meiotic spermatocytes. Mol Cells 2002, 13:85-90.
21. Baker DJ, Jeganathan KB, Cameron JD, Thompson M, Juneja S, Kopecka A, Kumar R, Jenkins RB, de Groen PC, Roche P, van Deursen JM: BubR1 insufficiency causes early onset of aging-associated phenotypes and infertility in mice. Nat Genet 2004, 36:744-749.
22. Al-Shahrour F, Minguez P, Vaquerizas JM, Conde L, Dopazo J: BABE-LOMICS: a suite of web tools for functional annotation and analysis of groups of genes in high-throughput experiments. Nucleic Acids Res 2005, 33:W460-W464.
23. Castillo-Davis CI, Hartl DL: GeneMerge: post-genomic analysis, data mining, and hypothesis testing. Bioinformatics 2003, 19:891-892.
24. Dennis G Jr, Sherman BT, Hosack DA, Yang J, Gao W, Lane HC, Lem-picki RA: DAVID: Database for Annotation, Visualization, and Integrated Discovery. Genome Biol 2003, 4:P3.
25. Zhang B, Kirov S, Snoddy J: WebGestalt: an integrated system for exploring gene sets in various biological contexts. Nucleic Acids Res 2005, 33:W741-748.