Introduction
Gout is a form of infl ammatory arthritis that is charac-terized initially by acute attacks of active synovitis related to the presence of monosodium urate (MSU) crystals in the joints and periarticular soft tissues. Chronic gouty arthropathy may supervene after a period of years, featuring ongoing synovitis in peripheral and, occasionally,
axial joints, often associated with the presence of tophi
and accom panied by bone erosion. Plain radiography
(XR) tends to be normal in early gout, but in chronic gout, typically after 7 to 10 years, ‘punched out’ extramarginal, articular, or para-articular erosions may become apparent with typical preservation of the joint space and bone density [1]. In advanced tophaceous disease, extreme bone destruction can develop with large periarticular lytic lesions associated with apparent joint space widening (Figure 1) [2], and concomitant osteo-arthritis frequently accompanies these changes, espe-cially in the feet.
In recent years, advanced imaging techniques, includ-ing magnetic resonance imaginclud-ing (MRI), computed tomo-graphy (CT) using high-resolution multislice scanners, and ultrasonography (US), have led to new insights into the pathology of many forms of infl ammatory arthritis [3]. Scoring systems have been developed to quantify joint infl ammation and destruction by using imaging and these are now in routine use in clinical trials to provide
sensitive measures of drug effi cacy in rheumatoid
arthritis (RA) and psoriatic arthritis (PsA) [4,5]. In gout, the applications of advanced imaging are only now starting to be explored and are of particular relevance to the clinician assessing the impact of urate-lowering therapies [6]. Th ese applications include (a) imaging to investigate joint pathology in gout, (b) imaging to assist in the diagnosis of gout, and (c) monitoring of joint infl ammation and damage, especially in response to therapy. Th is review presents a critical appraisal of the current literature pertaining to advanced imaging in gout and provides specifi c discussion of these areas related to each modality.
1. Joint pathology in gout
Before the advent of advanced imaging, an understanding of the pathology of gout was based primarily on light microscope examination of tophi and periarticular bone, supplemented by XR to defi ne the radiographic mor-phology and distribution of erosions [7]. Th is approach was biased toward investigating severe erosive gouty arthropathy, and specimens obtained for histopathology were usually derived from amputated digits or limbs,
Abstract
There are many exciting new applications for advanced imaging in gout. These modalities employ multiplanar imaging and allow computerized three-dimensional rendering of bone and joints (including tophi) and have the advantage of electronic data storage for later retrieval. High-resolution computed tomography has been particularly helpful in exploring the pathology of gout by investigating the relationship between bone erosions and tophi. Magnetic resonance imaging and ultrasonography can image the infl ammatory nature of gouty arthropathy, revealing synovial and soft tissue infl ammation, and can provide information about the composition and vascularity of tophi. Dual-energy computerized tomography is a new modality that is able to identify tophi by their chemical composition and reveal even small occult tophaceous deposits. All modalities are being investigated for their potential roles in diagnosis and could have important clinical applications in the patient for whom aspiration of monosodium urate crystals from the joint is not possible. Imaging can also provide outcome measures, such as change in tophus volume, for monitoring the response to urate-lowering therapy and this is an important application in the clinical trial setting.
© 2010 BioMed Central Ltd
Imaging in gout - What can we learn from MRI, CT,
DECT and US?
Fiona M McQueen*
1, Anthony Doyle
2and Nicola Dalbeth
3R E V I E W
*Correspondence: [email protected]
1Department of Molecular Medicine and Pathology, Faculty of Medicine and Health Sciences, University of Auckland, 85 Park Road, Grafton, Auckland 1023, New Zealand
Full list of author information is available at the end of the article
McQueen et al. Arthritis Research & Therapy 2011, 13:246 http://arthritis-research.com/content/13/6/246
where chronically discharging tophi were often secon-darily infected [8]. By contrast, advanced imaging tech-niques open a window into the pathology of gout at any stage of the disease process, including at presentation and in early disease, when XRs are characteristically normal and histopathological specimens are unavailable.
Computed tomography reveals tophi adjacent to erosions
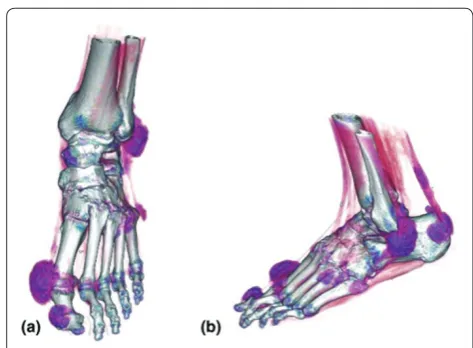
Using advanced multislice CT scanning, our own group investigated the question of whether tophi were likely to be responsible for bone erosion in gout – an impression gained from XR review but not previously confi rmed by using a multiplanar high-defi nition modality. Paired radio graphs and CT scans were available for investigation in a total of 798 individual hand and wrist joints. For those bones with large radiographic erosions, 96 out of 98 (98%) had CT evidence of associated tophus. For CT erosions, 82% had visible intraosseous tophi; of the larger erosions (measuring greater than 7.5 mm in diameter), 100% (56 out of 56) contained tophi. Th ere was also a very strong correlation between the diameters of CT erosions and intraosseous tophi (r = 0.93), indicating that the gouty tophus sits snugly in its pocket of bone, which may be entirely intraosseous or have a cortical breach, which, if profi led on XR, will appear as a typical gouty erosion. Figure 2 shows a three-dimensional (3D) reconstruction of a CT scan revealing discrete tophi at multiple sites adjacent to bone and within soft tissues.
The magnetic resonance imaging view of tophi
MRI scanning can also be used to image tophi, and the information this modality reveals about the infl ammatory
[image:2.612.310.547.86.260.2]nature of these lesions cannot be appreciated from XR or CT scanning. On MRI, tophi typically exhibit low signal on T1-weighted images and medium to high signal on T2-weighted (T2w) images, indicating the presence of cellular tissue surrounding or infi ltrating the crystalline mass [9,10]. Th e vascularity of this tissue will infl uence the degree of MRI post-contrast enhancement (Figure 3), and calcifi cation within the tophus can lead to regions of low signal on T2w images [9]. Th ese features are consis-tent with the characteristics of tophi that have been excised and examined using the tools of immuno-histochemistry. Palmer and colleagues [11] described the structure of a typical tophus as consisting of a mostly acellular crystalline core surrounded by a ‘corona zone’ and an outer, loose ‘fi brovascular zone’. Dalbeth and colleagues [12] characterized the cellular architecture further in their study of 16 resected tophi. Within the corona zone, multiple cell types, including macrophages, mast cells, and lymphocytes, could be found adjacent to osteoclasts. Expression of interleukin-1β was high in this region, providing a putative mechanism for osteoclast activation and bone resorption, and indeed evidence of enhanced osteoclastogenesis has been obtained in vitro and in vivo by these authors [13]. MRI has also provided information about the morphology of tophi, which can vary from ‘discrete nodular masses’ to ill-defi ned amorphous deposits that can spread along anatomical planes or in a ‘permeative’ manner without regard to compartments, as described by Popp and colleagues [14] at the wrist. Clearly, many of these lesions are not amenable to resection, leaving only imaging to inform us about their position and internal structure.
Figure 1. Plain radiograph of the hands of a Pacifi c islander man with longstanding tophaceous gout.Radiograph shows multiple erosions, some of which are extramarginal. Regions of bony lysis adjacent to soft tissue densities represent tophi.
Figure 2. Three-dimensional reconstruction of helical multidetector computed tomography scan of the foot of a patient with tophaceous gout.Tophi at multiple locations, including adjacent to the metatarsophalangeal and interphalangeal joints of the big toe, are shown. (a) Anteroposterior view and (b)
[image:2.612.68.301.90.271.2]Ultrasound reveals tophi and urate crystals
Ultrasound provides a diff erent ‘sonar’ picture of tophi, which may appear as hypoechoic, hyperechoic, or mixed echogenicity nodules, as described by Schueller-Weide-kamm and colleagues [15] (Figure 4). Th e commonly seen surrounding hypoechoic ‘halo’ probably corresponds to the outer, loose fi bro vascular zone seen on histology [16]. Th ese authors detected ‘dorsal shadowing’ over cartilage surfaces causing partial refl ection of the US wave. Th is is the same entity as the ‘double contour’ sign (described by Th iele and Schlesinger [17]), whereby an echogenic line was detected parallel to the cortex (of, for example, a metatarsal head) with an anechoic region between, representing hyaline cartilage. MSU crystals have been proposed to form in a fi ne layer like icing sugar over the cartilage, but formal confi rmation of this by comparison with histopathology has not been performed, because of diffi culty obtaining and analyzing anatomical samples. Both ultrasound and MRI scanning can also image the infl ammatory aspect of gouty arthopathy, including synovitis, tenosynovitis, and edematous soft tissue infl ammation. Regions of thickened soft tissue that have moderate US echogenicity and that might represent
diff use infi ltration with MSU crystals have been
described [17]. Evidence of increased vascularization within the synovial membrane can be obtained on power Doppler images and contrast-enhanced MRI scans [15].
Erosions and bone marrow edema
Bone erosions in gout can be detected by MRI or US and may contain enhancing synovium as has been described in RA [18]. MRI bone marrow edema also occurs in gout and was described by Yu and colleagues [9], in 3 of their 5 patients, adjacent to intraosseous tophi. Our own recent study of the MRI features of gout in 47 patients showed bone marrow edema to be present in 36% of those with uncomplicated gout (when it was often mild) but to be
almost universal in those with gout complicated by osteomyelitis (when it was usually fl orid) [19]. In RA, MRI bone marrow edema is related to infl ammatory osteitis [5,6]; in osteoarthritis, it is thought to indicate fi brosis and necrosis within subcortical bone [7]. In gout, the pathological correlate of MRI bone marrow edema remains unknown, and further studies are required to elucidate this.
2. Diagnosing gout by using advanced imaging
A diagnosis of gout currently rests on a demonstration of MSU crystals in synovial fl uid or joint tissue or a typical clinical picture that might include acute joint swelling of abrupt onset and remission within 2 weeks, the occur-rence of podagra, a raised serum urate, and, in some patients, the presence of tophi. According to 2006 Euro-pean League Against Rheumatism (EULAR) evidence-based recommendations [20], ‘radiographs have little role in diagnosis, though in late or severe gout radiographic changes of asymmetrical swelling and subcortical cysts without erosion may be useful to diff erentiate chronic gout from other joint conditions’. Th e contribution of advanced imaging would be to assist the diagnosis of gout at an earlier phase by revealing acute joint infl ammation, bone erosion, or tophi or a combination of these. Ideally, such imaging would identify certain specifi c features that would confi rm a diagnosis of gout without the necessity for joint aspiration. Most of the advanced imaging modalities take us some way down this path but do not deliver ultimate certainty of diagnosis. No study comparing the diagnostic accuracy of any of these techniques with the current clinical gold standard out lined above has yet been done.
Magnetic resonance imaging
[image:3.612.72.547.90.229.2]In clinical practice, MRI scans have been reported as useful in diagnosing gout in unusual settings. As reported
Figure 3. Axial magnetic resonance imaging scans of a large tophus adjacent to the second metatarsal head of a Pacifi c islander man with longstanding tophaceous gout. (a) T1-weighted (T1w) image reveals low-signal intensity tophus. (b) T1w post-contrast image reveals rim enhancement and a non-enhancing focus indicating fl uid within the tophus (arrow). (c) T2-weighted image shows a crescent of fl uid (white) corresponding to the non-enhancing focus on contrast-enhanced images.
McQueen et al. Arthritis Research & Therapy 2011, 13:246 http://arthritis-research.com/content/13/6/246
by Nygaard and colleagues [21], an epidural abscess was suspected clinically in a patient with fever and low back pain, but the MRI revealed a large tophus (confi rmed on aspirate) associated with vertebral destruction. In a similar vein, Gardner and McQueen [22] reported tophaceous gout of the symphysis pubis (confi rmed on aspirate), in which the presentation had suggested infection or malignancy. MRI is an eff ective tomographic modality to image these tophaceous masses, which may not be detected clinically if deep below the skin surface. Th eir presence strongly suggests a diagnosis of gout, but aspirate confi rmation is usually required as the diff eren-tial diagnosis includes infection or other space-occupying lesions.
Ultrasound
Similarly, the US detection of tophi could be helpful in diagnosing gout, especially when these lesions are not detectable clinically. Perez-Ruiz and colleagues [23], in their study of 25 patients with crystal-proven gout, found many presumed tophi at ‘hidden’ sites such as under the collateral ligaments of the knee. US-guided aspiration of 12 nodules suspected to be tophi was performed; in 10 of these, MSU crystals were obtained, helping to confi rm validity. A larger group of 50 nodules was detected by imaging in 22 patients; of these nodules, 37 were detected by both MRI and US, 46 were detected by US, and 41 by MRI. Th us, presumably, some false positives and false negatives were present for each modality, but defi ning these presents a problem. Benson and colleagues [24] have suggested that the sonographic appearances of gouty tophi may vary according to developmental state, and these features could mimic those of rheumatoid nodules, which can also evolve over time. Th erefore, the
fi nding of a nodule on US, MRI, or CT, while suggestive of tophus in the right clinical setting, is not utterly diagnostic. Finding bone erosions may also have diagnostic relevance, and US has been shown to be more sensitive than plain XR for the detection of small erosions. In one study of 78 gouty fi rst metatarso pha lan-geal joints, 52 (67%) revealed US erosion compared with only 22 (28%) where XR erosions were scored [24]. Th is recalls similar fi ndings in RA, in which multiplanar imaging techniques, including US, MRI, and CT, have all been shown to be superior to two-dimensional XR for erosion detection [25]. However, the rate of US false positives is often diffi cult to determine from the pub-lished literature; in any case, the imaging appearance of erosive, infl ammatory arthropathy is common to many conditions, including RA and PsA as well as gout [15].
Th e prospect that key imaging features such as the
double-contour sign could confi rm a diagnosis of gout remains tantalizing. Lai and Chiu [26] recently published an ultrasound study of large joints (mainly knees and ankles) in 34 patients with gout and 46 patients with non-gouty arthritis and compared sonographic fi ndings with MSU crystal aspiration. Th e authors reported the double-contour sign to have a sensitivity of 36.8% and a speci-fi city of 97.3% for the diagnosis of gout. However, Carter and colleagues [27] were not able to fi nd US evidence of the double-contour sign in any of their ‘index joints’ where clinical gout attacks had occurred, and MRI erosions were present in more than half.
Computed tomography scanning
[image:4.612.67.548.89.289.2]Helical multislice CT scanning has a potential role in the diagnosis of gout, largely because of the very-high-resolution 3D images that may be obtained depicting
tophi [28] (Figure 2). Th ese tend to be higher-defi nition than MRI images as the slice thickness (which for CT can be as low as 0.5 mm) is considerably thinner than that of MRI (which is typically 2.5 to 4 mm) and there is no interslice gap (in fact, the slices can be reconstructed overlapping for 3D reformatting purposes). Th e density of tophi is usually 160 to 170 Hounsfi eld units and this is signifi cantly diff erent from that of soft tissues and bone [29]. Helical CT scanning also has the advantage of allow-ing imagallow-ing of larger regions than most MRI scans, so that the pattern of joint involvement can be depicted. In gout, this is typically asymmetrical, favoring the meta-tarso phalangeal, interphalangeal, and midtarsal joints in the feet and the proximal interphalangeal and distal inter phalangeal joints in the hands. Clearly, CT would have no role in the diagnosis of acute gout, prior to the development of bone erosions or tophi, as it does not provide imaging of synovitis, tenosynovitis, or osteitis.
Dual-energy computed tomography
Dual-energy computed tomography (DECT) has estab-lished roles in cardiology as a means to image calcifi ca tion within coronary artery plaques [30] and in renal medicine for the identifi cation of uric acid calculi [31]. However, it has also recently been investigated in tophaceous gout [32,33]. DECT scanning involves the use of two x-ray tubes positioned at 90 degrees to each other (that is, a dual-source scanner) and two corresponding detectors. Th is
allows images to be acquired simul taneously at two
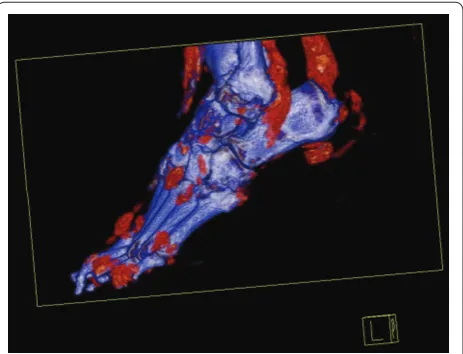
diff erent energy levels, providing two datasets. Th ese are analyzed by using a 3D material decom position algorithm that allows characterization of uric acid (allocated a specifi c color) to be contrasted with calcium and soft tissue (allocated other colors) [33] (Figure 5). Th is means that MSU crystals can be detected with a high degree of accuracy, implying that DECT should have very high specifi city for a diagnosis of gout. However, information regarding its sensitivity, especially in non-tophaceous gout, is prelimi nary. Choi and colleagues [32] des cribed DECT scanning in 20 tophaceous gout patients who were all revealed to have urate deposits in contrast to the control group, in whom no deposits were detected. DECT scans detected fourfold more deposits than did physical examination, indicating the potential of the former for imaging subclinical tophi. Nicolaou and colleagues [33] described the use of DECT in the successful diagnosis of tophaceous gout in fi ve separate cases in which patients presented with soft tissue masses or joint pain. Th is remains an emerging area of great interest.
3. Monitoring disease activity and damage – response to therapy
Plain XR provides a very blunt imaging instrument with which to try to track the progress of joint damage in gout
and its response to therapy. McCarthy and colleagues [34] studied a group of 39 patients for 10 years and found no correlation between XR changes and serum urate concentration, and this suggests that XR may not be suffi ciently sensitive to monitor change in bony damage over this time frame. More recently, a specifi c gout radiographic scoring method has been developed and vali dated and may improve sensitivity to change in longi-tudinal studies [2]. With the development of powerful and often costly urate-lowering therapies, the focus has shifted to the possibility that advanced imaging could be useful in this context, providing sensitivity to change over a shorter timeframe that would be clinically relevant. Of these modalities, MRI and CT have the facility to allow storage of standardized digital images and so are particularly suitable for use in longitudinal studies.
Perez-Ruiz and colleagues [23] examined the US measure ment of tophi in 25 patients with gout, including change in tophus size and its association with serum urate concentrations over the course of 12 months. Th e authors reported excellent intraobserver (intraclass corre la tion coeffi cient (ICC) of 0.98 for volume) and good interobserver reliability (ICCs of 0.83 for maximal
diameter and 0.71 for minimal diameter). Th ey also
provided data comparing US and MRI diameters of the same lesions. Interestingly, these measurements were similar but not identical, and the R2 value for the
[image:5.612.315.547.89.266.2]corre-lation was 0.65. Th is suggests that defi nition of the outer limit of the tophus may vary according to how it is imaged. MRI diameters in this study were generally larger than US diameters, and this could be related to better imaging (by MRI) of the soft tissue component of the
Figure 5. Dual-energy computed tomography scan of the foot of a Pacifi c islander man with longstanding gout. Scan reveals multiple tophaceous deposits adjacent to interphalangeal and tarsal joints as well as the calcaneal bursa, the soft tissues anterior to the ankle joint, and the peroneal tendon sheath.
McQueen et al. Arthritis Research & Therapy 2011, 13:246 http://arthritis-research.com/content/13/6/246
tophus, which may contain regions of infl ammation and hypervascularity. In 14 patients, urate-lowering therapy (with allopurinol and later benzbromarone in some) was commenced, and repeat US examination was performed at 12 months. When a reduction greater than the smallest detectable diff erence (SDD) was taken as indicating real change, 20 out of 38 tophi were reduced in maximal diameter at the endpoint. Th ese patients had a signifi -cantly lower average serum urate than the group in which tophus diameter did not change. To look at this another way, in patients with an average serum urate of less than 6 mg/dL, 19 out of 28 tophi (68%) showed reduction compared with 1 out of 10 tophi (10%) in patients with urate of greater than 6 mg/dL. Th e authors concluded that US fulfi lls the Outcome Measures in Rheumatoid Arthritis Clinical Trials (OMERACT) fi lter [35,36] as a feasible, valid, and discriminative measure for evaluating changes in tophus size in gout patients on urate-lowering therapy.
Schumacher and colleagues [37] performed a multi-center study assessing the intra- and inter-reader repro-ducibilities of tophus volume assessment using MRI scanning. Volume measurements were made in 17 tophi from 14 subjects. Th ese lesions ranged from very large at the elbow (mean volume of 14.1 cm3) to smaller lesions at the foot/ankle and hand/wrist (6.9 and 5.3 cm3, respec-tively). Reproducibility in this study was expressed as the absolute percentage diff erence between volume readings taken by one observer twice (intra-reader) or two observers (inter-reader). Oddly, intra-reader reproduci bility in this study was slightly worse (17.2% diff erence between
volume readings) than inter-reader reproduci bility
(14.2% diff erence between readers). Th ese diff er ences translated into small actual changes in volume (0.07 to 2.2 cm3). Th e authors felt that MRI scans without gadolinium contrast were optimal for assessing tophus volume as post-contrast scans were associated with artifact that complicated measurement. It is diffi cult to extrapolate from these fi ndings whether MRI scanning would be a suitable tool for assessment of change in tophus volume in the therapeutic setting, and further studies are required.
CT has been evaluated for assessment of tophus size by our own group [28]. Forty-seven hand tophi were analyzed from 20 patients with gout, and measurements were made with a 16-slice scanner with thin (0.8 mm) slices. Two observers separately determined tophus volume with the 3D software available. Reliability was very high between and within observers (ICCs of 0.989 and 1.0, respectively). Physical measurement of subcutaneous tophi was also included in this study and, interestingly, compared well with CT in terms of reliability. For tophi that were identifi ed by both physical measurement and CT (89%), there was good correlation between physical
measurement of the longest diameter and CT measure-ment of volume (r = 0.91), providing further validation of CT as a measurement instrument. Currently, there are no published studies evaluating change in CT tophus volume in patients on urate-lowering therapy.
Abufayyah and colleagues [38] recently reported a proof-of-concept study investigating the use of DECT in monitoring reduction of tophus volume in 12 patients on urate-lowering therapy. Scans were performed of four peripheral joint areas – elbows, wrists/hands, knees, and ankles/feet – at baseline and were repeated 11 to 29 months later. Ten patients improved on urate-lowering therapy, with a reduction in serum urate levels and lower frequency of gout attacks. Tophus volume was reduced in all of these responders; the median reduction was 64%
(from 322 to 107 cm3). By contrast, the two
non-responders showed a 36% increase in total tophus volume. Th e authors concluded that DECT scanning had potential as a sensitive, quantitative imaging tool for assessing tophus (and therefore urate) volume changes in patients with tophaceous gout.
Using advanced imaging to monitor responses to therapy in arthritic conditions has led to the development of measuring instruments by OMERACT-led inter national working parties in RA and PsA [4,39]. Th e MRI scoring systems - Rheumatoid Arthritis MRI Score (RAMRIS) and Psoriatic Arthritis MRI Score (PsAMRIS) - are now in use in clinical trials and similar systems are being evolved for studies in US [40]. Th e utility of these instruments lies in their ability to reproducibly measure joint infl ammation and damage, incorporating charac-teristic pathological features including bone erosion, bone oedema and synovitis for RA, with additions now available for scoring tenosynovitis and cartilage [41,42]. For PsA, additional features such as bone proliferation and peri articular infl ammation have been included in PsAMRIS to capture relevant pathology [39]. Clearly, measuring tophus volume alone in gout is incomplete as successful therapy also needs to be associated with a reduction in chronic synovitis (or acute fl ares) and slowing the progression of bone erosion. Th us, an all-inclusive measurement tool is needed for compre hensive assessment of gouty arthropathy and perhaps a Gouty Arthritis MRI Score or “GAMRIS” is called for. Alternatively an US or CT score could be devised for gout, keeping in mind that the diff erent modalities have diff erent strengths and weaknesses. For example, MRI
has the advantage of revealing all compo nents
In summary, advanced imaging techniques are currently poised to fulfi ll their potential in gout. Th is review has summarized the great advances that have already occurred in terms of revealing pathological features in this condition. Th e 3D rendering of tophi is allowing computation of volume from CT and MRI, and the development of DECT means that tophaceous deposits can now be recognized not just by their morphology and tissue density characteristics but by their chemical compo sition. US allows a ‘hands on’ approach for the practicing clinician to assess tophi, erosions, and syno-vitis and may be particularly applicable in the longitudinal setting. It can also be used to guide aspiration of the joint or tophus to obtain material for crystal examination. Advances are being made in defi ning the reproducibility of imaging measurements, and ultimately the goal will be for the practicing clinician to employ these tools in the assessment of the activity and severity of gout and to determine clinically meaningful responses to therapy.
Abbreviations
3D, three-dimensional; CT, computed tomography; DECT, dual-energy computed tomography; ICC, intraclass correlation coeffi cient; MRI, magnetic resonance imaging; MSU, monosodium urate; OMERACT, Outcome Measures in Rheumatoid Arthritis Clinical Trials; PsA, psoriatic arthritis; PsAMRIS, Psoriatic Arthritis Magnetic Resonance Imaging Score; RA, rheumatoid arthritis; T2w, T2-weighted; US, ultrasonography; XR, radiography.
Competing interests
The authors declare that they have no competing interests.
Author details
1Department of Molecular Medicine and Pathology, Faculty of Medicine and Health Sciences, University of Auckland, 85 Park Road, Grafton, Auckland 1023, New Zealand. 2Department of Radiology, Auckland City Hospital, Auckland District Health Board, Grafton Road, Auckland 1023, New Zealand. 3Department of Medicine, Faculty of Medicine and Health Sciences, University of Auckland, 85 Park Road, Grafton, Auckland 1023, New Zealand.
Published: 4 November 2011
References
1. Barthelemy CR, Nakayama DA, Carrera GF, Lightfoot RW Jr., Wortmann RL:
Gouty arthritis: a prospective radiographic evaluation of sixty patients. Skeletal Radiol 1984, 11:1-8.
2. Dalbeth N, Clark B, McQueen F, Doyle A, Taylor W: Validation of a radiographic damage index in chronic gout.Arthritis Rheum 2007,
57:1067-1073.
3. Dalbeth N, McQueen FM: Use of imaging to evaluate gout and other crystal deposition disorders.Curr Opin Rheumatol 2009, 21:124-131.
4. Østergaard M, Peterfy C, Conaghan P, McQueen F, Bird P, Ejbjerg B, Shnier R, O’Connor P, Klarlund M, Emery P, Genant H, Lassere M, Edmonds J: OMERACT Rheumatoid Arthritis Magnetic Resonance Imaging Studies. Core set of MRI acquisitions, joint pathology defi nitions, and the OMERACT RA-MRI scoring system.J Rheumatol 2003, 30:1385-1386.
5. McQueen F, Lassere M, Duer-Jensen A, Wiell C, Conaghan PG, Gandjbakhch F, Hermann KG, Bird P, Bøyesen P, Peterfy C, Ejbjerg B, Haavardsholm EA, Coates L, Ostergaard M: Testing an OMERACT MRI scoring system for peripheral psoriatic arthritis in cross-sectional and longitudinal settings.J Rheumatol
2009, 36:1811-1815.
6. Dalbeth N, Schauer C, Macdonald P, Perez-Ruiz F, Schumacher HR, Hamburger S, Choi HK, McQueen FM, Doyle A, Taylor WJ: Methods of tophus assessment in clinical trials of chronic gout: a systematic literature review and pictorial reference guide.Ann Rheum Dis 2011, 70:597-604.
7. Resnick D: Crystal-induced arthropathy. Gout and pseudogout.JAMA 1979,
242:2440-2442.
8. Guerra J, Resnick D: Arthritides aff ecting the foot: radiographic–patho-logical correlation.Foot Ankle 1982, 2:325-331.
9. Yu JS, Chung C, Recht M, Dailiana T, Jurdi R: MR imaging of tophaceous gout.AJR Am J Roentgenol 1997, 168:523-527.
10. Gentili A: The advanced imaging of gouty tophi.Curr Rheumatol Rep 2006,
8:231-235.
11. Palmer DG, Hogg N, Denholm I, Allen CA, Highton J, Hessian PA: Comparison of phenotype expression by mononuclear phagocytes within
subcutaneous gouty tophi and rheumatoid nodules.Rheumatol Int 1987,
7:187-193.
12. Dalbeth N, Pool B, Gamble GD, Smith T, Callon KE, McQueen FM, Cornish J:
Cellular characterization of the gouty tophus: a quantitative analysis. Arthritis Rheum 2010, 62:1549-1556.
13. Dalbeth N, Smith T, Nicolson B, Clark B, Callon K, Naot D, Haskard DO, McQueen FM, Reid IR, Cornish J: Enhanced osteoclastogenesis in patients with tophaceous gout: urate crystals promote osteoclast development through interactions with stromal cells.Arthritis Rheum 2008, 58:1854-1865. 14. Popp JD, Bidgood WD Jr., Edwards NL: Magnetic resonance imaging of
tophaceous gout in the hands and wrists. Semin Arthritis Rheum 1996,
25:282-289.
15. Schueller-Weidekamm C, Schueller G, Aringer M, Weber M, Kainberger F:
Impact of sonography in gouty arthritis: comparison with conventional radiography, clinical examination, and laboratory fi ndings.Eur J Radiol
2007, 62:437-443.
16. de Ávila Fernandes E, Kubota ES, Sandim GB, Mitraud SA, Ferrari AJ, Fernandes AR: Ultrasound features of tophi in chronic tophaceous gout.Skeletal Radiol
2011, 40:309-315.
17. Thiele RG, Schlesinger N: Diagnosis of gout by ultrasound.Rheumatology
2007, 46:1116-1121.
18. Peterfy CG: MRI of the wrist in early rheumatoid arthritis.Ann Rheum Dis
2004, 63:473-477.
19. Poh YJ, Dalbeth N, Doyle A, McQueen FM: Magnetic resonance imaging bone edema is not a major feature of gout unless there is concomitant osteomyelitis: 10-year fi ndings from a high-prevalence population. J Rheumatol 2011 Oct 1. [Epub ahead of print].
20. Zhang W, Doherty M, Pascual E, Bardin T, Barskova V, Conaghan P, Gerster J, Jacobs J, Leeb B, Lioté F, McCarthy G, Netter P, Nuki G, Perez-Ruiz F, Pignone A, Pimentão J, Punzi L, Roddy E, Uhlig T, Zimmermann-Gòrska I; EULAR Standing Committee for International Clinical Studies Including Therapeutics: EULAR evidence based recommendations for gout. Part I: Diagnosis. Report of a task force of the Standing Committee for International Clinical Studies Including Therapeutics (ESCISIT).Ann Rheum Dis 2006, 65:1301-1311. 21. Nygaard HB, Shenoi S, Shukla S: Lower back pain caused by tophaceous
gout of the spine. Neurology 2009, 73:404.
22. Gardner H, McQueen F: Tophaceous gout of the pubic symphysis: an unusual cause of groin pain.Ann Rheum Dis 2004, 63:767-768. 23. Perez-Ruiz F, Martin I, Canteli B: Ultrasonographic measurement of tophi as
an outcome measure for chronic gout.J Rheumatol 2007, 34:1888-1893. 24. Benson CH, Gibson JY, Harisdangkul V: Ultrasound diagnosis of tophaceous
and rheumatoid nodules. Arthritis Rheum 1983, 26:696.
25. Østergaard M, Ejbjerg B, Szkudlarek M: Imaging in early rheumatoid arthritis: roles of magnetic resonance imaging, ultrasonography, conventional radiography and computed tomography. Best Pract Res Clin Rheumatol 2005, 19:91-116.
26. Lai K, Chiu Y: Role of ultrasonography in diagnosing gouty arthritis.Journal of Medical Ultrasound 2011, 19:7-13.
27. Carter JD, Kedar RP, Anderson SR, Osorio AH, Albritton NL, Gnanashanmugam S, Valeriano J, Vasey FB, Ricca LR: An analysis of MRI and ultrasound imaging in patients with gout who have normal plain radiographs.Rheumatology
2009, 48:1442-1446.
28. Dalbeth N, Clark B, Gregory K, Gamble GD, Doyle A, McQueen FM: Computed tomography measurement of tophus volume: comparison with physical measurement.Arthritis Rheum 2007, 57:461-465.
29. Gerster JC, Landry M, Dufresne L, Meuwly JY: Imaging of tophaceous gout: computed tomography provides specifi c images compared with
This article is part of the series Advances in the imaging of rheumatic
diseases, edited by Mikkel Østergaard. Other articles in this series can
be found at http://arthritis-research.com/series/imaging McQueen et al. Arthritis Research & Therapy 2011, 13:246 http://arthritis-research.com/content/13/6/246
magnetic resonance imaging and ultrasonography.Ann Rheum Dis 2002,
61:52-54.
30. Reimann AJ, Rinck D, Birinci-Aydogan A, Scheuering M, Burgstahler C, Schroeder S, Brodoefel H, Tsifl ikas I, Herberts T, Flohr T, Claussen CD, Kopp AF, Heuschmid M: Dual-source computed tomography: advances of improved temporal resolution in coronary plaque imaging.Invest Radiol 2007,
42:196-203.
31. Graser A, Johnson TR, Bader M, Staehler M, Haseke N, Nikolaou K, Reiser MF, Stief CG, Becker CR: Dual energy CT characterization of urinary calculi: initial in vitro and clinical experience.Invest Radiol 2008, 43:112-119. 32. Choi HK, Al-Arfaj AM, Eftekhari A, Munk PL, Shojania K, Reid G, Nicolaou S:
Dual energy computed tomography in tophaceous gout.Ann Rheum Dis
2009, 68:1609-1612.
33. Nicolaou S, Yong-Hing CJ, Galea-Soler S, Hou DJ, Louis L, Munk P:
Dual-energy CT as a potential new diagnostic tool in the management of gout in the acute setting.AJR Am J Roentgenol 2010, 194:1072-1078. 34. McCarthy GM, Barthelemy CR, Veum JA, Wortmann RL: Infl uence of
antihyperuricemic therapy on the clinical and radiographic progression of gout.Arthritis Rheum 1991, 34:1489-1494.
35. Boers M, Brooks P, Strand CV, Tugwell P: The OMERACT fi lter for outcome measures in rheumatology.J Rheumatol 1998, 25:198-199.
36. Schumacher HR, Taylor W, Edwards L, Grainger R, Schlesinger N, Dalbeth N, Sivera F, Singh J, Evans R, Waltrip RW, Diaz-Torne C, MacDonald P, McQueen F, Perez-Ruiz F: Outcome domains for studies of acute and chronic gout. J Rheumatol 2009, 36:2342-2345.
37. Schumacher HR Jr., Becker MA, Edwards NL, Palmer WE, MacDonald PA, Palo W, Joseph-Ridge N: Magnetic resonance imaging in the quantitative assessment of gouty tophi.Int J Clin Pract 2006, 60:408-414.
38. Abufayyah M, Nicolaou S, Eftekhari A, Reid G, Shojania K, Co S, Choi HK:
Quantitative documentation of tophus volume change using dual energy computed tomography scans.Arthritis Rheum 2010, 62:S900-S901. 39. Ostergaard M, McQueen F, Wiell C, Bird P, Bøyesen P, Ejbjerg B, Peterfy C,
Gandjbakhch F, Duer-Jensen A, Coates L, Haavardsholm EA, Hermann KG, Lassere M, O’Connor P, Emery P, Genant H, Conaghan PG: The OMERACT psoriatic arthritis magnetic resonance imaging scoring system (PsAMRIS): defi nitions of key pathologies, suggested MRI sequences, and preliminary scoring system for PsA Hands.J Rheumatol 2009, 36:1816-1824.
40. D’Agostino MA, Conaghan PG, Naredo E, Aegerter P, Iagnocco A, Freeston JE, Filippucci E, Moller I, Pineda C, Joshua F, Backhaus M, Keen HI, Kaeley G, Ziswiler HR, Schmidt WA, Balint PV, Bruyn GA, Jousse-Joulin S, Kane D, Moller I, Szkudlarek M, Terslev L, Wakefi eld RJ: The OMERACT ultrasound task force -- Advances and priorities.J Rheumatol 2009, 36:1829-1832.
41. Haavardsholm EA, Østergaard M, Ejbjerg BJ, Kvan NP, Kvien TK: Introduction of a novel magnetic resonance imaging tenosynovitis score for rheumatoid arthritis: reliability in a multireader longitudinal study.Ann Rheum Dis 2007, 66:1216-1220.
42. McQueen F, Clarke A, McHaffi e A, Reeves Q, Williams M, Robinson E, Dong J, Chand A, Mulders D, Dalbeth N: Assessment of cartilage loss at the wrist in rheumatoid arthritis using a new MRI scoring system.Ann Rheum Dis 2010,
69:1971-1975.
doi:10.1186/ar3489