BIROn - Birkbeck Institutional Research Online
Bulgarelli, Chiara and Blasi, Anna and Arridge, Simon and Powell, S. and
de Klerk, Carina C.J.M. and Southgate, Victoria and Brigadoi, S. and Penny,
W. and Tak, S. and Hamilton, A. (2018) Dynamic causal modelling on infant
fNIRS data: A validation study on a simultaneously recorded fNIRS-fMRI
dataset. NeuroImage 175 , pp. 413-424. ISSN 1053-8119.
Downloaded from:
Usage Guidelines:
Please refer to usage guidelines at
or alternatively
Dynamic causal modelling on infant fNIRS data: A validation study on a
simultaneously recorded fNIRS-fMRI dataset
Chiara Bulgarelli
a,*, Anna Blasi
a, Simon Arridge
b, Samuel Powell
c, Carina C.J.M. de Klerk
a,
Victoria Southgate
d, Sabrina Brigadoi
e, William Penny
f, Sungho Tak
g, Antonia Hamilton
h aCentre for Brain and Cognitive Development, Birkbeck College, University of London, United KingdombCentre for Medical Image Computing, University College London, United Kingdom
cDepartment of Medical Physics and Biomedical Engineering, University College London, United Kingdom dDepartment of Psychology, University of Copenhagen, Denmark
eDepartment of Developmental Psychology, University of Padova, Italy fSchool of Psychology, University of East Anglia, Norwich, United Kingdom g
Bioimaging Research Team, Korea Basic Science Institute, South Korea
hInstitute of Cognitive Neuroscience, University College London, United Kingdom
A R T I C L E I N F O
Keywords:
Effective connectivity DCM
Infants
Simultaneous fMRI-fNIRS recording
A B S T R A C T
Tracking the connectivity of the developing brain from infancy through childhood is an area of increasing research interest, and fNIRS provides an ideal method for studying the infant brain as it is compact, safe and robust to motion. However, data analysis methods for fNIRS are still underdeveloped compared to those available for fMRI. Dynamic causal modelling (DCM) is an advanced connectivity technique developed for fMRI data, that aims to estimate the coupling between brain regions and how this might be modulated by changes in experi-mental conditions. DCM has recently been applied to adult fNIRS, but not to infants. The present paper provides a proof-of-principle for the application of this method to infant fNIRS data and a demonstration of the robustness of this method using a simultaneously recorded fMRI-fNIRS single case study, thereby allowing the use of this technique in future infant studies.
fMRI and fNIRS were simultaneously recorded from a 6-month-old sleeping infant, who was presented with auditory stimuli in a block design. Both fMRI and fNIRS data were preprocessed using SPM, and analysed using a general linear model approach. The main challenges that adapting DCM for fNIRS infant data posed included: (i) the import of the structural image of the participant for spatial pre-processing, (ii) the spatial registration of the optodes on the structural image of the infant, (iii) calculation of an accurate 3-layer segmentation of the structural image, (iv) creation of a high-density mesh as well as (v) the estimation of the NIRS optical sensitivity functions. To assess our results, we compared the values obtained for variational Free Energy (F), Bayesian Model Selection (BMS) and Bayesian Model Average (BMA) with the same set of possible models applied to both the fMRI and fNIRS datasets. We found high correspondence in F, BMS, and BMA between fMRI and fNIRS data, therefore showing for thefirst time high reliability of DCM applied to infant fNIRS data. This work opens new avenues for future research on effective connectivity in infancy by contributing a data analysis pipeline and guidance for applying DCM to infant fNIRS data.
Introduction
The importance of understanding functional and structural brain connectivity across human development is increasingly being recog-nized. Whereas the first decades of neuroimaging research examined
questions offunctional segregationand specialisation of brain areas, recent research has begun focusing on understandingfunctional integrationand networks in the brain. This approach takes into account how the func-tional role of each area is largely defined by its connections, and how cognitive functions are usually supported by complex networks and
* Corresponding author. Centre for Brain and Cognitive Development, Department of Psychological Sciences Birkbeck, University of London, Malet Street, London, WC1E 7HX, UK.
E-mail address:[email protected](C. Bulgarelli).
Contents lists available atScienceDirect
NeuroImage
journal homepage:www.elsevier.com/locate/neuroimage
https://doi.org/10.1016/j.neuroimage.2018.04.022
Received 6 January 2018; Received in revised form 19 March 2018; Accepted 9 April 2018 Available online 12 April 2018
interactions between brain areas (Friston, 1994). Connectivity studies have enriched neuroimaging research with a more comprehensive un-derstanding of how the brain works and develops, playing a fundamental role in revealing neuronal mechanisms behind cognitive processes and psychological domains (Friston, 2011;He and Evans, 2010;Rubinov and Sporns, 2010). The aim of the present paper is to advance our methods for studying connectivity in the infant brain, and develop the use of dynamic causal modelling (DCM) for infant fNIRS data.
Previous studies have used a range of methods to explore connectivity in adults, children and infants. Some researchers have used EEG in awake infants (for some examples seeGrieve et al., 2008;Meijer et al., 2016;
Orekhova et al., 2014;Righi et al., 2014;Toth et al., 2017), while most of the studies using fMRI have focused on resting-state connectivity in sleeping infants (Damaraju et al., 2014;Emberson et al., 2015;Fransson et al., 2011;Gao et al., 2016;Kwon et al., 2016;Lin et al., 2008;Lu et al., 2010;Marrus et al., 2017). Although these studies have started to shed light on how connectivity develops over thefirst years of life, there still is a lot unknown about how different brain areas are functionally related to each other, considering that the brain is constantly changing, maturing over thefirst years of life (Johnson, 2001;Knickmeyer et al., 2008).
One challenge to the fMRI studies is that connectivity measured during sleep does not display the same patterns of co-activation as in wakefulness, suggesting that sleep stages affect functional networks differently (Tagliazucchi and Laufs, 2014). Moreover, fMRI is very sen-sitive to movement (Friston et al., 1996). Therefore, head motion is a big limitation for connectivity studies on the developing brain, considering that even very small movements (smaller than 1 mm), that typically occur during natural sleep, will affect functional connectivity estimation. In particular, head movements decrease long-range connectivity and increase short-range connectivity (Deen and Pelphrey, 2012; Power et al., 2012;van Dijk et al., 2012). This means that acquiring usable connectivity data from awake infants and toddlers in the MRI scanner is exceptionally difficult, limiting the range of stimuli and conditions usable with young participants. Therefore, this paper is aimed to validate the use of an advance connectivity technique to allow in the future this method to be used in awake infants.
Recently, functional near-infrared spectroscopy (fNIRS) has emerged as a non-invasive and reliable neuroimaging method, widely used in the developmentalfield (Ferrari and Quaresima, 2012). In order to detect a hemodynamic response, near-infrared light is projected through the scalp. Skin, bone and human tissues are relatively transparent to light in the near-infrared band of the electromagnetic spectrum, while oxygen-ated (oxy-Hb) and deoxygenoxygen-ated blood (deoxy-Hb) components present different proprieties of absorption spectra in the near-infrared wave-length region. Differences in the absorption of the oxy-Hb and deoxy-Hb allow us to measure the difference in the haemoglobin concentration. When neurons are activated as a result of functional processing, a localised change in tissue oxygenation occurs in that region. This pro-duces a change in the amount of light absorbed by this tissue and which can be measured by near infrared spectroscopy systems. These mea-surements are used as surrogates of brain activation (Elwell, 1995;Hoshi, 2016).
There are specific characteristics of fNIRS that make it an ideal neu-roimaging technique for exploring the developing human brain (Lloyd-Fox et al., 2010;Wilcox and Biondi, 2015). Firstly, infants have a thinner scalp and less hair compared to adults (aspects that could affect the absorption and the scattering of the light), allowing the near-infrared light to more effectively reach the grey matter. Secondly, the robustness of fNIRS to motion–compared with fMRI - allows us to test infants and toddlers while they are awake and relatively free to move, and so to explore how brain areas differentially respond to cognitive and social tasks. This widens the scope and range of experimental conditions for conducting studies (Holtzer et al., 2011;Solovey et al., 2009). Thirdly, fNIRS is not restricted to a lying down posture, and so is more participant friendly, as infants can sit on or close to their carer throughout the study. Lastly, the portability and the low cost of this equipment has helped
increase the use of fNIRS for neuroimaging over the last decade (Hoshi, 2007;Piper et al., 2014). Thanks to these properties, fNIRS use is not only restricted to infants and toddlers, but can also be used in populations with physical or health conditions that may prevent them from being tested in the MRI scanner (Kumar et al., 2017;Leff et al., 2011;Lin et al., 2013;Maidan et al., 2016). Furthermore, the possibility of using fNIRS in more realistic environments including natural movement has facilitated its application in thefield of social interaction (Canning and Scheutz, 2013;Holtzer et al., 2011;Pan et al., 2017;Pinti et al., 2015).
Compared to fMRI, fNIRS presents a higher temporal resolution, allowing for rapid data acquisition up to 100 Hz–compared to 1 Hz or less usually provided by fMRI (Kim et al., 1997;Huettel et al., 2004;
Weishaupt et al., 2007). This enables fNIRS to provide more time-accurate recordings of the hemodynamicfluctuations of the brain, therefore contributing higher resolution information to studies using connectivity analyses, and those examining the correlations between the time-series and relations between brain areas (Lee et al., 2013).
noise, but also from external perturbations. Moreover, this advanced method takes into account two different options in which experimental conditions can enter the model; either through direct influences on specific anatomical brain areas, or through a modulation of the coupling among brain areas, so on the functional connections between regions (Friston et al., 2003). Typically, researchers build a family of models with slightly different connections or experimental contexts, and use Bayesian statistic to determine which model gives the closest description of the data (inference on model space) and to estimate the strength and the nature of the connections, excitatory or inhibitory (inference on parameter space) (Penny et al., 2004). From this comparison with other connectivity techniques usually used in neuroimaging research, it is appreciably un-derstandable why DCM is so ground-breaking and innovative.
DCM has been developed and widely applied in the context of fMRI (Friston et al., 2011;Schuyler et al., 2010), and it has been adapted for fNIRS on adults (Tak et al., 2015). The aim of the current project was to determine if DCM can be used on infant data as well. In order to validate the use of DCM on infant data, fMRI and fNIRS were simultaneously recorded from a 6-month-old sleeping infant, who was presented with auditory stimuli in a block design. MRI scans of the participant structural images were acquired as well. The application of DCM on infant fNIRS data required several technical challenges to be solved. Firstly, we needed to import the participant structural image in the SPM-NIRS toolbox in order to get a precise spatial registration of the fNIRS opto-des on the infant's brain. In order to correctly estimate the light path throughout the brain layers, we then evaluated the NIRS optical sensi-tivity functions on a high-density mesh based on the segmented struc-tural image of the participant. Finally, the specification of DCM models had to be adapted for infant brain features.
This paper aims to provide solutions to the problems encountered when applying DCM to infant data, and therefore test if this analysis tool, initially developed for adult fNIRS only, can also be applied in the developmental context. The simultaneous fMRI-fNIRS recording allows the validation of this advanced connectivity technique, favouring its application to other fNIRS datasets, obviating the need for MRI. We hope that this project will provide a step toward better studies of functional connectivity with fNIRS, opening doors to new lines of research.
Material and methods
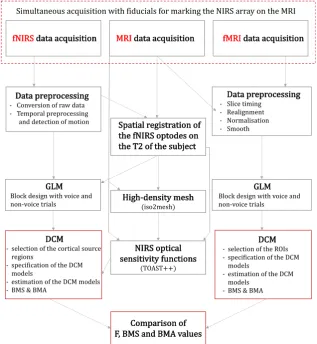
Fig. 1displays the outline of the analysis conducted in this study for fNIRS, MRI and fMRI.
Data acquisition
fMRI and fNIRS data were simultaneously acquired from a single participant (183 days-old) during natural sleep. The infant listened to vocal (e.g. coughing) and environmental (non-vocal) sounds (e.g. running water) interleaved with silence in a protocol previously tested with fNIRS and fMRI separately (Blasi et al., 2011,2015;Lloyd-Fox et al., 2012a). The stimuli were organized in a block design, with a presentation time of 9 s and a rest period of at least 13 s between conditions. The recording session lasted 11.5 min, and we acquired 24 trials in total, 12 for the voices condition (V) and 12 for the non-voices condition (NV).
fMRI
[image:4.595.139.457.380.725.2]MRI data were acquired using a GE 1.5 T Twinspeed MRI scanner (General Electric, Milwaukee, WI, USA). 320 T2* weighted gradient echo
planar multi-slice datasets depicting BOLD (Blood Oxygenation Level Dependent) contrast were acquired in each of 24 non-contiguous near-axial planes (4.0 mm thick with 1.0 mm spacing, 3.53.5 mm in-plane resolution) parallel to the Anterior Commissure-Posterior Commissure line (TE 57 ms, TR 3000 ms,flip angle 90, 16:04 min). At the same session, a T2 weighted fast spin echo (FSE) dataset was acquired (256168 rectangular matrix, 2 mm slice thickness, 0 mm slice gap,
field of view¼18 cm, TR¼4500, TE¼113 ms, echo train length¼17). Data quality assurance was carried out to ensure high signal to ghost ratio, high signal to noise ratio and excellent temporal stability using an automated quality control procedure. (Simmons et al., 1999). The body coil was used for RF transmission and an 8-channel head coil for RF reception (Simmons et al., 1999). The whole scanning procedure was stopped immediately if the infant awoke and/or expressed discomfort. An experimenter and the parent stood in the scanner room to observe the infant's behaviour at all times.
fNIRS
The fNIRS array (UCL Optical Imaging System (Everdell et al., 2005)) was placed over the right temporal lobe, and included 9 source-detector pairs (channels), defined by 4 sources and 4 detectors, with a 2 cm source-detector separation. The sources in the NIRS system provided light at 770 nm and 850 nm, and the sampling rate of acquisition was 10 Hz. MRI fiducial markers (vitamin E caplets) were attached to the inter-optode spaces of the NIRS array to guide the co-registration of the
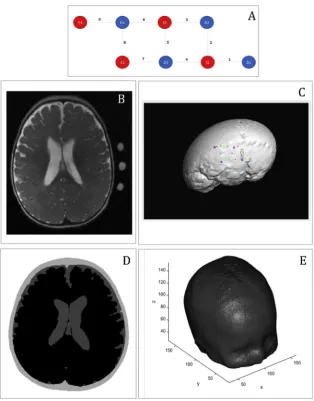
NIRS data onto the MRI image.Fig. 2A shows a design of the array. Our brain activations and connectivity analyses were restricted to the right hemisphere, because the fNIRS array was placed over the right hemisphere only, in order to optimise the number of sources and de-tectors available from the system, the difficulty of fitting the NIRS headgear within the restricted space in the MRI coil, and also considering the wide literature that suggests the main role of the right hemisphere in social auditory processing (Belin et al., 2000;Blasi et al., 2011; Gross-mann et al., 2010;Lloyd-Fox et al., 2012a).
Data pre-processing
fMRI
All fMRI images were analysed using Statistical Parametric Mapping software (SPM12) (Friston and Ashburner, 1994). Scans were corrected for slice timing and realigned for head movements. Images were then normalized to the T2 image of the participant, and smoothed using a 7-mm full-width at half-maximum isotropic Gaussian kernel.
fNIRS
[image:5.595.38.353.332.734.2]The fNIRS data were analysed using the SPM-fNIRS toolbox, a SPM12 based software for statistical analysis of fNIRS signal (Tak et al., 2016;Ye et al., 2009). The raw intensity data were converted to haemoglobin changes using the modified Beer-Lambert Law (differential path length factor, DPF¼5.13 (Duncan et al., 1995)). The spatial pre-processing
Fig. 2.Representation of the main methodological steps. A, Representation of the array. Sources are marked in red, de-tectors are marked in blue. Channels are marked with grey dotted lines and the channel number is indicated. B, T2 structural image of the participant withfiducials for the fNIRS channels. C, Output from the NIRS-SPM toolbox, spatial registration of the optodes over the T2 of the infant imported with the NFRI toolbox. Green‘x’are the sources, blue‘o’are the detectors and channels are labelled with red numbers. D, 3-layers segmentation from the T2 structural image of the in-fant. E, High-density volumetric tetrahedral mesh created with
registering the fNIRS channels over the native space of the participant was performed (see specific paragraph below). The temporal pre-processing included the removal of physiological noise (5th order Butterworth high-pass filter: 0.008 Hz; band-stop filter: 0.06-0.16 – 0.8-1.8 Hz), and the reduction of motion artefacts with spline interpo-lation. Artefacts were detected as changes in moving standard deviation larger than 3μM using a 1 s sliding window (Scholkmann et al., 2010). Our analysis of fNIRS data is based on changes in oxy-Hb, following the only study to date that has applied DCM to fNIRS data (Tak et al., 2015). Additionally, previous fNIRS studies with infants typically do notfind any statistically significant deoxy-Hb changes (for some examples see:
Grossmann et al., 2013;Lloyd-Fox et al., 2010;Lloyd-Fox et al., 2015;
Southgate et al., 2014).
Spatial registration. A precise estimation of optode positions and refer-ence points is crucial for calculating connectivity, therefore, particular attention needs to be dedicated to the fNIRS spatial registration to the MRI images. Location of the reference points and of the optode positions are required as an input of the fNIRS spatial processing to calculate the brain area covered by the NIRS channels. One option would be to use readily available adult MRI templates. However, this is not an ideal so-lution as the infant brain is not a reduced-size version of an adult brain (Sanchez et al., 2012b). Instead, we used the participant's own structural image for spatial co-registration of the NIRS data.
Optode positions on the head were manually estimated from the
fiducial markers on the T2 structural image of the participant. In particular, we defined projection points from eachfiducial onto the scalp as the location of each NIRS channel (Fig. 2B). We estimated the centre of the fiducial as the middle point between each source and detector, therefore they mark the centre of the channel. From here, we calculated the exact coordinates of each optodes on the infant's head.
The structural image of the infant was imported in the SPM-fNIRS toolbox, using custom modified code from the NFRI toolbox (Okamoto et al., 2004). On this structural image, the reference points and the optodes were plotted (seeFig. 2C).
Segmentation and creation of the mesh
Two structural scans were recorded from the participant: one immediately before and another one immediately after functional data collection. Superimposition of both images revealed that the infant had barely moved between the two time points, therefore the two images were averaged and upsampled to improve their quality (Manjn et al., 2010). After that, the image wasflattened to remove intensity level in-homogeneities caused by the magneticfield, and then, using in house scripts written in Matlab, its background was removed. The structural scan was skull stripped with FSL (http://fsl.fmrib.ox.ac.uk/fsl/fslwiki/ FSL) using the BET (Brain Extraction Tool) routine including the func-tions BET2 (to isolate the brain) and BETSURF (to separate the scalp and inner skull surfaces) (Jenkinson et al., 2012). The brain image was then further processed with SPM's SEGMENT option, using tissue probability maps from an age appropriate segmented template (from the Neuro-developmental MRI Database, of the Univ. of South Carolina http:// jerlab.psych.sc.edu/NeurodevelopmentalMRIDatabase/), very light bias regularisation (0.0001), and FWHM Gaussian smoothness of bias with 30 mm cut-off. At the end of this process, each infant's structural scan was segmented in 3 layers: skin and skull and extra-cerebral tissue, CSF, and brain (grey plus white matter). Using another set of Matlab scripts, the 3 layers were post-processed tofill in gaps and ensure that all voxels were assigned the correct labels. As explained in the previous section, the segmented images were then used to provide the necessary anatomical information to the fNIRS data reconstruction step (seeFig. 2D).
From the 3-layers segmentation image, a high-density volumetric tetrahedral mesh was created usingiso2meshtoolbox (Fang and Boas, 2009) (seeFig. 2E). Using in-house custom code, the optodes coordinates
were converted from the MRI structural image context to mesh-based context. (For the estimation of the optode positions, the reader is referred back to the section onSpatial registrationparagraph). The optode locations on the mesh and the mesh itself created from the structural scan were used as inputs for the estimation of the NIRS optical sensitivity functions.
NIRS optical sensitivity functions
Application of the DCM technique requires estimates of the sensitivity of the optical measurements at different wavelengths to changes in the chromophore concentrations of interest. In the context of diffuse optical imaging, these sensitivity functions are referred to as photon measure-ment density functions (Arridge and Schweiger, 1995;Arridge, 1995). The requisite sensitivity functions are calculated from products of the forwardfield generated by a given optical source, and the adjointfield generated by placing an equivalent optical source at the location of a detector. To compute the forward and adjointfields the diffusion equa-tion was employed with a Robin boundary condiequa-tion
ðr⋅κr þμaÞϕðrÞ ¼0 ðr2ΩÞ;
ϕðrÞ þ2Aκn⋅rϕðrÞ ¼q ðr2∂ΩÞ;
where ‘r’ is a point in space, Ω is the computational domain with boundary ∂Ω;ϕ is the fluence rate resulting from application of the physical or adjoint source q,κ¼ ð3ðμaþμsÞÞ1is the diffusion coeffi -cient,μaandμsare the wavelength dependent baseline absorption and scattering coefficients, A is a term accounting for the index of refraction mismatch at the boundary, and n is the outward normal to the boundary (S RArridge et al., 1993).
The TOASTþþtoolbox was used to solve the diffusion approximation numerically via the Finite Element Method (Schweiger and Arridge, 2014). In each case the properties of the source and detector were specified according to physical measurements, and the wavelength dependent baseline absorption and scattering coefficients were derived from a previous study performed on neonates (Singh et al., 2014).
General linear model for fMRI and fNIRS
For both fMRI and fNIRS data, the evoked hemodynamic responses were modelled as a delta function convolved with a hemodynamic response and its spatial and temporal derivatives within the context of the General Linear Model (GLM). Onsets of voice (V) and non-voice (NV) trials were specified in seconds.
Selection of ROIs/cortical source regions and definition of the DCM models
In order to estimate effective connectivity with DCM, we selected a priori volumes of interest in inferior frontal gyrus (IFG), superior tem-poral sulcus (STS) and temporo-parietal junction (TPJ). The selection of the fMRI ROIs was based on maximum activation peaks showed from GLMs and considering previous literature on auditory processing (Belin et al., 2000;Blasi et al., 2011;Grossmann et al., 2010;Lloyd-Fox et al., 2012a,b). The fNIRS cortical source regions were defined based on pre-vious coregistration works (Lloyd-Fox et al., 2014), considering the co-ordinates of the closest channel to the region of interest (fNIRS source regions need to be specified on the participant's cortical surface). Both in the fMRI and in the fNIRS contexts, we extracted principal eigenvariates in 4 mm spheres centred in ROIs/cortical source regions. See the specific coordinates for both fMRI and fNIRS inFig. 3.
neuronal population, (ii) a set ofmodulatory connections(B) that indicate which intrinsic connections are dependent on experimental manipula-tions, (iii)driving inputs(C), considered as direct influences of the stimuli on the neural activity of involved regions of input connections (Friston et al., 2003).
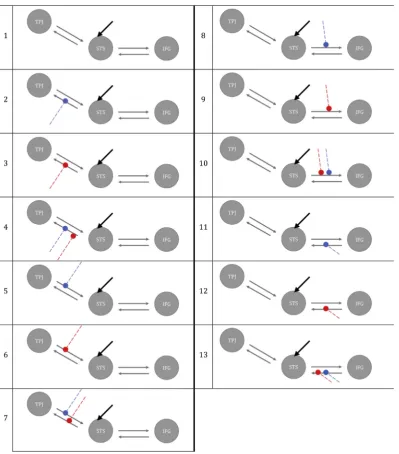
Thirteen alternative models with different modulatory effects of V and NV were constructed with DCM-SPM toolbox for the fMRI data (Friston et al., 2003) and with DCM-fNIRS toolbox for the fNIRS data (Tak et al., 2015). All models were defined as bilinear and deterministic. Auditory input for both V and NV entered the network by directly acti-vating STS across all models. In all the hypothesized models, wefixed bidirectional intrinsic connection between STS and TPJ and STS and IFG. The models varied for the presence or absence of modulatory effects of auditory processing of V and NV on the connections. See all the possible models inFig. 4.
Specification and estimation of the DCM models
[image:7.595.40.287.55.175.2]The DCM models werefitted to the optical density signal averaged Fig. 3. Coordinates and plots of fMRI ROIs and fNIRS cortical source regions on
the T2 structural image. IFG, inferior frontal gyrus; STS, superior temporal sulcus; TPJ, temporo-parietal junction. The red sphere corresponds to the fMRI ROIs and the blue circle to the fNIRS cortical source regions.
[image:7.595.101.501.263.718.2]across trials. Specifically, the generative model of fNIRS data was created by linking the optics equation to the hemodynamic and neurodynamic equations (Arridge, 1999;Buxton et al., 2004;Cui et al., 2010;Delpy et al., 1988;Friston et al., 2003). The DCM parameters were then esti-mated from fNIRS data using an established Bayesian framework (vari-ational Laplace), which enabled inference about changes in directed connectivity at the neuronal level (Friston et al., 2007;Penny, 2012). In this study, we augmented the optics model used for DCM-fNIRS analysis (Tak et al., 2015) by adding a scaling factor to a sensitivity matrix:
yðλ1Þ yðλ2Þ
¼
εHðλ1ÞWHSðλ1Þ εQðλ1ÞWQSðλ1Þ εHðλ2ÞWHSðλ2Þ εQðλ2ÞWQSðλ2Þ
ΔHc ΔQc
where y is measurements of optical density changes; εH and εQ are
extinction coefficients for oxy-Hb and deoxy-Hb;WHandWQare factors
for correcting pial vein contamination of fNIRS measurements;ΔHcand ΔQcare oxy-Hb and deoxy-Hb in the cortical source regions of interest;
andS¼k⋅S0whereS0is the sensitivity function calculated from products of the forwardfield and the adjointfield, andkis a scaling term. We treated this scaling termkas free parameters with informed priors, to accommodate a variation in source strength (and detection efficiency). This enabled us to calculate a matrix of the sensitivity, S, to the
absorption coefficient changes, using outputs of the Toast software (Schweiger and Arridge, 2014).
fMRI-fNIRS DCM model comparisons
[image:8.595.113.483.305.725.2]After the statistical estimation of each model for both fMRI and fNIRS data, comparisons of the DCM models estimated with fNIRS and fMRI were performed to evaluate effective connectivity correspondence be-tween the two methodologies. The comparison of the DCM models was mainly based on the variational Free Energy (F), which is thought to have the best model selection ability and is highly recommended for com-parisons, mostly in high signal-to-noise ratio conditions, as with infant data (Penny, 2012). Bayesian model selection (BMS) was applied in order to estimate the best model on the fMRI and fNIRS data (Friston et al., 2016;Stephan et al., 2007). Our aim was not to investigate why a specific model wins in the BMS comparison, but to see whether there is any convergence between fMRI and fNIRS data, thus answering a methodo-logical rather than a cognitive question. We then estimated the strength of connections for each model (Bayesian Model Average, BMA) for both fMRI and fNIRS to investigate whether there is any correspondence be-tween the two methodologies.
Results
Activation results
Prior to DCM analyses, we explored brain regions activated by the two experimental conditions with fMRI and fNIRS.
As previously shown, IFG, STS, and TPJ were involved in the auditory processing in both fMRI and fNIRS (Blasi et al., 2011,2015;Lloyd-Fox et al., 2012a). The detailed comparison between fMRI and fNIRS acti-vations simultaneously recorded is object of another study in preparation (A. Blasi, B. Manini, S. Brigadoi, R. Cooper, G. Barker, S. Wastling, Lloyd-Fox, M.H. Johnson and C.E. Elwell, Simultaneous fMRI and fNIRS analysis in young infants, Poster presentation at 2016 Biennial Meeting of the Society of functional near-infrared spectroscopy, Paris).
DCM results
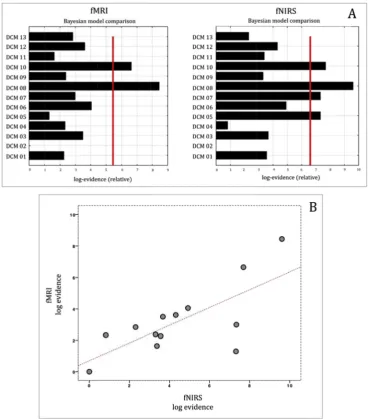
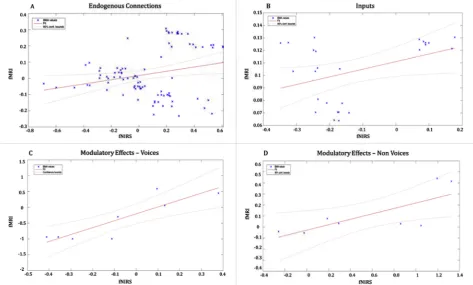
Fig. 5shows the correspondence of F values and the BMS comparison between fMRI and fNIRS. Fig. 6 shows the correlation between BMA values estimated with fMRI and fNIRS.
We found a high correspondence between fMRI and fNIRS DCM models (Fig. 5A). Moreover, BMS showed model 8 as the best model for both fMRI and fNIRS, which presented modulatory effect of NV in the STS→IFG connection. Pearson correlation confirmed a strong relation-ship between fMRI and fNIRS BMS log evidence (r¼0.718, p¼0.006) (Fig. 5B).
To assess the strength of the correspondence between the fMRI-DCM and the fNIRS-DCM results, we used a robust-regression method to compare the parameters estimates obtained for all of the models across the two datasets. We find that the strength of the connections (BMA values) estimated for the 13 models with the two methodologies are highly related for the endogenous connections (Fig. 6A) (F(1,89)¼5.55,
p¼0.020, R2¼0.058), the inputs (Fig. 6B) (F(1,24)¼4.35, p¼0.047, R2¼0.153), and the modulatory effects (Fig. 6C and D) on V (F(1,6)¼16.4, p¼0.006, R2¼0.732) and on NV (F(1,6)¼6.65, p¼0.041, R2¼0.526).
In addition, we have repeated the regression analysis with a bootstrap method for the endogenous connections (Fig. 7A) (F(1,89)¼5.63, p¼0.019, R2¼0.059, C.I.¼0.114, 0.855), the Inputs (Fig. 7B) (F(1,24)¼4.67, p¼0.040, R2¼0.163, C.I.¼ 1.712, 0.353), the modulatory effects (Fig. 7C and D) on V (F(1,6)¼20.2, p¼0.004, R2¼0.771, C.I¼0.17, 0.43) and on NV (F(1,6)¼7.6, p¼0.033, R2¼0.559, C.I¼2.67, 3.7).
Discussion
Developing and applying appropriate analysis methods for the study of neural connectivity in the infant brain is a complex technical chal-lenge. Here we provide a proof-of-principle for the application of DCM to infant fNIRS data. We took a unique dataset, comprising a simultaneous fMRI-fNIRS recording on a single infant listening to different sounds during sleep. We applied the same DCM analyses to both fMRI and fNIRS data, overcoming a number of challenges in the development of the fNIRS analysis stream. Wefind converging results between both the fMRI and fNIRS methods, and thus our paper demonstrates both the feasibility and validity of applying DCM to infant fNIRS data. We discuss our results
first in terms of the broaderfield of infant connectivity measures and then in terms of future directions. There are major limitations in using fMRI to investigate connectivity in development and this paper provides a solu-tion by showing that reliable results can be obtained with fNIRS instead. There are a number of different ways in which neuroimaging data (specifically fMRI or fNIRS) can be used to estimate the connectivity between different brain regions (for a review seeLi et al., 2009), but only DCM provides detailed information of the relation and the causality
between brain areas (Friston, 1994). In particular, we want to point out that most of the other connectivity methods just ask ‘does signal A correlate with signal B’without enquiring about where the signals come from. In contrast, DCM builds a full model of the neural origins of the signals and models connectivity at the neural level. For this reason, DCM requires much more detailed information about the origin of the signals, compared to PPI.
To convert the scalp-level fNIRS concentrations into estimates of neural activity, we need to know the precise anatomy of the head and its optical properties. Hence, applying fNIRS-DCM to a new (non-adult) population requires high-quality anatomical images, very clean seg-mentations and accurate estimation of the NIRS optical sensitivity functions. Here we were able to use the infant's high-resolution anatomical images to complete this step. However, future studies could use pre-segmented infant templates, whenever these are available (Richards et al., 2016;Sanchez et al., 2012a,b). Note that despite the low spatial resolution of fNIRS, it is not possible to perform DCM-fNIRS without any detailed anatomical data, because DCM-fNIRS relies on a sophisticated model of how neural activation isfiltered via the haemo-dynamic response and the optical properties of the head to give the fNIRS signal recorded at the scalp. This calculation requires a high-resolution anatomical input, whether from each individual participant or from an age-appropriate template.
Several technical issues had to be overcome in order to apply DCM on infant data. Firstly, we successfully imported the T2 of the participant in the NIRS toolbox in order to obtain an accurate estimation of the con-nectivity results. We were able to estimate the NIRS optical sensitivity functions, which required participant T2 segmentation, the creation of a high-density mesh and estimation of the optodes location. All these technical challenges have been solved and specific features have been adapted for infant data, allowing other researchers to use DCM on fNIRS data without the need for MRI.
Although our results refer to a single case study, this study shows that DCM for fNIRS is valid for exploring effective connectivity in infant data. We hope that this project can open the door to a new line of research where fNIRS can provide useful information about effective connectivity in infants and toddlers.
Advice for future users and limitations of this work
Starting from this validation work of DCM in infants, we provide here some advice for future studies, so that other researchers can take this paper as reference and guidance for the use of DCM with infant fNIRS data. As described above, an anatomical MRI scan of the participant is not essential if high-resolution age-appropriate templates are available. We recommend the use of the‘Neurodevelopmental MRI Database’, which is the most accurate MRI database available so far in the developmental neurosciencefield, both for quality of images and precision of the age range (Richards et al., 2016;Sanchez et al., 2012a,2012b). The NIRS optical sensitivity functions can be estimated on the same age-range specific structural template as is used for the spatial registration, instead of using the T2 scan of the participant as we did. It is worth reminding the reader that in this specific study, we performed the spatial registration and the NIRS optical function estimation on the structural scan of the participant, not on a template of the appropriate age as we have suggested for future users. However, while it is established for adults that template-based methods work more precisely than registra-tion performed on a single structural scan, there is no evidence that is still the case in the developmentalfield. Considering that we have not per-formed the same processing and connectivity estimation also on an age-range specific structural template, we cannot infer whether connec-tivity results could benefit from the choice of one or another method.
[image:10.595.60.534.57.342.2]participant's head to mark reference points and optodes location on an MRI template, even though this method might result in location inac-curacies, due for example to warping of the pictures - which might lead to erroneous estimation of the distance between points - or human mistakes in positioning the marks on the MRI template. Alternatively, researchers can register optode locations with a digitizer, such as Polhemus Digitising System (http://polhemus.com/scanning-digitizing/digitizing-products/
), with the possibility to take into account infants' movement during the recording. However, we acknowledge that the use of a digitizer is not always possible and realistic with restless and fidgety infants, so the support of pictures for spatial registration is still currently used in the developmental research practice. With both these methods mentioned, optode locations and reference points can then be plotted on an MRI template, and then used as input for the spatial processing in both SPM-NIRS anddcm_fnirstoolboxes. The use of an age-specific template for both spatial registration and for the estimation of the NIRS optical sensitivity functions will allow researchers to apply DCM to every infant dataset and follow our pipeline, avoiding the need for the acquisition of the MRI for each participant tested.
Researchers working with infants and interested in network analysis should bear in mind that motion artefacts are recognized as one of the major methodological challenge for functional connectivity studies (Satterthwaite et al., 2017). In order to avoid false positive, data need to be as clean as possible, which is not always the case of awake and behaving infants, even after an appropriate pre-processing. However, giving that the present validation of DCM has been performed on an asleep participant, we cannot advise future researchers in how the method deals with noisy data. The avoidance of false positive in con-nectivity analysis in highly dependent on the pre-processing steps per-formed before estimating connectivity, and future studies focusing on the application of several pre-processing streams and cleaning methods might elucidate how accurate is DCM with noisy infant data.
Future directions
In the near future, we aim to apply DCM on a full infant dataset, in order to estimate effective connectivity without relying on the support of MRI scans. While this present study is focused on the application and validation of the method, we hope to be able to further utilise DCM in infants in order to ask psychological and cognitive questions. DCM-fNIRS is already available in the SPM12 software and we will be involved in integrating the scripts we modified for the specification of the DCM models in the maindcm_fnirspackage, in order to facilitate and promote the application of this technique by other research teams.
We hope that this study can aid developmental neuroscientists who are interested in exploring brain connectivity in infancy and early childhood. We encourage the study of effective connectivity using DCM in the developing brain, in order to gain a deeper understating of brain mechanisms during specific conditions, for example social interaction. We are confident that this study will be a good reference for a new line of research that will not only shed light on how connectivity develops and changes during specific stimulation, but provides researchers who use fNIRS with a valuable tool to interpret their data and to draw psycho-logical conclusions.
Conflicts of interest
None.
Acknowledgments
This work was undertaken at the Centre for Brain and Cognitive Development, Birkbeck College, London. Chiara Bulgarelli, Carina de Klerk, Victoria Southgate acknowledge support from Leverhulme Trust Research Project Grant- 2015-115, Samuel Powell acknowledges support from RAEng Fellowship RF1516\15\33, Sabrina Brigadoi acknowledges
support from University of Padova Grant STPD11B8HM, Sungho Tak acknowledges support from Korea Basic Science Institute Grant (T38240) and Antonia Hamilton acknowledges support from ERC grant 313398 INTERACT.
We are grateful to Gareth Barker and Stephen Wastilng (Department of Neuroimaging, IOPPN, King's College London, UK) and Barbara Manini (Brain and Language Laboratory for Neuroimaging, Gallaudet University, USA) for the data acquisition. This study was supported in part by the UK MRC (G0701484), and The Simons Foundation (nSFARI201287 to MHJ).
References
Anzellotti, S., Kliemann, D., Jacoby, N., Saxe, R., 2017. Directed network discovery with dynamic network modelling. Neuropsychologia 99 (February), 1–11.http://doi.org/ 10.1016/j.neuropsychologia.2017.02.006.
Arridge, S.R., 1995. Photon-measurement density functions Part I: analytical forms. Appl. Opt. 34 (31), 7395.http://doi.org/10.1364/AO.34.007395.
Arridge, S.R., 1999. Optical tomography in medical imaging. Inverse Probl. 15 (2), R41–R93.http://doi.org/10.1088/0266-5611/15/2/022.
Arridge, S.R., Schweiger, M., 1995. Photon-measurement density functions. Part 2:fi nite-element-method calculations. Appl. Opt. 34 (34), 8026–8037.http://doi.org/10. 1364/AO.34.008026.
Arridge, S.R., Schweiger, M., Hiraoka, M., Delpy, D.T., 1993. Afinite element approach for modeling photon transport in tissue. Med. Phys. 20 (2 Pt 1), 299–309.http://doi. org/10.1118/1.597069.
Belin, P., Zatorre, R.J., Lafaille, P., Ahad, P., Pike, B., 2000. Voice-selective areas in human auditory cortex. Nature 403 (6767), 309–312.http://doi.org/10.1038/ 35002078.
Blasi, A., Lloyd-Fox, S., Sethna, V., Brammer, M.J., Mercure, E., Murray, L.,
Johnson, M.H., 2015. ScienceDirect Atypical processing of voice sounds in infants at risk for autism spectrum disorder. Cortex 1 (71), 122–133.
Blasi, A., Mercure, E., Lloyd-Fox, S., Thomson, A., Brammer, M.J., Sauter, D., Murphy, D.G.M., 2011. Early specialization for voice and emotion processing in the infant brain. Curr. Biol. 21 (14), 1220–1224.http://doi.org/10.1016/j.cub.2011.06. 009.
Buxton, R.B., Uludag, K., Dubowitz, D.J., Liu, T.T., Uludag, K., Dubowitz, D.J., Liu, T.T., 2004. Modeling the hemodynamic response to brain activation. Neuroimage 23 (Suppl. 1), S220–S233.http://doi.org/10.1016/j.neuroimage.2004.07.013. Canning, C., Scheutz, M., 2013. Functional near-infrared spectroscopy in human-robot
interaction. J. Human-Robot Interact. 2 (3).http://doi.org/10.5898/JHRI.2.3. Canning.
Cui, X., Bray, S., Reiss, A.L., 2010. Functional near infrared spectroscopy (NIRS) signal improvement based on negative correlation between oxygenated and deoxygenated hemoglobin dynamics. NeuroImage 49 (4), 3039–3046.http://doi.org/10.1016/j. neuroimage.2009.11.050.
Damaraju, E., Caprihan, A., Lowe, J., 2014. Functional connectvity in the developing brain: a longitudinal study from 4 to 9 months of age. NeuroImage 84, 1–28.http:// doi.org/10.1016/j.neuroimage.2013.08.038.Functional.
Deen, B., Pelphrey, K., 2012. Perspective: brain scans need a rethink. Nature 491 (7422). S20–S20.http://doi.org/10.1038/491S20a.
Delpy, D.T., Cope, M., van der Zee, P., Arridge, S., Wray, S., Wyatt, J., 1988. Estimation of optical pathlegth through tissue from direct time offlight measurement. Phys. Med. Biol. 33 (12), 1433–1442.
Duncan, A., Meek, J.H., Clemence, M., Elwell, C.E., Tyszczuk, L., Cope, M., Delpy, D., 1995. Optical pathlength measurements on adult head, calf and forearm and the head of the newborn infant using phase resolved optical spectroscopy. Phys. Med. Biol. 40 (2), 295–304.http://doi.org/10.1088/0031-9155/40/2/007.
Elwell, C.E., 1995. In: Hamamatsu Photonics KK (Ed.), A practical Users Guide to Near Infrared Spectroscopy. Hamamatsu Photonics KK, (Hamamatsu). London (UK). Emberson, L.L., Richards, J.E., Aslin, R.N., 2015. Top-down modulation in the infant
brain: learning-induced expectations rapidly affect the sensory cortex at 6 months. Proc. Natl. Acad. Sci. U. S. A. 112 (31), 9585–9590.http://doi.org/10.1073/pnas. 1510343112.
Everdell, N.L., Gibson, A.P., Tullis, I.D.C., Vaithianathan, T., Hebden, J.C., Delpy, D.T., 2005. A frequency multiplexed near-infrared topography system for imaging functional activation in the brain. Rev. Sci. Instrum. 76 (9).http://doi.org/10.1063/ 1.2038567.
Fang, Q., Boas, D.A., 2009. Tetrahedral mesh generation from volumetric binary and grayscale images. In: Proceedings - 2009 IEEE International Symposium on Biomedical Imaging: from Nano to Macro, ISBI 2009, pp. 1142–1145.http://doi.org/ 10.1109/ISBI.2009.5193259.
Ferrari, M., Quaresima, V., 2012. NeuroImage A brief review on the history of human functional near-infrared spectroscopy ( fNIRS ) development andfields of application. NeuroImage 63 (2), 921–935.http://doi.org/10.1016/j.neuroimage. 2012.03.049.
Fransson, P., Åden, U., Blennow, M., Lagercrantz, H., 2011. The functional architecture of the infant brain as revealed by resting-state fMRI. Cereb. Cortex.http://doi.org/10. 1093/cercor/bhq071.
Friston, K.J., 2011. Functional and effective connectivity: a review. Brain Connect. 1 (1), 13–36.http://doi.org/10.1089/brain.2011.0008.
Friston, K.J., Ashburner, J., 1994. Statistical parametric mapping. Funct. Neuroimaging Tech. Found. 1–74.
Friston, K.J., Harrison, L., Penny, W., 2003. Dynamic causal modelling. NeuroImage 19 (4), 1273–1302.http://doi.org/10.1016/S1053-8119(03)00202-7.
Friston, K.J., Li, B., Daunizeau, J., Stephan, K.E., 2011. Network discovery with DCM. NeuroImage 56 (3), 1202–1221.http://doi.org/10.1016/j.neuroimage.2010.12.039. Friston, K.J., Litvak, V., Oswal, A., Razi, A., Stephan, K.E., Van Wijk, B.C.M., Zeidman, P.,
2016. Bayesian model reduction and empirical Bayes for group (DCM) studies. NeuroImage 128, 413–431.http://doi.org/10.1016/j.neuroimage.2015.11.015. Friston, K.J., Mattout, J., Trujillo-Barreto, N., Ashburner, J., Penny, W., 2007. Variational
free energy and the Laplace approximation. NeuroImage 34 (1), 220–234.http://doi. org/10.1016/j.neuroimage.2006.08.035.
Friston, K.J., Williams, S.C., Howard, R., Frackowiak, R.S., Turner, R., 1996. Movement-related effects in fMRI time-series. Magn. Reson. Med. Offic. J. Soc. Magn. Reson. Med./Soc. Magn. Reson. Med. 35 (3), 346–355.http://doi.org/10.1002/mrm. 1910350312.
Gao, W., Lin, W., Grewen, K., Gilmore, J.H., 2016. Functional connectivity of the infant human brain: plastic and modifiable. Neurosci.http://doi.org/10.1177/ 1073858416635986.
Granger, C.W.J., 1969. Investigating causal relations by econometric models and cross-spectral methods. Econometrica 37 (3), 424.http://doi.org/10.2307/1912791. Grieve, P.G., Isler, J.R., Izraelit, A., Peterson, B.S., Fifer, W.P., Myers, M.M., Stark, R.I.,
2008. EEG functional connectivity in term age extremely low birth weight infants. Clin. Neurophysiol. 119 (12), 2712–2720.http://doi.org/10.1016/j.clinph.2008.09. 020.
Grossmann, T., Cross, E.S., Ticini, L.F., Daum, M.M., 2013. Action observation in the infant brain : the role of body form and motion. Soc. Neurosci. 8 (1), 22–30.http:// doi.org/10.1080/17470919.2012.696077.
Grossmann, T., Oberecker, R., Koch, S.P., Friederici, A.D., 2010. The developmental origins of voice processing in the human brain. Neuron 65 (6), 852–858.http://doi. org/10.1016/j.neuron.2010.03.001.
Handwerker, D.A., Gonzalez-Castillo, J., D'Esposito, M., Bandettini, P.A., 2012. The continuing challenge of understanding and modeling hemodynamic variation in fMRI. NeuroImage 62, 1017–1023.
He, Y., Evans, A., 2010. Graph theoretical modeling of brain connectivity. Curr. Opin. Neurol. 23 (4), 341–350.http://doi.org/10.1097/WCO.0b013e32833aa567. Holtzer, R., Mahoney, J.R., Izzetoglu, M., Izzetoglu, K., Onaral, B., Verghese, J., 2011.
fNIRS study of walking and walking while talking in young and old individuals. J. Gerontol. - Ser. A Biol. Sci. Med. Sci. 66 A (8), 879–887.http://doi.org/10.1093/ gerona/glr068.
Hoshi, Y., 2007. Functional near-infrared spectroscopy: current status and future prospects. J. Biomed. Opt. 12 (December 2007), 1–9.http://doi.org/10.1117/1. 2804911.
Hoshi, Y., 2016. Hemodynamic signals in fNIRS. Prog. Brain Res. 225, 153–179.http:// doi.org/10.1016/bs.pbr.2016.03.004.
Huettel, Scott A., Song, Allen W., McCarthy, Gregory, Huettel, Scott, Song, A., Beckmann, C., Smith, S.M., Huettel, S. a., Song, A.W., McCarthy, G., 2004. Functional Magnetic Resonance Imaging. Book, vol. 23.
Jenkinson, M., Beckmann, C., Behrens, T., Woolrich, M.W., Smith, S.M., 2012. FSL. NeuroImage.http://doi.org/10.1016/j.neuroimage.2011.09.015.
Johnson, M.H., 2001. Functional brain development in humans. Nat. Rev. Neurosci. 2. Kim, S.G., Richter, W., Uǧurbil, K., 1997. Limitations of temporal resolution in functional
MRI. Magn. Reson. Med. 37 (4), 631–636.http://doi.org/10.1002/mrm. 1910370427.
Knickmeyer, R.C., Gouttard, S., Kang, C., Evans, D., Wilber, K., Smith, J.K., Gilmore, J.H., 2008. A structural MRI study of human brain development from birth to 2 years. J. Neurosci. Offic. J. Soc. Neurosci. 28 (47), 12176–12182.http://doi.org/10.1523/ JNEUROSCI.3479-08.2008.
Kumar, V., Shivakumar, V., Chhabra, H., Bose, A., Venkatasubramanian, G., Gangadhar, B.N., 2017. Functional near infra-red spectroscopy (fNIRS) in schizophrenia: a review. Asian J. Psychiatry 27, 18–31.http://doi.org/10.1016/j.ajp. 2017.02.009.
Kwon, S.H., Scheinost, D., Vohr, B., Lacadie, C., Schneider, K., Dai, F., Ment, L.R., 2016. Functional magnetic resonance connectivity studies in infants born preterm: suggestions of proximate and long-lasting changes in language organization. Dev. Med. Child Neurol. 58, 28–34.http://doi.org/10.1111/dmcn.13043.
Lee, H.L., Zahneisen, B., Hugger, T., LeVan, P., Hennig, J., 2013. Tracking dynamic resting-state networks at higher frequencies using MR-encephalography. NeuroImage 65, 216–222.http://doi.org/10.1016/j.neuroimage.2012.10.015.
Leff, D.R., Orihuela-Espina, F., Elwell, C.E., Athanasiou, T., Delpy, D.T., Darzi, A.W., Yang, G.Z., 2011. Assessment of the cerebral cortex during motor task behaviours in adults: a systematic review of functional near infrared spectroscopy (fNIRS) studies. NeuroImage 54, 2922–2936.
Li, K., Guo, L., Nie, J., Li, G., Liu, T., 2009. Review of methods for functional brain connectivity detection using fMRI. Comput. Med. Imaging Graph. 33 (2), 131–139. http://doi.org/10.1016/j.compmedimag.2008.10.011.
Lin, P.Y., Chen, J.J.J., Lin, S.I., 2013. The cortical control of cycling exercise in stroke patients: an fNIRS study. Hum. Brain Mapp. 34 (10), 2381–2390.http://doi.org/10. 1002/hbm.22072.
Lin, W., Zhu, Q., Gao, W., Chen, Y., Toh, C.H., Styner, M., Gilmore, J.H., 2008. Functional connectivity MR imaging reveals cortical functional connectivity in the developing brain. AJNR.Am. J. Neuroradiol.
Lloyd-Fox, S., Blasi, A., Elwell, C.E., 2010. Illuminating the developing brain: the past, present and future of functional near infrared spectroscopy. Neurosci. Biobehav. Rev. 34 (3), 269–284.http://doi.org/10.1016/j.neubiorev.2009.07.008.
Lloyd-Fox, S., Blasi, A., Mercure, E., Elwell, C.E., Johnson, M.H., 2012a. The emergence of cerebral specialization for the human voice over thefirst months of life. Soc. Neurosci. 7 (3), 317–330.http://doi.org/10.1080/17470919.2011.614696. Lloyd-Fox, S., Blasi, A., Mercure, E., Elwell, C.E., Johnson, M.H., 2012b. The emergence of
cerebral specialization for the human voice over thefirst months of life. Soc. Neurosci. 7 (3), 317–330.http://doi.org/10.1080/17470919.2011.614696. Lloyd-Fox, S., Richards, J.E., Blasi, A., Murphy, D.G.M., Elwell, C.E., Johnson, M.H., 2014.
Coregistering functional near-infrared spectroscopy with underlying cortical areas in infants. Neurophotonics 1 (2), 25006.http://doi.org/10.1117/1.NPh.1.2.025006. Lloyd-Fox, S., Szeplaki-K€ollod, B., Yin, J., Csibra, G., 2015. Are you talking to me? Neural
activations in 6-month-old infants in response to being addressed during natural interactions. Cortex 70, 35–48.http://doi.org/10.1016/j.cortex.2015.02.005. Lu, C.-M.M., Zhang, Y.-J.J., Biswal, B., Zang, Y.F., Peng, D.-L.L., Zhu, C.-Z.Z., 2010. Use of
fNIRS to assess resting state functional connectivity. J. Neurosci. Methods 186 (2), 242–249.http://doi.org/10.1016/j.jneumeth.2009.11.010.
Maidan, I., Nieuwhof, F., Bernad-Elazari, H., Reelick, M.F., Bloem, B.R., Giladi, N., Mirelman, A., 2016. The role of the frontal lobe in complex walking among patients with Parkinsons disease and healthy older adults: an fNIRS study. Neurorehabil. Neural Repair 30 (10), 963–971.http://doi.org/10.1177/1545968316650426. Manjn, J.V., Coup, P., Buades, A., Fonov, V., Louis Collins, D., Robles, M., 2010. Non-local
MRI upsampling. Med. Image Anal. 14 (6), 784–792.http://doi.org/10.1016/j. media.2010.05.010.
Marrus, N., Eggebrecht, A.T., Todorov, A., Elison, J.T., Wolff, J.J., Cole, L., Das, S., 2017. Walking, gross motor development, and brain functional connectivity in infants and toddlers. Cereb. Cortex 28 (2), 1–14.http://doi.org/10.1093/cercor/bhx313. Meijer, E.J., Niemarkt, H.J., Raaijmakers, I.P.P.C., Mulder, A.M., Van Pul, C., Wijn, P.F.F.,
Andriessen, P., 2016. Interhemispheric connectivity estimated from EEG time-correlation analysis in preterm infants with normal follow-up at age offive. Physiol. Meas. 37 (12), 2286–2298.http://doi.org/10.1088/1361-6579/37/12/2286. Okamoto, M., Dan, H., Sakamoto, K., Takeo, K., Shimizu, K., Kohno, S., Dan, I., 2004.
Three-dimensional probabilistic anatomical cranio-cerebral correlation via the international 10-20 system oriented for transcranial functional brain mapping. NeuroImage 21 (1), 99–111.http://doi.org/10.1016/j.neuroimage.2003.08.026. Orekhova, E.V., Elsabbagh, M., Jones, E.J., Dawson, G., Charman, T., Johnson, M.H., 2014. EEG hyper-connectivity in high-risk infants is associated with later autism. J. Neurodev. Disord. 6 (1), 40.http://doi.org/10.1186/1866-1955-6-40. Pan, Y., Cheng, X., Zhang, Z., Li, X., Hu, Y., 2017. Cooperation in lovers: an fNIRS-based
hyperscanning study. Hum. Brain Mapp. 38 (2), 831–841.http://doi.org/10.1002/ hbm.23421.
Penny, W.D., 2012. Comparing dynamic causal models using AIC, BIC and free energy. NeuroImage 59 (1), 319–330.http://doi.org/10.1016/j.neuroimage.2011.07.039. Penny, W.D., Stephan, K.E., Mechelli, A., Friston, K.J., 2004. Comparing dynamic causal
models. NeuroImage 22 (3), 1157–1172.http://doi.org/10.1016/j.neuroimage. 2004.03.026.
Pinti, P., Aichelburg, C., Lind, F., Power, S., Swingler, E., Merla, A., Tachtsidis, I., 2015. Usingfiberless, wearable fNIRS to monitor brain activity in real-world cognitive tasks. J. Vis. Exp. 106.http://doi.org/10.3791/53336.
Piper, S.K., Krueger, A., Koch, S.P., Mehnert, J., Habermehl, C., Steinbrink, J., Schmitz, C.H., 2014. A wearable multi-channel fNIRS system for brain imaging in freely moving subjects. NeuroImage 85, 64–71.http://doi.org/10.1016/j. neuroimage.2013.06.062.
Piva, M., Zhang, X., Noah, J.A., Chang, S.W.C., Hirsch, J., 2017. Distributed neural activity patterns during human-to-human competition. Front. Hum. Neurosci. 11. http://doi.org/10.3389/fnhum.2017.00571.
Power, J.D., Barnes, K.A., Snyder, A.Z., Schlaggar, B.L., Petersen, S.E., 2012. Spurious but systematic correlations in functional connectivity MRI networks arise from subject motion. NeuroImage 59 (3), 2142–2154.http://doi.org/10.1016/j.neuroimage. 2011.10.018.
Richards, J.E., Sanchez, C., Phillips-Meek, M., Xie, W., 2016. A database of age-appropriate average MRI templates. NeuroImage 124, 1254–1259.http://doi.org/10. 1016/j.neuroimage.2015.04.055.
Righi, G., Tierney, A.L., Tager-Flusberg, H., Nelson, C.A., 2014. Functional connectivity in thefirst year of life in infants at risk for autism spectrum disorder: an EEG study. PLoS One 9 (8).http://doi.org/10.1371/journal.pone.0105176.
Rubinov, M., Sporns, O., 2010. Complex network measures of brain connectivity: uses and interpretations. NeuroImage 52 (3), 1059–1069.http://doi.org/10.1016/j. neuroimage.2009.10.003.
Sanchez, C.E., Richards, J.E., Almli, C.R., 2012a. Age-specific MRI templates for pediatric neuroimaging. Dev. Neuropsychol. 37 (5), 379–399.http://doi.org/10.1080/ 87565641.2012.688900.
Sanchez, C.E., Richards, J.E., Almli, C.R., 2012b. Neurodevelopmental MRI brain templates for children from 2 weeks to 4 years of age. Dev. Psychobiol. 54 (1), 77–91. http://doi.org/10.1002/dev.20579.
Satterthwaite, T.D., Ciric, R., Roalf, D.R., Davatzikos, C., Bassett, D.S., Wolf, D.H., 2017. Motion artifact in studies of functional connectivity: characteristics and mitigation strategies. Hum. Brain Mapp. 0.http://doi.org/10.1002/hbm.23665.
Scholkmann, F., Spichtig, S., Muehlemann, T., Wolf, M., 2010. How to detect and reduce movement artifacts in near-infrared imaging using moving standard deviation and spline interpolation. Physiol. Meas. 31 (5), 649–662. http://doi.org/10.1088/0967-3334/31/5/004.
Schweiger, M., Arridge, S., 2014. The Toastþþsoftware suite for forward and inverse modeling in optical tomography. J. Biomed. Opt. 19 (4), 40801.http://doi.org/10. 1117/1.JBO.19.4.040801.
Seth, A.K., Barrett, A.B., Barnett, L., 2015. Granger causality analysis in neuroscience and neuroimaging. J. Neurosci. 35 (8), 3293–3297.http://doi.org/10.1523/JNEUROSCI. 4399-14.2015.
Simmons, a, Moore, E., Williams, S.C., 1999. Quality control for functional magnetic resonance imaging using automated data analysis and Shewhart charting. Magn. Reson. Med. Offic. J. Soc. Magn. Reson. Med./Soc. Magn. Reson. Med. 41 (6), 1274–1278.
Singh, H., Cooper, R.J., Wai Lee, C., Dempsey, L., Edwards, A., Brigadoi, S., Austin, T., 2014. Mapping cortical haemodynamics during neonatal seizures using diffuse optical tomography: a case study. NeuroImage Clin. 5, 256–265.http://doi.org/10. 1016/j.nicl.2014.06.012.
Solovey, E.T., Girouard, A., Chauncey, K., Hirshfield, L.M., Sassaroli, A., Zheng, F., Jacob, R.J.K., 2009. Using fNIRS brain sensing in realistic HCI settings: experiments and guidelines. In: Proc. UIST’09, pp. 157–166.http://doi.org/10.1145/1622176. 1622207.
Southgate, V., Begus, K., Lloyd-Fox, S., di Gangi, V., Hamilton, A., 2014. Goal representation in the infant brain. NeuroImage 85, 294–301.http://doi.org/10. 1016/j.neuroimage.2013.08.043.
Stephan, K.E., Weiskopf, N., Drysdale, P.M., Robinson, P.A., Friston, K.J., 2007. Comparing hemodynamic models with DCM. NeuroImage 38 (3), 387–401.http:// doi.org/10.1016/j.neuroimage.2007.07.040.
Sun, F.T., Miller, L.M., D'Esposito, M., 2004. Measuring interregional functional connectivity using coherence and partial coherence analyses of fMRI data. NeuroImage 21 (2), 647–658.http://doi.org/10.1016/j.neuroimage.2003.09.056. Tagliazucchi, E., Laufs, H., 2014. Decoding wakefulness levels from typical fMRI
resting-state data reveals reliable drifts between wakefulness and sleep. Neuron 82 (3), 695–708.http://doi.org/10.1016/j.neuron.2014.03.020.
Tak, S., Kempny, A.M., Friston, K.J., Leff, A.P., Penny, W.D., 2015. Dynamic causal modeling for functional near-infrared spectroscopy. NeuroImage 111, 338–349. http://doi.org/10.1016/j.neuroimage.2015.02.035.
Tak, S., Uga, M., Flandin, G., Dan, I., Penny, W.D., 2016. Sensor space group analysis for fNIRS data. J. Neurosci. Methods 264, 103–112.http://doi.org/10.1016/j.jneumeth. 2016.03.003.
Toth, B., Urban, G., Haden, G.P., Mark, M., Tor€€ok, M., Stam, C.J., Winkler, I., 2017. Large-scale network organization of EEG functional connectivity in newborn infants. Hum. Brain Mapp. 38 (8), 4019–4033.http://doi.org/10.1002/hbm.23645.
van Dijk, K.R.A., Sabuncu, M.R., Buckner, R.L., 2012. The influence of head motion on intrinsic functional connectivity MRI. NeuroImage 59 (1), 431–438.http://doi.org/ 10.1016/j.neuroimage.2011.07.044.
Weishaupt, D., Kochli, V.D., Marincek, B., Kim, E.E., 2007. How does MRI Work? An introduction to the physics and function of magnetic resonance imaging. J. Nucl. Med. 48 (11), 1910–1910.http://doi.org/10.2967/jnumed.107.045104. Wilcox, T., Biondi, M., 2015. fNIRS in the developmental sciences. Wiley Interdiscip. Rev.
Cognit. Sci.http://doi.org/10.1002/wcs.1343.