N A N O E X P R E S S
Open Access
Functionalization of graphene using deep
eutectic solvents
Maan Hayyan
1,2*, Ali Abo-Hamad
1,3, Mohammed AbdulHakim AlSaadi
1,4and Mohd Ali Hashim
1,3Abstract
Deep eutectic solvents (DESs) have received attention in various applications because of their distinctive properties. In this work, DESs were used as functionalizing agents for graphene due to their potential to introduce new functional groups and cause other surface modifications. Eighteen different types of ammonium- and phosphonium-salt-based DESs were prepared and characterized by FTIR. The graphene was characterized by FTIR, STA, Raman spectroscopy, XRD, SEM, and TEM. Additional experiments were performed to study the dispersion behavior of the functionalized graphene in different solvents. The DESs exhibited both reduction and functionalization effects on DES-treated graphene.
Dispersion stability was investigated and then characterized by UV–vis spectroscopy and zeta potential. DES-modified graphene can be used in many applications, such as drug delivery, wastewater treatment, catalysts, composite materials, nanofluids, and biosensors. To the best of our knowledge, this is the first investigation on the use of DESs for graphene functionalization.
Keywords:Deep eutectic solvents; Ionic liquids; Functionalization; Graphene, Dispersion stability; Nanotechnology
Background
Graphene is a carbon nanomaterial (CNM) that can be used for numerous applications, and it has attracted the intense interest of researchers. It is comprised of sp2 -hybridized carbon atoms packed in a hexagonal network structure to form a flat, two-dimensional sheet [1]. Graphene is easy to functionalize, and it has unique physicochemical properties, such as excellent thermal and electrical conductivities, high surface area, and good mechanical strength [2]. As a result, graphene is applicable in chemical and biochemical sensors, elec-tronics, and energy storage devices [3, 4]. However, the agglomeration of nano-sized carbon is one of the pri-mary obstacles that limits the applications of such de-vices; therefore, this is an important problem that must be solved. The effects of π-π adhesion and van der Waals interactions generally are responsible for this ten-dency. These effects may sometimes cause the restacking of graphene sheets to form graphite [5, 6]. Thus, surface
modification can be introduced to reduce agglomeration and allow the implementation of the inherent properties of graphene.
Functionalization is a process that includes the addition of new functional groups to the surface of the carbon through a chemical or physical attachment. Ac-cording to this connection, functionalization is classified into two types, i.e., covalent and non-covalent functiona-lization [7–9]. With hydrophobic or hydrophilic func-tional groups on the surface of the carbon, dispersibility of CNMs can be improved effectively in different types of solvents. This is caused by reducing the strength of polar-polar interactions and/or the splitting of bulky structures [10]. A graphene oxide (GO) nanosheet can be produced by treating graphite with strong oxidant acids using Hummers’method [8, 11].Then, the product is susceptible to covalent and/or non-covalent treatment with different materials. However, both treatments have their respective benefits for applications. Non-covalent contact between two films of GO and porphyrin was re-ported as highly significant for producing a photocurrent in a photoelectrochemical cell [12]. The composite film was fabricated using a layer-by-layer method, prior to vapour reduction of the GO-porphyrin films. The advan-tages of this system are due to the π-π and electrostatic * Correspondence:[email protected]
1
University of Malaya Centre for Ionic Liquids (UMCiL), University of Malaya, Kuala Lumpur 50603, Malaysia
2
Department of Civil Engineering, University of Malaya, Kuala Lumpur 50603, Malaysia
Full list of author information is available at the end of the article
interactions between the GO sheets and the porphyrin molecules. In another study, GO was used with two types of water-soluble polythiophenes to prepare composite films with enhanced photoresponse [13]. In this case, a chemical reduction and π-stacking took place in one of the prepared GO/polymer suspensions followed by a layer-by-layer treatment with the second polymer solution to fabricate the photoactive film. Similarly, GO and poly(3-hexylthiophene) were used to fabricate a “ dual-fluorescent material” with tunable photoluminescent properties [14]. The final product was useful in sensing amine-based pollutants due to its ratiometric fluorescence response. Apart from the sensing application, the same composite has been used in the design of photo-controlled switches [15]. An improved photo-thermal effect was recorded for the composite because of the photo-induced energy transfer between the graphene and the polythiophene.
Generally, the most common conventional materials used for functionalization are strong inorganic acids, such as sulfuric acid, nitric acid, and mixtures of the two acids. Highly-volatile organic solvents also have been used in this respect. However, due to the associated risks and precautions of using such chemicals, it is highly es-sential to develop safer and more eco-friendly alterna-tives [16].
In the past decade, there was increased interest in ionic liquids (ILs) as new "green" solvents because of their unique physicochemical properties [17, 18]. Zhao et al. used an IL, namely 1-(3-aminopropyl)-3-methylimidazo-lium bromide, as a functionalizing agent to modify gra-phene oxides [19]. The resulting carbon was used to construct a novel, carbon-based sensor for the determin-ation of sunset yellow in soft drinks. A similar functionali-zation process was conducted by Chai and co-workers [20] by using the same materials. The carbon that was ob-tained was used, along with hollow AuPd nanoparticles, as an effective catalyst support for the electro-oxidation of formic acid. However, there are some limitations to the use of ILs, such as the high cost of synthesis, their toxicity, corrosivity, and non-biodegradability.
In 2003, special analogues of ILs were introduced and defined as deep eutectic solvents (DESs) [21]. These sol-vents generally are based on mixtures of a quaternary ammonium or phosphonium salts and an uncharged hydrogen bond donor (HBD), such as an amide, acid, or alcohol. The main feature of DESs is that the melting point of the mixture is lower than that of any of its indi-vidual components [22]. In general, DESs are simple to synthesize, and the synthesis cost is low. In addition, DESs are expected to be non-toxic or less toxic than ILs and to have better biocompatibility than ILs [23–25]. Hence, there are numerous potential applications of DESs in nanotechnology [26].
In this study, selected ammonium- and phosphonium-based DESs were used as novel functionalizing agents for graphene. In addition, the DESs were compared based on the structure of the graphene and the improve-ment in dispersibility. Changes on the structure of the surface were identified by FTIR, Raman spectroscopy, XRD, STA, and TEM. The dispersibility and the stability of the suspension of the DES-functionalized graphene were investigated and characterized using UV–vis spec-troscopy and zeta potential analysis.
Methods Materials
Methyltriphenyl-phosphonium bromide (purity ≥98%), N,N-diethylethanolammonium chloride (purity ≥98%), sucrose, urea (purity ~99.5%), ethanol, (purity ≥99.9%), ethylene glycol (purity 99%), diethylene glycol (purity 99%), and triethylene glycol (purity 99%) were purchased from Merck (Darmstadt, Germany). Choline chloride (2-hydroxyethyl-trimethylammonium) (purity ≥98%) and malonic acid (purity 99%) were provided by Sigma-Aldrich. Anhydrous D(+)-glucose, D(−)-fructose (purity >98.0%) and glycerol (purity 99.8%) were obtained from R&M Chemicals, and potassium permanganate was ob-tained from Univar (purity 99%).
Sixty-nanometer flakes of graphene nanopowder (AO-4) grade were obtained from Graphene Supermarket (USA) with the following specifications: purity 98.5%, lateral par-ticle size ~ 3–7 microns, 60 nm average flake thickness, and specific surface area <15 m2/g.
Table 1 provides a list of the chemicals used for the preparation of DES.
DES synthesis
All solid materials were dried at 60 °C under vacuum be-fore they were used. All of the DESs listed in Table 1 were prepared by following the Abbott et al. method [21, 27]. Salts and HBDs were mixed according to the given molar ratio using a jacketed vessel accompanied by mechanical or magnetic stirring for liquid or solid HBDs, respectively). The temperature was set to a mini-mum of 70 °C during the synthesis of the DESs, which took no more than 3 h at atmospheric pressure and under tight moisture control. The resulting transparent, homogenous liquids were transferred to well-sealed and dark vials.
General procedure for the pretreatment of graphene Graphene nanopowder flakes were dried at 100 °C under a vacuum for 3 h to eliminate any water that was present on the surface of the carbon. A 1-M solution of KMnO4 was prepared at 70 °C for ease of solvation. Graphene was oxidized by the following procedures: 1) 200 mg of graphene were mixed with 7 ml of the previous perman-ganate solution inside a 20-ml glass vial; 2) the mixture was subjected to ultrasound waves using an ultrasonic bath at 70 °C for 3 h; 3) graphene was collected by a
filtration process under vacuum using filter paper with a pore size of 0.45 μm; 4) the graphene was washed sev-eral times with 0.01M HCl and distillated water until a clear, transparent product was obtained; and 5) the col-lected cake was dried for 3 h at 100 °C.
Graphene functionalization process
[image:3.595.54.540.99.589.2]In a procedure similar to the previous chemical treat-ment of the graphene flakes, functionalization was con-ducted ultrasonically in a 20-ml glass vial that contained
Table 1List of chemicals used with their formulae and abbreviations
Name of material Abbr. Formula Name of material Abbr. Formula
Choline chloride ChCl Urea U
N,N-Diethylethanolammonium chloride
N,N Malonic acid MA
Methyltriphenyl-phosphonium bromide
MPB D-(+)-Glucose Glu
Glycerol Gly D-(−)-Fructose Fru
Ethylene glycol EG Sucrose Suc
Diethylene glycol DEG Water W
200 mg of oxidized graphene and 7 ml of DES. The sus-pension was sonicated for 3 h at 60 °C and then filtered under vacuum. The retained carbon was washed with water until a transparent effluent was produced that had the same pH as the influent. The experiments included 18 different DESs, and, for comparison, one experiment was conducted with the pristine graphene without prior treatment with KMnO4. Graphene was collected and dried in air at 100 °C for at least 3 h and then trans-ferred to a clean-air desiccator where it was allowed to cool to room temperature. Then, the graphene samples were ready for characterization.
Instruments and measurements
The FTIR measurements of the carbon samples before and after the treatment were conducted using a Perkin Elmer FTIR spectrometer with a range of 450–4000 wavenumbers and a four-time scanning repetition. All DESs and their individual components were analyzed under the same conditions. Thermogravimetric analysis (TGA) and Differential Thermogravimetry (DTG) were performed simultaneously for all samples using the Sim-ultaneous Thermal Analyzer (STA-6000, PerkinElmer). The tests were performed in an N2environment and at a heating rate of 5 °C/min. Raman spectroscopy (Renishaw System 2000 Raman Spectrometer) and X-ray diffraction tests (XRD) also were performed in this study.
In order to obtain a fair idea of the successful modifi-cation of graphene, a series of dispersibility tests was conducted using solvents with different polarities, e.g., distillated water, acetone, and n-hexane [28]. First, gra-phene was dispersed in the solvent at a concentration of 1 mg/ml, and the mixture was sonicated for 10 min and then allowed to settle for 24 h. Photos of the dispersion were taken before and after the settling, and the disper-sibility was evaluated based on the particles of graphene that were precipitated [29].
UV–vis spectroscopy was conducted using PerkinEl-mer-Lambda [30] to characterize the dispersion behavior of pristine graphene and oxidized graphene in a water medium. A suspension of 0.5 mg/ml was prepared and sonicated for 1 h before the analysis. Additional characterization of the treated and untreated samples was conducted for zeta potential and particle size using a Zetasizer (Malvern, UK).
Results and discussion DES FTIR spectra
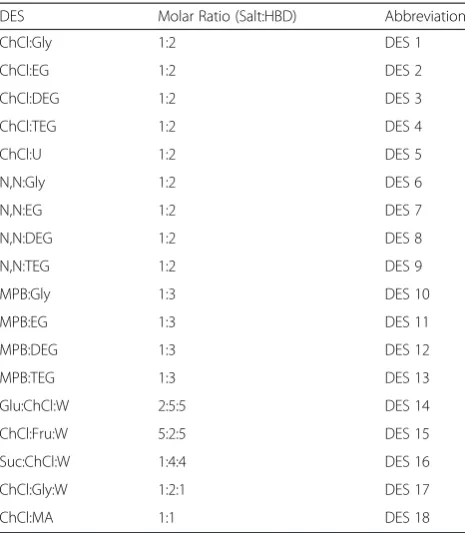
Before identifying the structural changes on the surface of the carbon, a preliminary investigation was conducted to recognize the functional groups of DES as functiona-lizing agents. Therefore, FTIR spectra were studied for all of the selected DESs and their individual components. The spectrum of each DES, which is a combination of two or more components, was interpreted based on the well-known and recognized peaks of DES components. Figure 1(a) and (b) show the FTIR spectra for DES 1 and DES 5 along with their individual components, i.e., ChCl, Gly for DES 1, and ChCl, U for DES 5.
The details of the FTIR spectra are provided in Additional file 1: Figures S1-S38, and they are illus-trated in Additional file 2: Tables S1-S18 in the Sup-plementary Appendix. For each DES, a comparison was made between the DES spectrum and its individ-ual components. Each table relates to a type of DES and involves the peaks in the spectrum of the DES and in its individual components. The peaks of the DES spectra may be identical to those of salt or HBD. However, some shifting was noticed in some peaks, as shown in Fig. 1 and Additional file 1: Figures S1-S18.
[image:4.595.57.290.110.377.2]Additional file 3: Table S19 indicates the peaks that were detected for each DES and the matching functional group. The origins of the functional groups, which can be either from the salt or the HBD, also are provided in Additional file 3: Table S19. For the DESs prepared from liquid HBDs, the FTIR spectra tended to simulate the spectra of their liquid components with only a few dif-ferences, which were attributed to the contribution of the salt. References used to interpret the FTIR spectra of the DESs and their individual components are available in previous studies [30–35].
Table 2List of DESs prepared with molar ratios and abbreviations
DES Molar Ratio (Salt:HBD) Abbreviation
ChCl:Gly 1:2 DES 1
ChCl:EG 1:2 DES 2
ChCl:DEG 1:2 DES 3
ChCl:TEG 1:2 DES 4
ChCl:U 1:2 DES 5
N,N:Gly 1:2 DES 6
N,N:EG 1:2 DES 7
N,N:DEG 1:2 DES 8
N,N:TEG 1:2 DES 9
MPB:Gly 1:3 DES 10
MPB:EG 1:3 DES 11
MPB:DEG 1:3 DES 12
MPB:TEG 1:3 DES 13
Glu:ChCl:W 2:5:5 DES 14
ChCl:Fru:W 5:2:5 DES 15
Suc:ChCl:W 1:4:4 DES 16
ChCl:Gly:W 1:2:1 DES 17
Glycolic-based DESs (1, 2, 3, 4, 6, 7, 8, 9, 10, 11, 12, and 13) Table 3 lists the functional groups extracted from the glycolic HBDs after the formation of the DESs. These groups are in accordance with all glycolic compounds, i.e., G, EG, DEG, and TEG, although each one has some unique functional groups. The O-H bond was found in the glycolic-based DESs and in all other DESs used in this study. Stretching vibration, which was detected in all of the DESs, was the most common vibration for this functional group, while in-plane bending vibration was detected in only a few types, as shown in Table 3.
However, the OH group may reflect the intentional or unintentional presence of H2O from the raw materials that were used, since all of the HBDs had this functional group. The C–H, C–O, and C-C-O functional groups were identified in all glycolic-based DESs. They seemed to be the dominant groups that existed when the four glycols were involved.
[image:5.595.61.539.87.574.2]DESs (Table 4). The prominent group detected in all ChCl-based DESs was CH2. However, the remaining four groups were found in minute quantities in some types of DESs. Having urea as part of the mixture enabled the appearance of N-H and C–N+ bonds from a ChCl source. Thus, three ChCl-based functional groups out of four can be detected with the presence of U as an HBD.
N,N based-DESs (6, 7, 8, and 9)
Only three functional groups were identified in the N,N-based DESs (Table 5). C-H groups were observed in all N,N-based DESs prepared from glycolic HBDs. The type of glycolic HBD tended to have a role in determining the salt contributions by controlling the functional groups that were being identified.
MPB-based DESs (10, 11, 12, and 13)
The aromatic ring in MPB was clearly identified in MPB-based DESs as =C-H and C=C groups. The bond between this ring and the phosphorus atom also was found in all of the DESs based on MPB salt as was the case in the salt itself. However, the P-CH3 functional group was detected in the DEG-based DESs, as illus-trated in Table 6.
Effects of the pretreatment of graphene
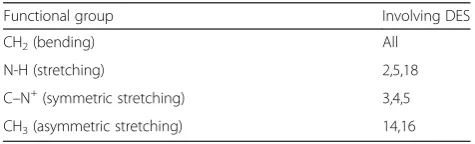
According to the FTIR results shown in Fig. 2, the spectrum of oxidized graphene (o-Gr) was rich in peaks of oxygen-containing functional groups. The spectrum showed the stretching vibration of the C=O band
between 1700–2200 cm-1 and other oxygen bridges, such as C–O–C, C–O–H, and C–O, between 1463– 1020 cm-1[36, 37], which was not the case the pristine graphene (p-Gr). The bands at wavenumbers 3392 cm-1and 657 cm-1 might correspond to the O–H bond with stretching and bending vibrational modes [9]. However, in the p-Gr spectrum (blue line), the prominently-detected peaks corresponded to =CH2 asymmetric and symmetric stretching at 2915 cm-1and 2850 cm-1 [38] and at 3783 cm-1 and 672 cm-1, which were expected to be for the stretching and bending vi-brations of the C–H bond, respectively. The C=C from unoxidized sp2CC bonds was found at 1618 cm-1[39, 40], while the peak at 2300 cm-1was caused by the absorp-tion of CO2from the air [41]. These prominent groups in p-Gr have a hydrophobic nature, which determines the dispersibility behavior in aqueous and non-aqueous solutions.
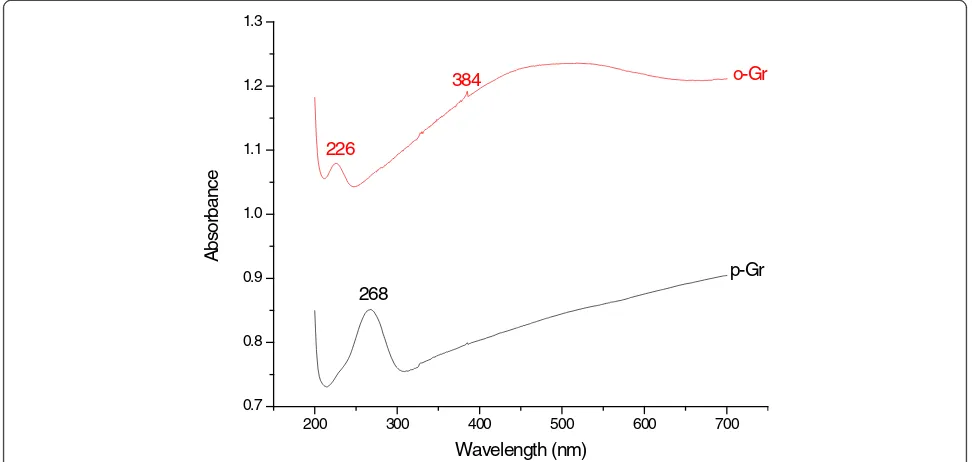
[image:6.595.304.540.110.168.2] [image:6.595.57.291.111.251.2] [image:6.595.55.293.662.734.2] [image:6.595.303.540.663.733.2]The p-Gr and o-Gr were dispersed in water and scanned spectrophotometrically in the wavelength range of 200–700 nm. Figure 3 shows that the disper-sion of pristine graphene had strong UV absorption at 268 nm, which can be ascribed to the π–π* transition of the C=C bond. After treatment with KMnO4, the peak shifted to 226 nm, and a shoulder peak appeared at 384 nm, indicating the n–π*transition of carboxyl groups [29, 42, 43].
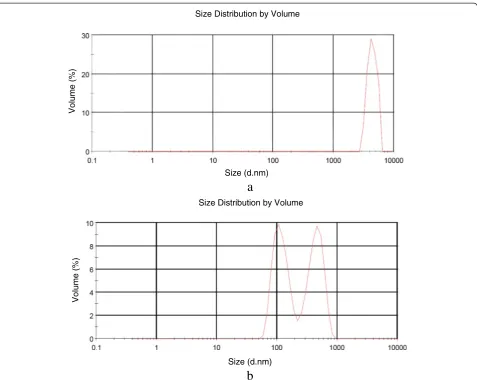
The aqueous dispersions of p-Gr and o-Gr were characterized further by dynamic light scattering (DLS). The study was conducted using the standard model of a spherical particle (Fig. 4). Graphene par-ticles were obtained by the prolonged sonication of p-Gr and o-Gr in water, and the average sizes were 3.364 μm and 0.4773 μm, respectively. However, while graphene particles are not spherical, the model can be used to identify relative changes in size after the pretreatment. The results corresponded with the
Table 3Functional groups coming from glycolic HBDs after DES formation with different salts
Functional group Involving DES
O-H (stretching) 1,2,3,4,6,7,8,9,10,11,12,13 (all)
sp3hybridized C–H (stretching) All
C–O (stretching) in 1° alcohol All
C-C-O (asymmetric stretching) All
C-C-O (symmetric stretching) All
O-H (Out-of-plane bending) All except 13
C–O–H (bending) 2,3,6,7,8,10,11,12
O-H (In-plane bending) 3,11,12,13
CH2(bending) 6,7,8,9,10,11,12,13
Table 4Functional groups coming from ChCl salt after DES formation
Functional group Involving DES
CH2(bending) All
N-H (stretching) 2,5,18
C–N+(symmetric stretching) 3,4,5
CH3(asymmetric stretching) 14,16
Table 5Functional groups coming from N,N salt after DES formation
Functional group Involving DES
C-H (deformation) All
N-H+(stretching) of quaternary ammonium 7,9
C–N+(symmetric stretching) 7,8
Table 6Functional groups coming from MPB salt after DES formation
Functional group Involving DES
=C-H and ring C=C (stretching) 10,11,12,13 (all)
P-Phenyl (stretching) All
P-CH3(asymmetrically CH3deformation) 12
specifications of the p-Gr that was used (i.e., a par-ticle size between 3–7 μm) and indicated a significant decrease in the particle size by a ratio of 1/7 after treatment with KMnO4. Further information about the impact of pretreatment with graphene is dis-cussed in the Raman spectroscopy analysis, XRD test, and STA sections.
FTIR of DES-modified graphene
FTIR analyses for a series of DES-modified graphenes were conducted to characterize the functionalization
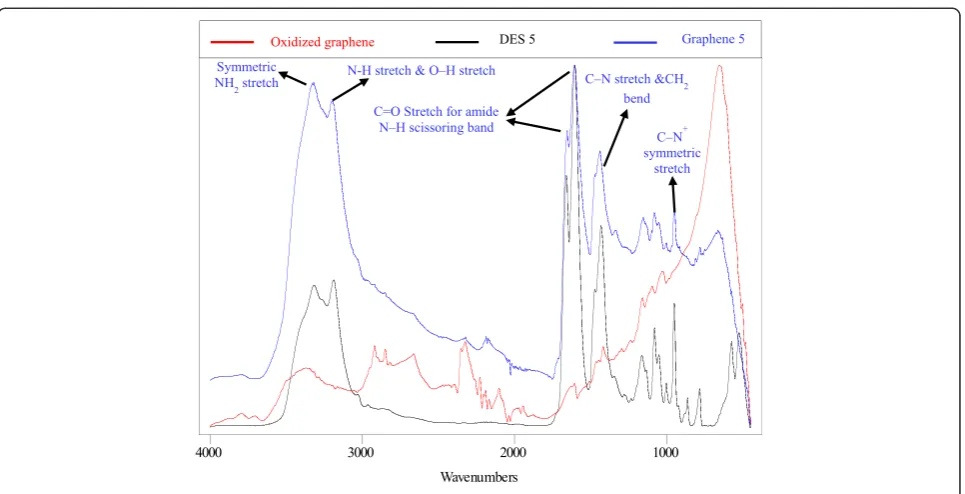
process. Figure 5 shows the FTIR spectra of oxidized graphene, DES 5, and DES 5-functionalized graphene (graphene 5) as examples. However, all FTIR spectra of treated and untreated graphene samples are provided in-dividually in Additional file 1: Figures S19-S39. After the DES treatment, the results showed that various func-tional groups appeared. These bonds can be tuned for a required purpose by modifying different DESs. Table 7 illustrates the cases in which the changes on the gra-phene are detectable by FTIR analysis. However, not all DESs produced new functional group allocations on the
4000 3500 3000 2500 2000 1500 1000 500
0.33 0.34 0.35 0.36 0.37 0.38 0.39 0.40
o-Gr
C=C aromatic ring
C=C aromatic ring
A
bs
or
banc
e
Wavenumbers (cm-1) - CH2- asymmetric
symmetric and stretch
O–H stretch CO2 absorption
C=O stretch
C–O Out-of-plane bend and different oxygen bridges, e.g. =C–O–C=
O–H Out-of-plane bend
O–H stretch C–H stretch
p-Gr
Fig. 2FTIR spectra of pristine graphene (p-Gr) and oxidized graphene (o-Gr)
200 300 400 500 600 700
0.7 0.8 0.9 1.0 1.1 1.2 1.3
p-Gr
384
226
A
bs
o
rbanc
e
Wavelength (nm) 268
o-Gr
[image:7.595.56.539.89.309.2] [image:7.595.55.541.484.715.2]surface of the carbon. DESs 7, 11, and 18 influenced the spectra on which the peaks related to impurities or oxy-gen bonds totally disappeared, indicating the reduction effect. It was clearly noted that the minimum number of peaks occurred for graphene treated with DES 18. This sample represented the highest purity sample with no intense peaks in its spectrum. The high acidity of this DES (pH = 0.14) was responsible for cleaning the sur-face of the graphene. Conversely, DES 5 was the most affecting agent among the DESs, and five new peaks were detected after treatment, all of which corresponded to peaks in the DES spectrum. The bands between 3326–3186 cm-1 represented −NH2 and −NH− stretching vibrations, whereas the in-plane stretching of –NH was evident at ~1605 cm-1[44, 45].
Given the above observations, it is apparent that at any rate, the treatment of graphene with KMnO4 accounted for the changes in the functional groups ob-tained from DES on the carbon surface. To prove this,
an experiment was conducted in which pristine gra-phene was treated directly with DES 5. The FTIR spectrum of the sample that was obtained was identical to the spectrum for untreated graphene (Fig. 6). Clean-ing the surface and/or causClean-ing some deformation of the surface of the carbon may have occurred after the treat-ment with KMnO4. These changes are the keys for sur-face activation because they make the sursur-face capable of absorbing, adsorbing or desorbing functional groups. The covalent functionalization of graphene can take place in two main modes, i.e., 1) covalent bonds between free radicals or dienophiles and C=C in the skeleton of pristine graphene, and 2) covalent bonds between an or-ganic group and the oxygen-containing functional groups in graphene oxide [7]. Thus, the covalent functionalization reaction occurs as a result of forming covalent bonds with oxygen functional groups in o-Gr. Later, Raman spectros-copy, thermogravimetric analysis, and zeta potential are discussed to illustrate these points further.
a
b
Size (d.nm)
Vo
lume (
%
)
Size Distribution by Volume
Size (d.nm)
Vo
lume (
%
)
Size Distribution by Volume
[image:8.595.60.538.87.469.2]A convenient comparison between all carbon spectra was conducted, and the results are summarized in Additional file 4: Table S20 in the Supplementary Ap-pendix. Note that graphene sheets rich in oxygen-containing functional groups can be applicable in wastewater treatment, e.g., for the removal of heavy metals [46]. It has been suggested that strong surface complexes form between positive metallic ions and oxygen-containing functional groups. Thus, since most of the modified samples had oxygen on their surfaces, they may be useful in removing heavy metals from waste-water and other waste streams.
Thermal stability
In order to confirm the presence of oxygen-containing functional groups and other groups, the thermal stabilities of the graphene samples were examined using TGA and DTG.
In the following sections, samples of DES-functionalized graphene oxide are divided into four groups to facilitate their comparisons. The samples functionalized by DES 1 to 5, which were based on ChCl salt (Gr 1, 2, 3, 4, and 5), are represented in Group 1. The samples modified by DES 6 to 9, based on N,N salt (Gr 6, 7, 8, 9), are in Group 2. Gr 10, 11, 12, and 13, modified by MPB-based DES, are in Group 3. The rest of the sample were treated with natural DES 14–18 (provided in a previous study [47]), and Gr 14, 15, 16, 17, and 18 make up Group 4.
The tests were conducted in a nitrogen atmosphere. Figure 7 shows TGA and DTG curves for p-Gr and o-Gr. The figure shows that p-Gr had better thermal stability
than o-Gr and the DES-functionalized graphene samples. Total weight loss was 17% for p-Gr, which started above 500 °C. This loss corresponded to the destruction of the carbon skeleton (carbonyl/double bond) of graphene [48]. The DTG curves provided the variation in weight with time (dW/dT) and assisted in identifying the degradation steps of graphene. The peaks in the DTG curves reflect the temperature of the maximum reactive velocity. The TGA and DTG curves for DES-functionalized graphene are shown in Additional file 1: Figures S39-S56 in the Supplementary Appendix.
Based on their TGA and DTG curves, nearly all of the oxidized and DES-functionalized graphene samples were found to have three degradation steps. Therefore, Table 8 provides a general comparison of the samples to show the differences in their thermal behaviors and to confirm the addition and/or elimination of functional groups. The effect of water content was negligible since it did not exceed 0.2% of the total weight because the samples had been dried previously. The first step of degradation in o-Gr and in all of the DES-functionalized graphene samples occurred in the range of 90–280 °C. The next step began above 280 °C and continued until the temperature reached ~550 °C ± 30 °C. Then, the final degradation began until the end of the test at 1000 °C. The first and second degradations were caused by the loss of oxygen-containing functional groups or any other groups that were present [49]. The last step was nor-mally caused by the decomposition of the remaining un-stable carbon, as evidenced in previous studies for different graphene composites [50, 51].
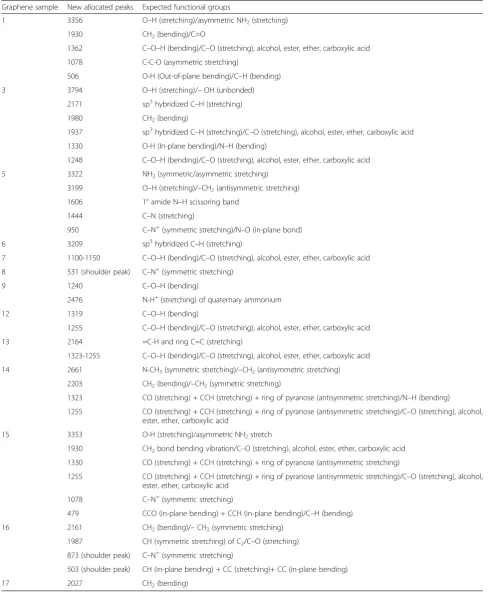
[image:9.595.58.541.86.333.2]Table 7New detected peaks in FTIR spectra of some graphene samples after DES treatment with the expected matching functional groups
Graphene sample New allocated peaks Expected functional groups
1 3356 O–H (stretching)/asymmetric NH2(stretching)
1930 CH2(bending)/C=O
1362 C–O–H (bending)/C–O (stretching), alcohol, ester, ether, carboxylic acid
1078 C-C-O (asymmetric stretching)
506 O-H (Out-of-plane bending)/C–H (bending)
3 3794 O–H (stretching)/–OH (unbonded)
2171 sp3hybridized C–H (stretching)
1980 CH2(bending)
1937 sp3hybridized C–H (stretching)/C–O (stretching), alcohol, ester, ether, carboxylic acid
1330 O-H (In-plane bending)/N–H (bending)
1248 C–O–H (bending)/C–O (stretching), alcohol, ester, ether, carboxylic acid
5 3322 NH2(symmetric/asymmetric stretching)
3199 O–H (stretching)/–CH2(antisymmetric stretching)
1606 1° amide N–H scissoring band
1444 C–N (stretching)
950 C–N+(symmetric stretching)/N–O (in-plane bond)
6 3209 sp3hybridized C–H (stretching)
7 1100-1150 C–O–H (bending)/C–O (stretching), alcohol, ester, ether, carboxylic acid
8 531 (shoulder peak) C–N+(symmetric stretching)
9 1240 C–O–H (bending)
2476 N-H+(stretching) of quaternary ammonium
12 1319 C–O–H (bending)
1255 C–O–H (bending)/C–O (stretching), alcohol, ester, ether, carboxylic acid
13 2164 =C-H and ring C=C (stretching)
1323-1255 C–O–H (bending)/C–O (stretching), alcohol, ester, ether, carboxylic acid
14 2661 N-CH3(symmetric stretching)/–CH2(antisymmetric stretching)
2203 CH2(bending)/–CH2(symmetric stretching)
1323 CO (stretching) + CCH (stretching) + ring of pyranose (antisymmetric stretching)/N–H (bending)
1255 CO (stretching) + CCH (stretching) + ring of pyranose (antisymmetric stretching)/C–O (stretching), alcohol, ester, ether, carboxylic acid
15 3353 O-H (stretching)/asymmetric NH2stretch
1930 CH2bond bending vibration/C–O (stretching), alcohol, ester, ether, carboxylic acid
1330 CO (stretching) + CCH (stretching) + ring of pyranose (antisymmetric stretching)
1255 CO (stretching) + CCH (stretching) + ring of pyranose (antisymmetric stretching)/C–O (stretching), alcohol, ester, ether, carboxylic acid
1078 C–N+(symmetric stretching)
479 CCO (in-plane bending) + CCH (in-plane bending)/C–H (bending)
16 2161 CH2(bending)/–CH2(symmetric stretching)
1987 CH (symmetric stretching) of C2/C–O (stretching)
873 (shoulder peak) C–N+(symmetric stretching)
503 (shoulder peak) CH (in-plane bending) + CC (stretching)+ CC (in-plane bending)
The rate of maximum weight loss in o-Gr within the temperature range of 90–280 °C occurred at 225 °C; how-ever, the rate decreased after DES functionalization. The second degradation was observed in various temperature ranges for the different groups of graphene samples. In Group 1 (graphene functionalized by ChCl-based DES), this range was 280–580 °C, while it was nar-rower in the other groups. The presence of oxygen-containing functional groups accounted for o-Gr’s having less thermal stability than p-Gr. Moreover, some samples showed less thermal stability than o-Gr due to the functionalization effect and the introduc-tion of new funcintroduc-tional groups, such as in Gr 1, 2, 4, 10, 13, and 17. By contrast, the total weight loss was decreased noticeably in most samples, indicating the deoxidation effect of DES as a result of the elimination of functional groups and/or their replacement with other groups from the DES source.
In the four groups that were studied, it was observed that the graphene samples treated with Gly-containing DESs had higher weight loss than others from the same group (i.e., based on same salt but different HBD). In addition, the presence of ChCl salt in the DES increased the weight loss of the treated samples to a greater extent than samples treated with DESs based on other salts. Therefore, ChCl-based DESs are considerably more ef-fective in providing a higher level of functionalization than N,N- and MPB-based DESs.
The final estimate concerning the role of DESs in eliminating and/or adding new functional groups was determined through the analysis of data from Raman, XRD, and FTIR spectroscopy as well as thermogravimet-ric results, which are discussed in the following sections.
Raman spectroscopy
Raman spectroscopy was performed to study the changes in the structure of the graphene after each treatment. The Raman spectra for each group of graphene samples were studied individually and compared with p-Gr and o-Gr. An overall comparison is provided in Additional file 5: Table S21 in the Supplementary. As was the case for the Raman spectra of graphene-based materials, the promin-ent peaks at approximately 2700 cm-1, 1580 cm-1, and 1340 cm-1refer to G′, G, and D bands, respectively. The most intense peak among all of the spectra was found for the G band, a result that was similar to that of a previous study that used the same AO-4 grade graphene nanopow-der [52]. Generally, the G band is related to sp2-bonded carbon atoms in the hexagonal lattice of the graphitic structure. However, the D band reflects the presence of defects or disorders caused by sp3 hybridized carbon in the lattice, while G′ is caused by second-order, zone-boundary phonons that are related to the assembly of the multilayers [8, 53]. The intensity ratio of ID/IGprovides an indication of degree of oxidation and/or covalent functio-nalization [7]. The appearance of the G′band (i.e., sharp or overlapped peak), intensity (relative to other bands), and frequency shifts also are important in predicting the number of layers in multi-layer graphene [54, 55].
In previous studies [8, 56, 57], the researchers stated cri-teria to predict the number of graphene layers based on the G′band. By applying the same criteria on the Raman spectrum of p-Gr in the present work (Fig. 8), the number of layers was predicted to be greater than 10. As expected, graphene oxidation led to a higher ID/IGvalue due to the deformation caused by the introduction of oxygen-containing functional groups. This deformation was not
1000 2000
3000 4000
Wavenumbers DES-treated graphene
Pristine graphene
[image:11.595.57.540.88.308.2]as significant as it was for common o-Gr produced by Hummers’method starting from graphite. The reason was the use of a non-destructive ultrasonic method in the pre-treatment and the low deformation level of p-Gr. The G′ band shifted to a lower frequency (Additional file 5: Table S21) and became sharper and more intense. These obser-vations are strong evidence of a successful oxidation process that resulted in the reduction of the particle size of the graphene and decreased the number of layers by the exfoliation effect.
Additional file 1: Figures S57-S59 in the Supplementary Appendix show the rest of the Raman spectra for Gr 6–18
arranged in groups as well as the difference in the G′ band. After treatment with DES, a high level of exfoliation was still expected in Gr 5, 7, 10, 16, 17, and 18 due to the sharp G′band compared to the band in p-Gr and the shift to lower frequencies.
Gr 18 was found to have the highest deformation level, which can be attributed to the effect of its high acidity based on ChCl:MA. However, considerable increases in ID/IG also were recorded in Gr 4, 15, 13, 8, and 10 as a result of covalent functionalization. By contrast, Gr 2, 3, 6, 7, 9, 12, 14, and 17 seemed to restore their graphitic structure by healing the defects caused after oxidation. 0 100 200 300 400 500 600 700 800 900 1000
82 84 86 88 90 92 94 96 98 100
1020 100 200 300 400 500 600 700 800 900 1000
16.886 %
W
e
ight
(
%
)
Temperature (°C)
-0.3 -0.2 -0.1 0.0 0.1
D
e
ri
va
tiv
e
W
e
ig
h
t (%
/m
in
)
a
0 100 200 300 400 500 600 700 800 900 1000 65
70 75 80 85 90 95 100
0 100 200 300 400 500 600 700 800 900 1000
21.480 % 7.400 %
3.584 %
We
ig
h
t (
%
)
Temperature (°C)
-0.3 -0.2 -0.1 0.0
D
e
ri
vat
ive W
e
ig
ht
(
%
/m
in)
b
[image:12.595.61.538.89.554.2]This case might represent a clear deoxidation effect, which was confirmed by TGA and XRD. Slight increases in ID/IG values were reported for the other samples (i.e., Gr 1, 5, 11, and 16), reflecting the simultaneous effects of functionalization and deoxidation.
Although an increased ID/IGratio is expected after oxi-dation, some researchers have reported that the reduction effect resulted in a lower ratio [58–60]. Nevertheless, it should be stated that multi-layer restacking, exfoliation, and deformation also have effects on the ratio. Exfoliation can cause a significant increase in defected sites, thus a higher ID/IGis expected. Conversely, the restacking of the graphene layers can result in a decrease in the ratio [11]. Reduction was almost always accompanied by an increased ID/IG, especially after the chemical reduction of o-Gr pro-duced by Hummers’method. However, this is in disagree-ment with other studies [61, 62].
In the case of oxidation, the ID/IGratio is increased. In contrast, this ratio could be either increased or de-creased with reduction. Two possible reduction path-ways could be proposed, i.e., 1) the decrease in ID/IG indicates the healing effects that are caused when the sp2double bonds are restored in graphene and 2) con-stant or increased ID/IG values indicate that the sp3 structure has been preserved, which could the result of
the addition of different functional groups accompanied by the reduction reaction.
[image:13.595.58.540.99.413.2]The reduction effect in this study was confirmed by the TGA and XRD results. It was assumed that a greater reduction level would be accompanied by less weight loss (from TGA) than occurred for o-Gr. However, re-duction also can occur in parallel with functionalization, i.e., replacing oxygen groups with other groups from DES. Figure 9 summarizes the information from the Raman spectra and the TGA curves for all of the treated graphene samples. The figure shows that Gr 5 had the minimum weight loss during the TGA test among the DES-treated samples. This was supported by a slight increase in ID/IG. Thus, ChCl:U was expected to produce a deoxidation ef-fect as a result of the replacement of some of the oxygen-containing functional groups with other groups from DES (as detected by FTIR spectroscopy). The alkalinity of this type of DES could be responsible for this effect, which would be in agreement with previous findings that alkaline solutions are good deoxygenating agents for o-Gr [43]. The deoxidation effect apparently was achieved for most of the DES-functionalized graphene, but it occurred at different levels. Compared to o-Gr, higher values of total weight loss and ID/IG ratio were reported for Gr 1, 4, 10, and 13, reflecting a lower level
Table 8Comparative data on graphene thermal behavior using TGA-DTG analyses
Sample 1st degradation 2nd degradation 3rd degradation Total
weight loss (%)
Remaining weight (%) Weight loss (%) Tmax
a
(°C) Weight loss (%) Tmax a
(°C) Weight loss (%) Tmax a
(°C)
p-Gr 0.000 - 0.000 - 16.886 >500 16.886 83.114
o-Gr 3.584 225 7.400 539 21.480 643 32.464 67.536
Gr-1 5.029 176 8.631 533 24.154 698 37.814 62.186
Gr-2 4.160 191 7.287 551 22.253 726 33.700 66.300
Gr-3 3.505 198 7.741 531 19.976 713 31.222 68.778
Gr-4 3.495 202 7.156 550 23.457 728 34.108 65.892
Gr-5 2.712 203 2.829 546 18.801 722 24.342 75.658
Gr-6 4.799 167 4.458 487 22.889 710 32.146 67.854
Gr-7 3.387 179 4.376 510 22.062 711 29.825 70.175
Gr-8 3.786 186 4.789 526 23.732 700 32.307 67.693
Gr-9 3.399 188 4.177 509 22.108 722 29.684 70.316
Gr-10 4.727 185 6.098 543 24.493 719 35.318 64.682
Gr-11 4.192 194 5.920 533 17.356 705 27.468 72.532
Gr-12 4.505 194 5.953 524 19.379 713 29.837 70.163
Gr-13 4.815 195 4.992 528 25.581 721 35.388 64.612
Gr-14 4.808 199 5.395 499 17.249 698 27.452 72.548
Gr-15 2.124 219 - - 28.261 720 30.385 69.615
Gr-16 3.225 203 6.187 547 17.779 713 27.191 72.809
Gr-17 4.111 189 7.627 554 22.929 722 34.667 65.333
Gr-18 2.767 211 2.900 322 23.881 729 29.548 70.452
a
500 1000 1500 2000 2500 3000
0 230 460 690 0 550 1100 1650 0 320 640 960 0 330 660 990 0 360 720 10800 100 200 300 4000 630 1260 1890
In
tens
ity
(
a.
u
)
Raman shift (cm-1) p-Gr
o-Gr
Gr 1 Gr 2 Gr 3 Gr 4
D G G'
Gr 5
a
2500 2550 2600 2650 2700 2750 2800
0 200 400 600 800 1000 1200 1400
Gr 1 Gr 3
Gr 4 Gr 5
G'
o-Gr
Gr 2
In
te
n
sity
(
a
.u
)
Raman shift (cm-1)
p-Gr
b
[image:14.595.58.543.88.682.2]of reduction than occurred in the other samples. It was anticipated that Gr 18 would undergo elimination of the functional group and deformation of its structure be-cause it presented the highest ID/IGwith a lower weight loss than o-Gr.
XRD analysis
Additional file 1: Figure S60 in the Supplementary Appendix shows the XRD patterns of p-Gr, o-Gr, and DES-functionalized graphene oxide (Gr 1–18). The peaks observed at 2θ = 26.7, 44.7, 54.7, and 77.7° in p-Gr represent the crystalline planes (002), (101), (004), and (110). This agreed with the findings of a previous study that used the same type of graphene [63]. After mild oxidation with KMnO4, a prominent diffraction peak appeared at 2θ = 11.16°, reflecting the interlayer spa-cing of 0.79 nm (according to Bragg’s law [64, 65]). The small peak at 2θ = ~26° suggests the existence of unoxidized graphene [66]. In such cases, the actual crystallinity of the graphene can be restored only after a reduction reaction [53].
Table 9 lists information related to the peaks of the (002) and (004) graphitic planes, as extracted from the XRD patterns, for all graphene samples that were studied. After the DES treatment, the exfoliation or restacking level will be greater than that of p-Gr, and it can be followed easily from the shifting in diffraction peaks (to lower or higher 2θ degrees). The emergence/dis-appearance of peaks and the decrease in their inten-sities also can be interpreted by DES functionalization role. The breadth of the (002) peak increases with the increasing number of graphitic layers per each crystal-line [67]. p-G r o-G r f-G r 1 f-G r 2 f-G r 3 f-G r 4 f-G r 5 f-G r 6 f-G r 7 f-G r 8 f-G r 9 f-G r 1 0 f-G r 1 1 f-G r 1 2 f-G r 1 3 f-G r 1 4 f-G r 1 5 f-G r 1 6 f-G r 1 7 f-G r 1 8 0.0 0.1 0.2 0.3 0.4 0.5 0.6
I
D/I
G ID/IG (Raman)
Total weight loss (TGA)
16 18 20 22 24 26 28 30 32 34 36 38 40 To ta l we ig ht lo ss ( % )
[image:15.595.66.539.89.311.2]Fig. 9Combination data of ID/IGand total weight loss in graphene samples as extracted from Raman and thermogravimetry studies
Table 9Diffraction peak information from XRD patterns of p-Gr and DES-treated graphene oxide
Sample Diffraction peak of (002) Diffraction peak of (004)
2θ(deg) Intensity 2θ(deg) Intensity
p-Gr 26.70 1682.26 54.74 97.48
Gr 1 26.65 693.40 54.72 29.00
Gr 2 26.76 859.81 54.96 55.24
Gr 3 26.55 387.27 54.70 24.99
Gr 4 26.55 387.27 54.65 30.86
Gr 5 26.53 137.47 54.68 13.03
Gr 6 26.53 216.22 54.70 13.00
Gr 7 26.72 588.45 54.86 22.99
Gr 8 26.76 937.83 54.84 43.40
Gr 9 26.74 690.84 55.00 36.15
Gr 10 26.62 257.12 54.68 14.00
Gr 11 26.84 930.79 55.04 39.39
Gr 12 26.86 525.88 54.94 37.09
Gr 13 26.87 670.58 55.04 35.05
Gr 14 26.78 375.97 54.90 22.11
Gr 15 26.94 842.81 55.04 32.99
Gr 16 26.76 672.86 54.84 45.41
Gr 17 26.72 644.28 54.82 39.03
[image:15.595.305.539.439.733.2]As shown in Additional file 1: Figure S60, all of the XRD patterns had new peaks at ~26.6°, which corre-sponds to the typical graphene diffraction peak [68]. This confirmed that a partial reduction reaction oc-curred after the DES treatment.
For Gr 1 modified by ChCl:Gly, the first peak in the XRD pattern appeared at 2θ = 18.22°, reflecting a pserved form of graphene oxide that was partially re-duced by the DES. The prominent peak at 2θ = 26.64°
was observed as an indication of the reduced form of graphene.
The intensities of the peaks of all DES-treated samples were lower than those in p-Gr. This behavior frequently has been reported to be the result of functionalization, especially when it is accompanied by peak shifting to less than 2θ degrees [69–71]. Figure 10 shows the XRD diffraction peaks in the dif-ferent functionalized groups compared to p-Gr and
o-o-Gr
p-Gr o-Gr
p-Gr
o-Gr
p-Gr
o-Gr
p-Gr
o-Gr
p-Gr
o-Gr
p-Gr
o-Gr
p-Gr
o-Gr
p-Gr
40 45 50 55 60 65 70 75 80 85
25.0 25.5 26.0 26.5 27.0 27.5 28.0
2 Theta (degree)
Gr 5
Gr 4 Gr 3
Gr 2 Gr 1
(002) (101) (004) (110)
Gr 5 Gr 4 Gr 3
Gr 2
Gr 1
Intensity
2 Theta (degree)
25.0 25.5 26.0 26.5 27.0 27.5 28.0 40 45 50 55 60 65 70 75 80 85
Intensity
2 Theta (degree) Gr 9
Gr 8 Gr 7
Gr 6
2 Theta (degree)
Gr 9
Gr 8 Gr 7 Gr 6
(002) (101) (004) (110)
25.0 25.5 26.0 26.5 27.0 27.5 28.0 40 45 50 55 60 65 70 75 80 85
Intensity
2 Theta (degree) Gr 13
Gr 12
Gr 11 Gr 10
2 Theta (degree)
Gr 13
Gr 12
Gr 11
Gr 10
(002) (101) (004) (110)
25.0 25.5 26.0 26.5 27.0 27.5 28.0 40 45 50 55 60 65 70 75 80 85
Intensity
2 Theta (degree) Gr 18 Gr 17
Gr 16 Gr 15 Gr 14
(002) (101) (004) (110)
2 Theta (degree)
Gr 18 Gr 17
[image:16.595.58.540.205.711.2]Gr 16 Gr 15 Gr 14
Gr. The peaks were compared using suitable offset values and by maintaining a constant relative intensity difference. By comparing the graphene groups, it can be concluded that treating graphene with ChCl-based DES (Group 1) leads to a graphene structure with a lower stacking form than the other groups. The dif-fraction peaks in this group were observed at lower 2θ values than p-Gr and the other treated samples. This indicated that there was a larger interlayered spacing between the sheets caused by the added func-tional groups from the DES source. However, in Group 2, the positions of the peaks were almost iden-tical to those in p-Gr (expect for Gr 7), and the structural characteristics were restored due to the re-duction effect. However, treating with MPB-based DES (Group 3) resulted in lower interlayered spacing than existed in the original p-Gr (higher 2θ values). Only Gr 10 did not experience this effect, and a slight decrease in 2θ was recorded. The same effect also was observed in Group 4, which presented a higher stacking level than p-Gr.
It can be expected that the presence of new func-tional groups from the DES sources contributed to changing the structure such that it differs from that of p-Gr. For example, if the reduction reaction took place and new hydrophobic functional groups were added, the π-π stacking between the layers would be enhanced to a higher level than the stacking in p-Gr. In contrast, the addition of hydrophilic functional groups (which replace the existing oxygen groups) would result in a lower stacking level than that of a fully-cleaned surface. To prove this, dispersibility tests were conducted in aqueous solutions. The improve-ment or deterioration in graphene dispersibility com-pared to o-Gr and p-Gr confirmed the roles of the hydrophilic or hydrophobic functional groups that possibly were attached after treatment with DES.
SEM, TEM, and particle size analyses
A few samples were selected at random for the tests to provide a general vision of the impact of DESs on the structure of graphene. Figure 11 shows FE-SEM images
a
b
[image:17.595.59.538.366.713.2]c
d
of (a) untreated graphene, (b) oxidized graphene, and graphene modified by (c) DES 5 and (d) DES 18. In Fig. 11(b), the white spots on the oxidized surface of the graphene represent the residual oxidants that can be tar-geted usefully by DES molecules. Due to the completely dry form of the samples, no considerable difference was evident in the structure of the graphene before and after treatment. However, in DES 5-functionalzed graphene (Fig. 11c), some loose stacking between the outer layers and other layers were observed. This loose arrangement of sheets is a sort of deformation of the structure that can improve the dispersibility of graphene in a water medium. Furthermore, traces of deformation obviously were found in the graphene sheets modified by DES 18 (Fig. 11(d)). Therefore, DES-based treatment can be useful for the preparation of a higher level of functio-nalization. TEM images of pristine and functionalized
graphene proved to have a higher exfoliation level of DES 1-functionalized graphene than p-Gr. A wider area of transparent graphene layers were observed after functionalization, which is a reflection of a monolayer or a double layer of graphene, while most areas of untreated graphene were found to be darker, corre-sponding to the presence of multi-layer sheets [72]. Figure 12 shows a clear single layer in the treated sam-ple, whereas a single graphene layer rarely is detected in pristine graphene.
The particle sizes of graphene modified by DES 5 and 18 were investigated similarly in p-Gr and o-Gr (Additional file 1: Figure S61). The results showed a decrease of ~50% in their average size compared to o-Gr particles. This also confirmed that the deformation of the structure was caused by serious splitting of the aggregated particles. The test may not exhibit the real
[image:18.595.59.539.317.718.2]Pristine graphene Graphene functionalized by DES 1
values for the sizes of the graphene particles, but it does provide an indication concerning the overall changes in particle size after treatment with DES.
Dispersibility and suspension stability
Tests of the dispersibility and suspension stability were conducted for the graphene samples using the same con-ditions of concentration, sonication time, and temperature (room temperature). The first dispersibility test included the preparation of graphene suspensions with relatively high concentrations, i.e., 1 mg/ml, and the test continued for 24 h. These conditions were used to accelerate the pre-cipitation, thereby expediting the comparisons of the
treated and untreated samples. Figure 13 shows that all of the graphene samples were dispersed homogeneously in water for the first 5 h, except for the samples that were functionalized with DES 3, 4, 6, and 11 (Gr 3, Gr 4, Gr 6, and Gr 11). This was because the graphene agglomeration in these four sets of samples was enhanced after treatment with DES. This confirmed the partial elimination of oxygen-containing functional groups that had been identified previously for these samples. Therefore, the hydrophilic effect of the remaining groups was at a lower level, thus causing insufficient dispersibility. After 12 h, graphene samples functionalized by DES 1, 2, 3, 4, 6, 8, 11, 14, and 16 showed a short-term stability with a
After sonication
After 5 h
After 12 h
[image:19.595.58.538.262.706.2]After 24 h
clear liquid appearance and a precipitated graphene layer at the bottom. The other samples exhibited longer stability, with the best results reported for graphene functionalized with DES 5, 7, and 9 (Gr 5, 7, 9) and for oxidized graphene (o-Gr). However, nearly all samples were fully precipitated after a settling time of 24 h. Gen-erally, the dispersibility of the functionalized graphene oxide samples was determined by using the level of de-oxidation achieved, the nature of the new functional groups, and the average size of the resulting particles.
Note that many parameters affect the duration of a stable dispersion. In a previous study on the aqueous dis-persion of graphene, Ding et al. [73] found that sonication time, temperature, and the concentration of graphene de-termined the long-term stability. Stability was achieved for a period ranging from two weeks to two months by adjusting the sonication time and temperature within the ranges 2–6 h and 160–220 °C, respectively, at concentra-tions below 1 mg/ml.
Furthermore, dispersibility in acetone was monitored for the five types of modified graphene, i.e., Gr 1–5 (Fig. 14). Dispersions were prepared at the same concen-tration of graphene that was used earlier in aqueous sus-pensions. After only 12 h, the graphene powder precipitated as a result of the chemical modification. The oxidized and functionalized graphenes (o-Gr and Gr 1 to 5) have less dispersion stability than the untreated graphene (p-Gr). Gr 5 could not be dispersed in acetone, even after sonication and hard shaking. This can be attributed to the isolation role resulting from the functional groups from ChCl:U being attached to the surface of the graphene be-cause these groups are immiscible in acetone. For the same graphene group, we also assessed the dispersibility in n-hexane as a non-polar solvent. Figure 15 shows that the stability was short-term and that full precipitation oc-curred after only 5 h. Sample Gr 5 could not be dispersed
even after 3 h of sonication. The graphene particles formed large, immiscible aggregates that precipitated at the bottom of the vial for the entire duration. This also confirmed the successful functionalization of graphene oxide. The nature of the newly-added functional groups was identical to the nature of the DES molecules. In agreement with the previous findings (FTIR and Raman spectroscopy), these functional groups contained oxygen and nitrogen, and they were chemically attached to the graphene. The high hydrophilicity of these groups pre-vented the nanosheets from scattering throughout the so-lution. Thus, they showed no affinity to be dissolved in n-hexane, which was the same as the nature of the original ChCl:U DES.
Dispersibility tests in different polar and non-polar sol-vents can be used to determine the nature of the surface and the exact hydrophilicity and hydrophobicity levels of the graphene nanosheets. The stability of the suspension in a non-polar solvent, i.e., n-hexane, was very short for the samples that were tested before and after treatment with DES. Conversely, stability in water was better for all samples, and it lasted for a longer period of time in some cases. Zhanget al.reported similar stability results in several polar solvents [74]. By treating oxidized gra-phene with IL 1-allyl-3-methylimidazolium chloride, they produced a water-soluble graphene. A dispersibility test showed that such water-soluble graphene would re-main dispersed for more than 36 h at a concentration of 1 mg/ml. By contrast, when the solvents dimethyl sulfoxide and 2-propanol were used instead of water, a black pre-cipitate was found at the bottom of the vials, reflecting lower stability levels.
In a further investigation, a suspension was made from poorly dispersed graphene in distilled water (1, 2, 3, 4, 6, 8, 11, 14, and 16). The resulting mixtures were stable for longer periods of time than other suspensions, exceeding
After sonication
After 12 h
p-Gr o-Gr Gr 1 Gr 2 Gr 3 Gr 4 Gr 5
[image:20.595.58.538.552.704.2]p-Gr o-Gr Gr 1 Gr 2 Gr 3 Gr 4 Gr 5
24 h, as shown in Fig. 16. This reflects the complicated interactions between different functionalized graphene sheets.
Solvation in water generally is caused by the hydrogen bonds between the graphene sheets and the water mole-cules [75], but when the van der Waals interaction is stronger between the sheets, their exfoliation is pre-vented. Oxygen-containing functional groups help to alter the van der Waals interactions between sheets and render them hydrophilic [76].
As mentioned before, the aim of this section was to show the differences in the behaviors of the dispersions among all of the graphene samples. The stability of their dispersion can be prolonged if various conditions, such
as sonication time, concentration, and temperature, are adjusted properly to optimum levels. Choosing a suitable type of dispersant with or without the addition of disper-sing aids also is important when stability over time is re-quired [77].
Changes in the surfaces of the graphene after treatment with DES sometimes resulted in greater decrease in the stability of the dispersions of DES-functionalized graphene than oxidized graphene due to the reduction effect. To ex-plain this behavior, a small experiment was conducted to determine how graphene particles reacted when immersed in an aqueous solution. The first moments after water was added to the graphene samples were monitored for p-Gr, o-Gr, and Gr 1 (Fig. 17). Fast agglomeration of the pristine carbon particles occurred when the water was added (Fig. 17(a)). The hydrophobic property and surface chemis-try of pristine graphene accounted for this behavior [78, 79]. By contrast, Fig. 17(b) shows that the presence of new hydrophilic groups after treatment with KMnO4led to in-stantaneous homogenization immediately after water was added to o-Gr. This phenomenon was similar to mixing water with a soluble black pigment powder, and it resulted from the higher surface energy of o-Gr [77].
[image:21.595.57.537.89.343.2]However, Fig. 17(c) shows that the graphene nano-sheets that were functionalized by DES 1 based on ChCl:Gly tended to form a transparent, silver-colored layer floating on the water/air interface. Along with the deoxidation effect, as discussed earlier, this may indi-cate a double-sided functionalization of the graphene After sonication After 12 h After 24 h
Fig. 16Suspension behavior for a mixture of poorly dispersed graphene samples (1, 2, 3, 4, 6, 8, 11, 14 and 16) in distillated water in 24 h
After sonication
After 1 h
After 5 h
p-Gr o-Gr Gr 1 Gr 2 Gr 3 Gr 4 Gr 5
p-Gr o-Gr Gr 1 Gr 2 Gr 3 Gr 4 Gr 5
[image:21.595.56.292.567.695.2]p-Gr o-Gr Gr 1 Gr 2 Gr 3 Gr 4 Gr 5
bilayer, followed by the exfoliation process between the nanosheets [49]. Eventually, this resulted in uneven levels of functionalization between the exfoliated layers. Thus, just after sonication, the layers aligned into den-dritic architectures via hydrogen bonding and the ion-dipolar interactions between the carboxyl groups and water molecules [80].
Zeta potential
[image:22.595.59.539.90.247.2]Zeta potential was measured for graphene dispersions in water (0.01 g/100 ml), and the results are presented in Fig. 18(a). The maximum enhancement in zeta potential after treatment with KMnO4was for the graphene that was functionalized by DES 5 based on ChCl:U. However, not all graphene functionalization processes led to better
Fig. 18aZeta potential results for pristine and functionalized graphene suspensions in water (0.01g/100ml),bArrangements of Zeta Potential values of all tested graphene accordingly
a- Pristine graphene b- Oxidized graphene c- Graphene 1
[image:22.595.58.539.374.703.2]dispersibility. This can be attributed to changes on the surface of the carbon after each treatment due to the manipulation of functional groups that have different hydrophilicity and hydrophobicity properties. It also confirmed the reduction effect caused by the DESs, which control the presence level of oxygen-containing functional groups in the modified samples. These groups led to electronegativity with the different values of elec-tron density responsible for the negative values of zeta potential. However, according to Riddick [81], a zeta po-tential value greater than 30 eV suggests that the solu-tion will be stable for a reasonable amount of time, and, if the value exceeds 40 eV, the solution can be consid-ered to be much more stable. Accordingly, Gr 9 and 7 are stable in a water medium, but they are not as stable as a well-dispersed functionalized graphene by DES 5. The oxidation process enhanced the stability by 21%, be-cause it helped to increase the hydrophilicity and the ex-tent of exfoliation.
Dispersibility improvements in Gr 5, 7, and 9 can be ascribed to the simultaneous functionalization and reduction effects resulting from the respective DESs. In some cases, the zeta potential values decreased after the DES treatment. However, the overall differ-ence between pristine and DES-modified graphene in-dicated substantial improvements, especially for Gr 5, 7, and 9. Treating with DES 3, 4, 6, 11, 14, and 16 changed the surface chemistry such that their disper-sion stability in water was diminished. Based on FTIR analyses of these samples, −C-H and -CH2 bonds commonly are present on the surface of the carbon in samples that have zeta potential values less than 20 eV. Hydrophobic affinity for these functional groups was anticipated to influence the solubility of graphene in water. In general, the deterioration of dis-persibility can be explained by (a) the effect of the removal of some hydrophilic functional groups from the surface of the carbon caused by the DESs, e.g., the deoxidization ef-fect mentioned earlier in Section 3.5; (b) the addition of new functional groups that could have an adverse effect on the stability of the dispersion in water; and (c) the physical adsorption of DES materials occurring on active sites on the surface of the carbon through irreversible, non-covalent modification [43], which has been reported in most studies to be the result ofπ–π stacking between the graphene plane and aromatic molecules when they are present [82]. Figure 18(b) shows the arrangement of the graphene samples, from the lowest to the highest, accord-ing to the values of their zeta potentials.
To investigate the role of DES and the prior treat-ment with KMnO4 further, pristine graphene flakes were treated directly with some types of DES without prior purification. For the flakes treated with DES 1 and DES 5, there were no changes in the values of
the zeta potentials. This is also in accordance with the FTIR results, which confirmed the need for pre-treatment with KMnO4.
Modified graphene can be produced and used in various functional applications. Graphene with more hydrophobic affinity can be used as additives in polymer-based com-posites [83]. In addition, all of the functionalized samples may be used in selective sorption applications, especially of positively-charged metallic ions.
Conclusions
The use of DESs as functionalizing agents for graphene-based materials was investigated on graphene oxide. Chemical changes on the surface of the graphene were studied using FTIR spectra. The thermal stability ob-tained from simultaneous TGA/DTG analyses showed various stability changes when compared with pristine and oxidized graphene. Raman spectroscopy and XRD results also identified chemical and structural changes. Different levels of reduction were achieved after DES treatment, and simultaneous functionalization/reduction was reported in some cases. Further investigations of the structural changes were performed using SEM, TEM, and particle size analyses. The dispersibility of the treated gra-phene also was assessed and characterized based on zeta potential values. The results provided convincing indica-tion of the changes on surface chemistry that occurred after DES treatment. However, considerable improvements in the dispersion stability of the graphene/water systems were recorded for graphene treated with DES 5, 7, and 9 compared to graphene oxide. The introduction of new hydrophilic functional groups was responsible for this be-havior. The different reducing abilities of the DESs used were responsible for the different levels of agglomeration during the dispersibility tests. However, each modification process was an independent case that could be interpreted based on various aspects. The as-functionalized graphene may have different electrical, mechanical, or optical proper-ties than the original pristine graphene. Thus, it is import-ant to extend this study and test the functionalized graphene in various potential applications.
Additional files
Additional file 1: Figures S1-S61.FTIR spectra of DESs and their individual components as well as DES-modified graphene oxide, TGA/ DTG curves for DES-functionalized graphene oxide (Gr 1–18), Raman Spectra (for Gr 6–18), XRD patterns (Gr 1–18) and particle size distribution (Gr 5 and Gr 18).
Additional file 2: Tables S1-S18.Detected peaks form FTIR spectra for DESs and their individual components.
Additional file 4: Table S20.Comparison between FTIR spectra of all graphene samples showing the appearance/disappearance of peaks after each treatment.
Additional file 5: Table S21.Description of data: Extracted information from Raman spectra of pristine, oxidized and DES-functionalized graphene oxide.
Competing interests
The authors declare that they have no competing interests.
Authors’contributions
MH initiated the idea and conceived of the study. MH, MAA planned and designed the experimental methodology. AA carried out the experiments. MH, AA, MAA, MAH contributed in the characterization and analysis of results. All authors read and approved the final manuscript.
Acknowledgments
The authors would like to express their thanks to University of Malaya HIR-MOHE (D000003-16001) and University of Malaya Centre for Ionic Liquids (UMCiL) for their support to this research.
Author details
1
University of Malaya Centre for Ionic Liquids (UMCiL), University of Malaya, Kuala Lumpur 50603, Malaysia.2Department of Civil Engineering, University of Malaya, Kuala Lumpur 50603, Malaysia.3Department of Chemical Engineering, University of Malaya, Kuala Lumpur 50603, Malaysia. 4
Nanotechnology & Catalysis Research Centre (NANOCAT), University of Malaya, Kuala Lumpur 50603, Malaysia.
Received: 5 December 2014 Accepted: 6 July 2015
References
1. Weiss NO, Zhou H, Liao L, Liu Y, Jiang S, Huang Y, et al. Graphene: an emerging electronic material. Adv Mater. 2012;24(43):5782–825. doi:10.1002/ adma.201201482.
2. Shao Y, Wang J, Wu H, Liu J, Aksay IA, Lin Y. Graphene based electrochemical sensors and biosensors: a review. Electroanalysis. 2010;22(10):1027–36. doi:10.1002/elan.200900571.
3. Singh V, Joung D, Zhai L, Das S, Khondaker SI, Seal S. Graphene based materials: Past, present and future. Prog Mater Sci. 2011;56(8):1178–271. doi:http://dx.doi.org/10.1016/j.pmatsci.2011.03.003.
4. Jariwala D, Sangwan VK, Lauhon LJ, Marks TJ, Hersam MC. Carbon nanomaterials for electronics, optoelectronics, photovoltaics, and sensing. J Agric Food Chem. 2013;42(7):2824–60. doi:10.1039/C2CS35335K. 5. Li D, Muller MB, Gilje S, Kaner RB, Wallace GG. Processable aqueous
dispersions of graphene nanosheets. Nat Nano. 2008;3(2):101–5. doi:10.1038/nnano.2007.451.
6. Shan C, Yang H, Han D, Zhang Q, Ivaska A, Niu L. Water-soluble graphene covalently functionalized by biocompatible poly-l-lysine. Langmuir. 2009;25(20):12030–3. doi:10.1021/la903265p.
7. Georgakilas V, Otyepka M, Bourlinos AB, Chandra V, Kim N, Kemp KC, et al. Functionalization of graphene: covalent and Non-covalent approaches, derivatives and applications. Chem Rev.
2012;112(11):6156–214. doi:10.1021/cr3000412.
8. Zhu Y, Murali S, Cai W, Li X, Suk JW, Potts JR, et al. Graphene and graphene oxide: synthesis, properties, and applications. Adv Mater. 2010;22(35):3906–24. doi:10.1002/adma.201001068.
9. Zhu C, Guo S, Fang Y, Dong S. Reducing sugar: New functional molecules for the green synthesis of graphene nanosheets. ACS Nano. 2010;4(4):2429–37. doi:10.1021/nn1002387.
10. Si Y, Samulski ET. Synthesis of water soluble graphene. Nano Lett. 2008;8(6):1679–82. doi:10.1021/nl080604h.
11. Dreyer DR, Park S, Bielawski CW, Ruoff RS. The chemistry of graphene oxide. Chem Soc Rev. 2010;39(1):228–40. doi:10.1039/B917103G.
12. Sun J, Meng D, Jiang S, Wu G, Yan S, Geng J, et al. Multiple-bilayered RGO-porphyrin films: from preparation to application in
photoelectrochemical cells. J Mater Chem. 2012;22(36):18879–86. doi:10.1039/C2JM33900E.
13. Sun J, Xiao L, Meng D, Geng J, Huang Y. Enhanced photoresponse of large-sized photoactive graphene composite films based on water-soluble conjugated polymers. Chem Commun. 2013;49(49):5538–40. doi:10.1039/ C3CC40563J.
14. Meng D, Yang S, Sun D, Zeng Y, Sun J, Li Y, et al. A dual-fluorescent composite of graphene oxide and poly(3-hexylthiophene) enables the ratiometric detection of amines. Chem Sci. 2014;5(8):3130–4. doi:10.1039/C4SC00598H.
15. Meng D, Yang S, Guo L, Li G, Ge J, Huang Y, et al. The enhanced photothermal effect of graphene/conjugated polymer composites: photoinduced energy transfer and applications in photocontrolled switches. Chem Commun. 2014;50(92):14345–8. doi:10.1039/C4CC06849A. 16. Martinez M, Callejas M, Benito A, Cochet M, Seeger T, Anson A, et al.
Modifications of single-wall carbon nanotubes upon oxidative purification treatments. Nanotechnology. 2003;14(7):691.
17. Wasserscheid P, Welton T. Ionic liquids in synthesis, Wiley Online Library. 2008. 18. Hayyan M, Mjalli FS, Hashim MA, AlNashef IM, Al-Zahrani SM, Chooi
KL. Generation of superoxide ion in 1-butyl-1-methylpyrrolidinium trifluoroacetate and its application in the destruction of chloroethanes. J Mol Liq. 2012;167(0):28–33. doi:http://dx.doi.org/10.1016/
j.molliq.2011.12.005.
19. Zhao L, Zhao F, Zeng B. Preparation and application of sunset yellow imprinted ionic liquid polymer−ionic liquid functionalized graphene composite film coated glassy carbon electrodes. Electrochim Acta. 2014;115(0):247–54. doi:http://dx.doi.org/10.1016/j.electacta.2013.10.181. 20. Chai J, Li F, Hu Y, Zhang Q, Han D, Niu L. Hollow flower-like AuPd alloy
nanoparticles: One step synthesis, self-assembly on ionic
liquid-functionalized graphene, and electrooxidation of formic acid. J Mater Chem. 2011;21(44):17922–9. doi:10.1039/C1JM13631C.
21. Abbott AP, Capper G, Davies DL, Rasheed RK, Tambyrajah V. Novel solvent properties of choline chloride/urea mixtures. Chem Commun. 2003;1:70–1. doi:10.1039/B210714G.
22. Zhang Q, De Oliveira VK, Royer S, Jerome F. Deep eutectic solvents: syntheses, properties and applications. Chem Soc Rev. 2012;41(21):7108–46. doi:10.1039/C2CS35178A.
23. Hayyan M, Hashim MA, Hayyan A, Al-Saadi MA, AlNashef IM, Mirghani MES, et al. Are deep eutectic solvents benign or toxic? Chemosphere. 2013;90(7):2193–5. doi:http://dx.doi.org/10.1016/j.chemosphere.2012.11.004. 24. Hayyan M, Hashim MA, Al-Saadi MA, Hayyan A, AlNashef IM, Mirghani MES.
Assessment of cytotoxicity and toxicity for phosphonium-based deep eutectic solvents. Chemosphere. 2013;93(2):455–9. doi:http://dx.doi.org/ 10.1016/j.chemosphere.2013.05.013.
25. Hayyan M, Looi CY, Hayyan A, Wong WF, Hashim MA. In vitro and in vivo toxicity profiling of ammonium-based deep eutectic solvents. PLoS ONE. 2015;10(2), e0117934. doi:10.1371/journal.pone.0117934.
26. Abo-Hamad A, Hayyan M, AlSaadi MA, Hashim MA. Potential applications of deep eutectic solvents in nanotechnology. Chem Eng J. 2015;273(0):551–67. doi:http://dx.doi.org/10.1016/j.cej.2015.03.091. 27. Abbott AP, Boothby D, Capper G, Davies DL, Rasheed RK. Deep Eutectic
Solvents Formed between Choline Chloride and Carboxylic Acids: Versatile Alternatives to Ionic Liquids. J Am Chem Soc. 2004;126(29):9142–7. doi:10.1021/ja048266j.
28. Paredes JI, Villar-Rodil S, Martínez-Alonso A, Tascón JMD. Graphene oxide dispersions in organic solvents. Langmuir. 2008;24(19):10560–4. doi:10.1021/la801744a.
29. Rani S, Kumar M, Kumar R, Kumar D, Sharma S, Singh G. Characterization and dispersibility of improved thermally stable amide functionalized graphene oxide. Mater Res Bull. 2014;60(0):143–9. doi:http://dx.doi.org/ 10.1016/j.materresbull.2014.07.019.
30. Smith BC. Infrared spectral interpretation: a systematic approach. CRC press; 1998.
31. Park J, Oh K, Choi H-M. Preparation and characterization of cotton fabrics with antibacterial properties treated by crosslinkable benzophenone derivative in choline chloride-based deep eutectic solvents. Cellulose. 2013;20(4):2101–14. doi:10.1007/s10570-013-9957-8.
32. Petibois C, Rigalleau V, Melin A-M, Perromat A, Cazorla G, Gin H, et al. Determination of glucose in dried serum samples by Fourier-transform infrared spectroscopy. Clin Chem. 1999;45(9):1530–5.