0095-1137/97/$04.00
1
0
Copyright © 1997, American Society for Microbiology
Effects of Storage Temperature and Time on Qualitative and
Quantitative Detection of Cytomegalovirus in Blood Specimens
by Shell Vial Culture and PCR
THOMAS C. ROBERTS,
1RICHARD S. BULLER,
2MONIQUE GAUDREAULT-KEENER,
2KARA E. STERNHELL,
2KATHRYN GARLOCK,
3GARY G. SINGER,
3DANIEL C. BRENNAN,
3ANDGREGORY A. STORCH
1,2*
Divisions of Infectious Diseases
1and Nephrology,
3and Departments of Internal Medicine and Pediatrics,
2Washington University School of Medicine, St. Louis, Missouri 63110
Received 31 January 1997/Returned for modification 13 March 1997/Accepted 23 May 1997
Cytomegalovirus (CMV) infectious titers and DNA levels were determined by quantitative shell vial culture
and quantitative-competitive PCR with blood samples from 10 renal transplant recipients with active CMV
infection. Blood samples were stored at either room temperature or 4°C and were processed at intervals of 0,
6, 24, 48, and 72 h. All samples were culture and PCR positive at baseline. Whereas the sensitivity of shell vial
culture progressively declined, with only 55% positive at 24 h and 10% positive at 48 h, all samples remained
PCR positive at all time points. Furthermore, the infectious titer diminished by 83 to 91% by 24 h compared
to that at baseline (
P
< 0.0001), but quantitative DNA levels did not decline over time. Storage temperature
had no significant effect on either infectious titer or DNA levels.
Cytomegalovirus (CMV) is a major cause of morbidity and
mortality in immunocompromised hosts (11). Several
tech-niques are used to detect and quantitate CMV from blood to
diagnose and predict the presence of clinical disease. Blood
samples, however, are often stored or transported to a
refer-ence virology laboratory, resulting in a delay of 1 to 2 days or
more prior to specimen processing and testing. It has been
shown that storage time and temperature affect the
measure-ments of antigenemia levels and infectivity to various degrees
(1, 7, 14–16, 18). This study was performed to examine the
effects that storage temperature and sample processing time
have on the detection of CMV in blood samples by shell vial
culture (SVC) and PCR.
MATERIALS AND METHODS
Specimen processing.This study was approved by the Human Studies Com-mittee at Washington University. Blood samples were collected from 10 renal transplant recipients who were CMV seropositive and who were suspected of having CMV viremia. From each patient, 20 ml of whole blood was collected in EDTA-containing tubes (Vacutainer; Becton Dickinson, Rutherford, N.J.) at Washington University Medical Center, and the tubes were transported imme-diately to the Virology Laboratory, where each sample was divided into 2-ml aliquots. One aliquot was processed immediately (time zero), and the other aliquots were stored at either 4°C or room temperature (RT) prior to processing. Two aliquots, one stored at 4°C and one stored at RT, were then processed after 6, 24, 48, or 72 h of storage. Sample processing involved leukocyte isolation by dextran sedimentation, erythrocyte lysis, and washing of cells as described pre-viously (4). The leukocyte concentration from the preparations was adjusted to between 1.23106
and 23106
cells per ml. From each cell suspension, a lysate was made by centrifuging 1.03106
cells at 14,0003gfor 1 min, resuspending the pellet in 40ml of 0.04 M NaOH, and boiling for 10 min, followed by the addition of 40ml of 0.1 M Tris (pH 7.6).
Quantitative SVC.From each leukocyte suspension, 0.25 ml was inoculated into each of two SVCs containing MRC-5 human embryonic fibroblasts (ViroMed, Minnetonka, Minn.). The shell vial assay was performed as de-scribed previously (4), except that immunofluorescent-antibody staining was per-formed with a different monoclonal antibody specific for the CMV immediate-early antigen (Chemicon International, Temecula, Calif.) because it gave a
stronger signal and an approximately 10% higher sensitivity (unpublished data). The number of infectious centers from each pair of cultures was normalized to 105leukocytes and averaged, and the results were expressed as infectious centers per 105leukocytes.
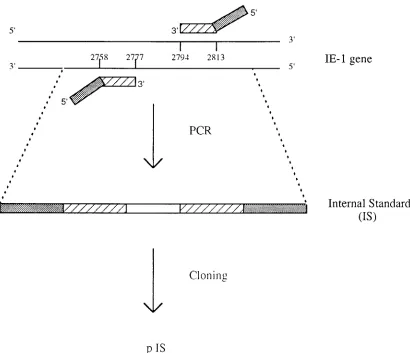
Plasmid construction.External target (ET) and internal standard (IS) se-quences were derived from the sequence of the human CMV major immediate-early 1 gene (IE-1) (5) and were subcloned into plasmids (pET and pIS, respec-tively). pET was constructed by amplification of a 147-bp product by the assay described by Jiwa et al. (12) and was inserted into the lacZregion of the pGEM-5z vector (Promega, Madison, Wis.) according to the instructions of the manufacturer (TA Cloning Kit; Invitrogen, San Diego, Calif.). The IS was a 96-bp construct with G1C content similar to that of the ET. The IS was con-structed by using primers whose 59ends matched the primers used to amplify the ET and whose 39ends spanned a separate 56 bp segment of the IE-1 gene (Fig. 1). The sequences of these composite primers were 59 -AGCTGCATGATGT-GAGCAAGCCTGAGGTTATCAGTGTAA-39 and 59 -GAAGGCTGAGT-TCTTGGTAAAGACCTTCATGCAGATCTCC-39, with the 39 ends (under-lined) corresponding to the regions at positions 2758 to 2777 and 2813 to 2794 of the IE-1 gene (GenBank accession no. HS5MIEG), respectively. Amplification of the IS product was performed with a 100-ml reaction mixture containing 10 mM Tris-HCl (pH 8.3), 50 mM KCl, 1.5 mM MgCl2, 0.001% (wt/vol) gelatin, 0.2 mM (each) deoxynucleoside triphosphate, 50 pmol of each primer, and 2 U of AmpliTaq DNA polymerase (Perkin-Elmer Cetus, Branchburg, N.J.). The PCR protocol consisted of denaturation for 5 min at 94°C, followed by 32 cycles of denaturation at 94°C for 30 s, primer annealing at 46°C for 30 s, and extension at 65°C for 30 s, followed by a final extension for 10 min at 65°C. The product was subcloned into the pGEM-5z vector as described above. Both pET and pIS were transformed into competent DH5acells, purified by a silica column process according to the instructions of the manufacturer (Qiagen Midi-Plasmid Purifi-cation Kit; Qiagen, Chatsworth, Calif.), and quantitated by spectrophotometry (DU650; Beckman Instruments, Fullerton, Calif.).
DNA amplification and quantitation.CMV DNA levels were measured by a quantitative-competitive PCR assay (QC-PCR) similar to those described pre-viously (2, 9, 20, 23). QC-PCR was performed with lysates of 106cell equivalents from each processed blood sample. A master mixture containing all of the reagents except the patient sample was made prior to distribution to the indi-vidual PCR tubes. Each PCR tube contained a 100-ml volume including 8ml of lysate (105cell equivalents), 10 mM Tris-HCl (pH 8.3), 1.5 mM MgCl
2, 25 mM KCl, 0.2 mM (each) deoxynucleoside triphosphate, 75 pmol of each primer (12), 750 copies of pIS, and 2 U of AmpliTaq Gold DNA polymerase (Perkin-Elmer Cetus). Amplification was performed by using the following conditions: enzyme heat activation for 10 min at 94°C, followed by 37 cycles of denaturation at 94°C for 30 s, primer annealing at 58°C for 30 s, and extension at 72°C for 30 s. The reaction was completed with a 10-min extension at 72°C. Each run contained a negative control plus the internal standard, which served as a control for the absence of PCR inhibition. The techniques suggested by Kwok and Higuchi (13) were followed to avoid false-positive results.
Standard curve.To quantitate the viral load, a standard curve was generated for each amplification run in a way similar to that described previously (2, 9, 20,
* Corresponding author. Mailing address: Department of Pediatrics,
St. Louis Children’s Hospital, Washington University School of
Med-icine, One Children’s Place, St. Louis, MO 63110. Phone: (314)
454-6079. Fax: (314) 454-2274. E-mail: [email protected].
2224
on May 15, 2020 by guest
http://jcm.asm.org/
23). The standard curves were produced by amplifying 50, 100, 500, 1,000, 5,000, 10,000, and 50,000 copies of pET, each with 750 copies of pIS. pIS was included in the master mixture to ensure a homogeneous distribution in each PCR tube. Additionally, leukocyte DNA from a CMV-seronegative person was added to the standard curve master mixture at a concentration that yielded 105
cell equiva-lents per reaction tube. After amplification as described above, the products were electrophoresed at 200 V for 1 h through a 3% agarose gel containing 0.5mg of ethidium bromide per ml and were visualized under UV illumination with a digital imaging system (IS-1000; Alpha Innotech Co., San Leandro, Calif.) which provided a measure of the fluorescence intensities of the bands representing the amplified target and standard.
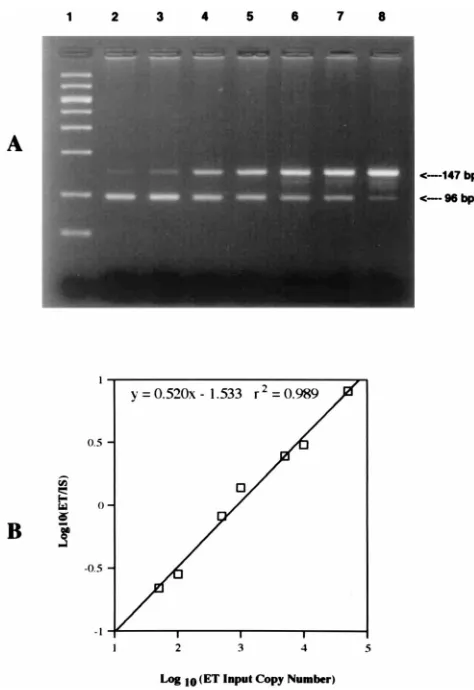
A standard curve was constructed for each amplification run by plotting the log of the ratio of the pET copy number/pIS copy number versus the log of the input pET copy number (Fig. 2). The QC-PCR assay reliably detected as few as 50 copies, and as many as 50,000 copies of the CMV IE-1 gene coamplified with 750 copies of pIS in the presence of DNA from 105
leukocytes. Detection of fewer than 50 copies or more than 50,000 copies of target DNA was unreliable and would result in values outside the linear range of the assay. If a copy number greater than 50,000 was obtained, the sample was diluted 1:10 and was retested to fit the linear range of the curve. On the basis of a total of 18 separate standard curve runs, the assay yielded a total variability of 38% for a target copy number of 10,000 and 68% for a copy number of 100. All of the samples from each patient were batched together in the same run to minimize interassay variability. Statistics.Data were analyzed by Student’s two-tailed pairedttest by using Statview, version 4.01 (Abacus, Berkely, Calif.). Data are expressed as means6 standard errors of the means.
RESULTS
Qualitative results.
All 10 specimens were positive by SVC and
PCR at baseline (Table 1). After storage at 4°C, six of eight
aliquots (75%) were still SVC positive at 6 h, 5 of 10 (50%) were
positive at 24 h, 1 of 10 (10%) was positive at 48 h, and 1 of 10
(10%) was positive at 72 h. After storage at RT, 6 of 8 (75%) were
still SVC positive at 6 h, 6 of 10 (60%) were positive at 24 h, 1 of
10 (10%) was positive at 48 h, and 0 of 10 (0%) was positive at
72 h. There was no significant difference in detection between
specimens stored at 4°C and RT. In contrast, all aliquots
re-mained PCR positive at all time points after storage at either
temperature. PCR and SVC results for two of the patients at the
6-h time point were unavailable because the samples were
inad-vertently processed at the wrong time.
Quantitative results.
At baseline there was a mean of 1.54
6
0.50 infectious centers/10
5leukocytes by quantitative SVC
(QSVC) and a mean DNA copy number of 26,807
6
18,978
CMV genomes/10
5leukocytes by QC-PCR. The number of
infectious centers and the copy number at each time point were
expressed as the mean percentage of baseline value and are
presented in Fig. 3. Storage temperature had no significant
effect on viral load, as measured by either QSVC or QC-PCR
at any of the time points. Compared to the titer at baseline,
stored samples had an 83 to 91% reduction in viral titer at 24 h,
as measured by QSVC (P
,
0.0001), and a 100% decrease by
48 h (P
,
0.0001). In contrast, no significant differences in the
mean change from baseline DNA levels were detected by
QC-PCR at any time point (Fig. 3B). Interestingly, all mean DNA
values were higher than the baseline values for both
temper-atures. These differences from the baseline were not
statisti-FIG. 1. Illustration of pIS construction. The primers were used to amplify the 96-bp IS. The 39ends of the primers (dashed bars) correspond to bases 2758 to 2777 and 2794 to 2813 of the IE-1 gene. The 59ends of the primers (solid bars) have the same sequences as the primers that are used to amplify the external target.
V
OL. 35, 1997
STORAGE TIME AND TEMPERATURE EFFECTS ON CMV DETECTION
2225
on May 15, 2020 by guest
http://jcm.asm.org/
[image:2.612.102.512.68.421.2]cally significant, although the difference between 6 h and the
baseline was of borderline significance (P
5
0.07 for RT;
P
5
0.18 for 4°C).
DISCUSSION
This study has important implications for diagnosis and
monitoring of CMV infection in the clinical setting. Following
[image:3.612.57.294.66.411.2]organ transplantation, patients are often far from reference
virology laboratories, and consequently, blood specimens
sub-mitted for monitoring of CMV infection must be transported
prior to specimen processing. In a recent study of CMV
infec-tion after renal transplantainfec-tion (3), we discovered that fewer
than 1% of specimens submitted were positive for CMV by
shell vial or conventional tube culture when there was a delay
in specimen processing of 24 h or more, whereas 46% were
positive when the delay was less than 24 h. In contrast, 91 to
100% of samples remained PCR positive regardless of whether
they were processed before or after 24 h. In the present study
we have confirmed that the CMV infectious titer declines
FIG. 2. Example of a standard curve for QC-PCR assay for CMV. (A) Aga-rose gel electrophoresis of QC-PCR amplification products stained with ethidium bromide and visualized under UV illumination. Lane 1, molecular weight markers; lanes 2 to 8, input number of 750 copies of the plasmid con-taining the IS and increasing input numbers of the plasmid concon-taining the ET DNA: lane 2, 50 ET copies; lane 3, 100 ET copies; lane 4, 500 ET copies; lane 5, 1,000 ET copies; lane 6, 5,000 ET copies; lane 7, 10,000 ET copies; and lane 8, 50,000 ET copies. (B) A standard curve was constructed for each amplification run by measuring the fluorescence intensity of the amplified ET and IS bands and plotting the log of the ratio of the ET copy number/IS copy number versus the log of the input ET copy number.
[image:3.612.315.551.68.561.2]FIG. 3. Mean6standard error of the mean percent baseline of CMV infec-tious titer (A) and DNA levels (B) for samples stored at RT (h) and 4°C ({).
TABLE 1. Qualitative SVC and PCR results after storage at 4°C
and RT
Test
No. of samples positive
Baseline (time zero)
6 ha 24 h 48 h 72 h
RT 4°C RT 4°C RT 4°C RT 4°C
SVC
10
6
6
6
5
1
1
0
1
PCR
10
8
8
10
10
10
10
10
10
aResults for two of the specimens are not available.
on May 15, 2020 by guest
http://jcm.asm.org/
[image:3.612.58.299.646.717.2]markedly by 24 h in samples stored at either RT or 4°C, and
consequently, the ability to detect CMV by SVC declines
dra-matically when sample processing is delayed. In contrast, PCR
results were unaffected by delays in processing for up to 72 h.
Although the presence of CMV in blood can be detected by
culture, antigenemia assays, or PCR, the relative roles of these
techniques are still being defined. We suggest that when there
is a delay in specimen processing, the stability of the analyte is
an important parameter for judging the relative merits of the
assays. Few previous studies have examined the effects of
stor-age time and temperature on the ability to detect CMV by
culture from blood samples. Dworkin et al. (7) found that
blood samples stored at 4°C under blood bank conditions had
a marked decline in culture positivity after 5 days of storage.
Analysis of a small number of samples indicated that two of
five samples that were positive at baseline were negative after
2 days of storage and that four of six were negative after 3 days.
Likewise, Landry et al. (14) found that infectivity declined after
1 day of storage at 4°C.
The stability of pp65 antigenemia has been addressed in
several studies (1, 14, 16, 18). Boeckh et al. (1) studied the
effect of storing blood samples for 24 h at either RT or 4°C and
found mean reductions of CMV antigen-positive cells from the
baseline of 44 and 62%, respectively. The difference in results
between the two temperatures was not significant. In another
study by Landry et al. (16), blood samples were stored at either
RT or 4°C and were processed at 1- and 2-day intervals. There
was a 52 to 55% decline in the number of CMV
antigen-positive neutrophils at day 1 for both temperatures. Samples
processed on day 2 and stored at RT showed a significantly
greater decline in terms of the numbers of antigen-positive
cells (81% reduction from the baseline), but samples stored at
4°C showed no further reduction. In another study (14), blood
samples were stored at 4°C and were processed on days 0, 1,
and 2. The qualitative sensitivity of CMV detection by
anti-genemia remained stable after 2 days, but quantitative levels
declined over the 2-day period. In contrast, Niubo et al. (18)
found that the quantitative results of the antigenemia assay did
not decline significantly after 24 h of storage. It should be
noted that none of these studies compared quantitative culture
to the antigenemia assay.
The ability to clone DNA from extinct animals (10) and
Egyptian mummies (19) suggests that DNA may be stable over
extended periods under adverse conditions. The relationship
between these findings and the ability to detect specific PCR
targets after storage is variable. In recent studies DNA was
qualitatively detectable from either cerebrospinal fluid (22) or
peripheral blood leukocytes (8) for up to 30 days of storage at
room, refrigerator, and freezing temperatures. However, other
studies have found decreased DNA yields from blood samples
stored at RT or higher temperatures (6, 17, 21). In the present
study, we found no decrease in the ability to detect a specific
PCR target in samples stored for up to 72 h at either RT or
4°C, and the quantitative assay indicated no decline in the level
of the specific PCR target.
Should quantitative testing of CMV become necessary in
clinical practice, the stability of the analyte would become even
more important than its importance for qualitative assays.
From previous studies it appears that, on the basis of specimen
stability, the antigenemia assay is preferable to culture,
al-though storage may also compromise quantitative pp65
detec-tion. We have shown, however, that DNA levels remain stable
through various storage times and temperatures, suggesting an
advantage in stability for assays that measure DNA rather than
either pp65 antigenemia or infectivity. Future studies will need
to be performed to compare directly the use of PCR against
the antigenemia assay to confirm this conclusion.
In summary, we recommend that if a delay of 24 h or more
prior to specimen processing is anticipated, culture should not
be used to detect or quantitate CMV. PCR is much less
af-fected by a delay in specimen processing, and it appears that
samples can be transported or stored at RT without adversely
affecting the results of PCR. However, further studies should
be performed with a larger number of clinical specimens under
conditions which more closely stimulate those of actual
spec-imen transport before a final recommendation can be made
concerning optimal conditions of transport of blood samples
used for PCR assays.
ACKNOWLEDGMENTS
We thank the Children’s Hospital Virology staff for technical
assis-tance with specimen processing.
This work has been supported in part by a grant from the Missouri
Kidney Foundation.
REFERENCES
1.Boeckh, M., P. M. Woogerd, T. Stevens-Ayers, C. G. Ray, and R. A. Bowden. 1994. Factors influencing detection of quantitative cytomegalovirus antigen-emia. J. Clin. Microbiol.32:832–834.
2.Boivin, G., C. A. Olson, M. R. Quirk, S. M. St-Cyr, and M. C. Jordan.1995. Quantitation of human cytomegalovirus glycoprotein H in cells using com-petitive PCR and a rapid fluorescence-based detection system. J. Virol. Methods51:329–342.
3.Brennan, D. C., K. A. Garlock, B. A. Lippmann, R. S. Buller, M. Gaudreault-Keener, J. A. Lowell, S. B. Miller, S. Shenoy, T. K. Howard, and G. A. Storch. 1997. Control of cytomegalovirus-associated morbidity in renal transplant patients using intensive monitoring and preemptive or deferred therapy. J. Am. Soc. Nephrol.8:118–125.
4.Buller, R. S., T. C. Bailey, N. A. Ettinger, M. Keener, T. Langlois, J. P. Miller, and G. A. Storch.1992. Use of a modified shell vial technique to quantitate cytomegalovirus viremia in a population of solid-organ transplant recipients. J. Clin. Microbiol.30:2620–2624.
5.Chou, S.1992. Effect of interstrain variation on diagnostic DNA amplifica-tion of the cytomegalovirus major immediate-early gene region. J. Clin. Microbiol.30:2307–2310.
6.Cushwas, W. T., and J. F. Medrano.1993. Effects of time and temperature on DNA yield and quality. BioTechniques14:204–207.
7.Dworkin, R. J., W. L. Drew, R. C. Miner, S. Mehalko, C. Evans, and R. Baxter.1990. Survival of cytomegalovirus in viremic blood under blood bank storage conditions. J. Infect. Dis.161:1310–1311.
8.Farkas, D. H., A. M. Drevon, F. L. Kiechle, R. G. Dicarlo, E. M. Heath, and D. Crisan.1996. Specimen stability of DNA-based diagnostic testing. Diagn. Mol. Pathol.5:227–235.
9.Gerna, G., M. Furione, F. Baldanti, and A. Sarasini.1994. Comparative quantitation of human cytomegalovirus DNA in blood leukocytes and plasma of transplant and AIDS patients. J. Clin. Microbiol.32:2709–2717. 10. Higuchi, R., B. Bowman, M. Freiberg, O. A. Ryder, and A. C. Wilson.1984.
DNA sequences from the quagga, an extinct member of the horse family. Nature312:282–284.
11. Ho, M.1991. Cytomegalovirus infection and indirect sequelae in the immu-nocompromised transplant patient. Transplant. Proc.23:2–7.
12. Jiwa, N. M., G. W. Van Gemert, A. K. Raap, F. M. Van de Rijke, A. Mulder, P. F. Lens, M. M. Salimans, F. E. Zwaan, W. Van Dorp, and M. Van der Ploeg.1989. Rapid detection of human cytomegalovirus DNA in peripheral blood leukocytes of viremic transplant recipients by the polymerase chain reaction. Transplantation48:72–76.
13. Kwok, S., and R. Higuchi.1989. Avoiding false positive results with PCR. Nature339:237–238.
14. Landry, M. L., S. Cohen, and K. Huber.1997. Comparison of EDTA and acid-citrate-dextrose collection tubes for detection of cytomegalovirus anti-genemia and infectivity in leukocytes before and after storage. J. Clin. Mi-crobiol.35:305–306.
15. Landry, M. L., and D. Ferguson.1993. Comparison of quantitative cytomeg-alovirus antigenemia assay with culture methods and correlation with clinical disease. J. Clin. Microbiol.31:2851–2856.
16. Landry, M. L., D. Ferguson, S. Cohen, K. Huber, and P. Wetherill.1995. Effect of delayed specimen processing on cytomegalovirus antigenemia re-sults. J. Clin. Microbiol.33:257–259.
17. Madisen, L., D. I. Hoar, C. D. Holroyd, M. Crisp, and M. E. Hodes.1987. DNA banking: the effects of storage of blood and isolated DNA on the integrity of DNA. Am. J. Med. Genet.27:379–390.
V
OL. 35, 1997
STORAGE TIME AND TEMPERATURE EFFECTS ON CMV DETECTION
2227
on May 15, 2020 by guest
http://jcm.asm.org/
18. Niubo, J., J. L. Perez, A. Carvajal, C. Ardanuy, and R. Martin.1994. Effect of delayed processing of blood samples on performance of cytomegalovirus antigenemia assay. J. Clin. Microbiol.32:1119–1120.
19. Paabo, S.1985. Molecular cloning of ancient Egyptian mummy DNA. Na-ture314:644–645.
20. Secchiero, P., D. Zella, R. W. Crowley, R. C. Gallo, and P. Lusso.1995. Quantitative PCR for human herpesviruses 6 and 7. J. Clin. Microbiol. 33:2124–2130.
21. Towne, B., and E. J. Devor.1990. Effect of storage time and temperature on DNA extracted from whole blood samples. Hum. Biol.62:301–306. 22. Wiedbrauk, D. L., and W. Cunningham.1996. Stability of herpes simplex
virus DNA in cerebrospinal fluid specimens. Diagn. Mol. Pathol.5:249–252. 23. Zipeto, D., S. Morris, C. Hong, A. Dowling, R. Wolitz, T. C. Merigan, and L. Rasmussen.1995. Human cytomegalovirus (CMV) DNA in plasma reflects quantity of CMV DNA present in leukocytes. J. Clin. Microbiol.33:2607– 2611.