Journal of Chemical and Pharmaceutical Research, 2013, 5(12):265-269
Research Article
CODEN(USA) : JCPRC5
ISSN : 0975-7384
Evaluate innovational productivity of china pharmaceutical manufacturing
industry based on DEA-Malmquist index approach
Yan Hongyan and Yang Yi
Beijing Union University, Beijing, China
_____________________________________________________________________________________________
ABSTRACT
Data envelopment analysis (DEA) based on mathematical programming model, is a good analysis method used to measure the relative efficiency of Decision Making Units (DMUs) with multiple inputs and multiple outputs. DEA-Malmquist productivity index measures the productivity change over time. The DEA-Malmquist productivity index can be decomposed into two components: one measuring the technical change and the other measuring the frontier shift. By using the DEA-Malmquist index analysis approach, this paper conducts an empirical study to evaluate the innovational productivity of China pharmaceutical manufacturing industry from the following two perspectives: twenty -three provincial regions and fifty-seven comprehensive economic zones with the time series data from 2001 to 2011. It deeply analyses the patent innovation efficiency change in different periods and analyses the technical change rate.
Keywords: Innovational Productivity, Data Envelopment Analysis(DEA), Malmquist Productivity Index, Pharmaceutical Manufacturing Industry
_____________________________________________________________________________________________
INTRODUCTION
During the “The Twelfth Five-Year Guideline”, Chinese government invested nearly RMB 20 billion Yuan by means of “Significant new medicine development” and other special projects, motivating a large amount of social capital to invest in the field of medicine innovation. Over 50 national technology centers dominated by enterprises were set up by means of university-industry-research institute alliances. Since China pharmaceutical industry received so many resources, has it brought effective contribution of production values? The pharmaceutical industry belongs to high-tech industry featuring high input, high return, long investment period and high risk. The increase of resources for innovation can stimulate the increase of output to a certain degree, but it cannot improve the rate of resource utilization. Therefore, it is very important to assess the innovation efficiency of China pharmaceutical Manufacturing industry.
adopt DEA-Malmquist index to study the innovation efficiency of China’s pharmaceutical industry from middle and micro scopes by using the provincial data of China’s pharmaceutical industry and data of listed pharmaceutical companies.
EXPERIMENTAL SECTION
Data envelopment analysis (DEA) based on mathematical programming model, is a good analysis method used to measure the relative efficiency of Decision Making Units (DMUs) with multiple inputs and multiple outputs. The essence of the method is to judge whether DMU is on the “frontier of production” of production possibility set, which is a typical non-parametric method. The company which inputs least but outputs most builds a frontier of efficiency. Those companies which are at the efficiency frontier are considered as efficient while those companies under the frontier are considered as inefficient. So, this is a typical non-parameter method. This method was first put forward by Charnes, so it is called CCR model. The assumed condition of the method is the constant returns to scale; Banker, et al extended the CCR model and put forward the assumption of changeable returns to scale, that is BBC model.
Suppose there are DMUj (j=1, 2, …,n), each DMU has input X=(X1j, X2j, …, Xmj)
T, and output Y
=(Y1j, Y2j, …, Ymj)
T
, the efficiency assessment model of j0 DMU is as follows:
Slack variable means s-
and surplus variables means s+
,dual program is as follows:
Optimum Solution of dual program is λ0,s
-0
, s
+0
,θ0 ,(1)if θ0 =1,and s
-0
=0,s
+0
=0, j0 is DEA efficient; (2)if θ0 =1,j0 is weak DEA efficient;(3)if θ0﹤1,j0 is Non-DEA efficient.
Compared with CCR model, BBC has a constraint condition: Σλj=1, so when the ineffective result of CRS assessment is achieved, BBC model can be used to further compare the technical effectiveness between DMUs. If
θ=1 and the input constraint is not relaxed, it shows that the technical efficiency of DMU0 is the highest, or else, the
technology of DMU0 is not effective.
DEA-Malmquist productivity index measures the productivity change over time. The DEA-Malmquist productivity index can be decomposed into two components: the technical change and the frontier shift. The given input variable matrix output distance function is defined as the optimal proportional of output variable matrix. Malmquist productivity index has two major advantages: the related price information is not required; it can decompose TFP to study the source of the increase of TFP. In this paper, the directional output variables are used to analyze the innovation efficiency of China’s pharmaceutical industry. The distance function of output variables is as follows:
Therein, p(x) is the possible set; y stands for output matrix; δ is directional output efficiency index of Fare; x stands for input matrix. If y is within p(x), the function value will be smaller than 1; if y is on the boundary of p(x), the function value will be equal to 1; if y is beyond p(x), the function value will be larger than 1. From the period t-1 to t, the Malmquist index used to measure the increase rate of TFP is as follows:
Therein, (xt-1, yt-1) and (xt, yt) stand for input and output vector quantity during t-1 and t; D t
0 and D t-1
0 are respective
distance functions of t-1 and t based on the technology of t-1. From the output angle, Malmquist index can be defined as:
Fare rewrite Malmquist index as:
Therein, Dc (x, y), Du (x, y) respectively stand for distance function of constant returns to scale and distance function of changeable returns to scale. From left to right, the three formula connected by two times signs are: PTEC (pure technical efficiency change), SEC (scale efficiency change), TC (technical change). Here EFFC=PTEC×SEC, and EFFC is technical efficiency change. If Mt-1,t>1, TFP grows; if Mt-1,t<1, TFP declines; if Mt-1,t =1, TEF remains
unchanged. If the change value of EFFE, PTEC, SEC or TC is larger than, the change larger than 1 is the growth source of TFP; if the change value is smaller than 1, it is the cause of TFP’s decline.
INDEXES AND DATA SOURCE
Firstly, each province is taken as a DMU to build the optimal conversion frontier of each year from 2001 to 2011 and to calculate DEA efficiency value and Malmquist productivity index of each province so as to reflect the changes of the provincial level innovation efficiency of China. The input of innovation resource mainly includes capital input for research and development (R&D), input of labor resource and enterprise expenditure except R&D fund. According to China’s national conditions, since the open and reform of China and the GMP (Good Manufacturing Practice) was implemented, the improvement of self innovation capability of enterprise can be considered as expenditure which pushed forward the progress of industrial technology. As a result, it is crucial to take the four expenditures of introduction technology, technological transformation, purchase of technology, and absorption of technology into the indexes. For this reason, the author selects six indexes including full-time weight of R&D personnel, the total expenditure within R&D fund, expenditure for purchasing technology, expenditure for absorbing technology, expenditure for introducing technology and expenditure for technological transformation as input variables for technological innovation in this paper to reflect the input of manpower for pharmaceutical technological innovation, finance, market changes, etc. The sales revenue of new product and acceptance quantity of patent application are taken as output variable to reflect the direct output of pharmaceutical technological innovation. The data about technological innovation activities of pharmaceutical enterprises come from Annual Report ON China Pharmaceuticals Statistics, China High-tech Industrial Statistical Yearbook, China Statistical Yearbook and China Science and Technology Statistical Yearbook in 11 years from 2001 to 2011. As the data of 8 provinces (Qinghai, Inner Mongolia, Xinjiang, Gansu, Ningxia, Hainan, Guizhou, and Tibet) are missing, the data are not sufficient to build statistical samples, so these provinces are not accounted in the research samples of this paper. As a result, only 23 provinces are selected as research samples.
analysis, select 57 listed companies of prior to 2001 (including 2001)as DUM representative of China’s pharmaceutical industry(the main business of these enterprises are basically the same, which conforming to the requirement of DEA method on “the same type” of DMU).The data mainly based on the joint assessment of business performance of listed enterprises by China Securities Journal and China Integrity Security Assessment Co., Ltd. and annual reports of these listed companies.
EMPIRICAL FINDINGS AND ANALYSIS
[image:4.595.206.405.295.417.2]Based on the indexes and data abovementioned, the changes of innovation efficiency of pharmaceutical industry of 23 provinces and cities of China during 11 years from 2001 to 2011 are calculated by using Deap2.1 and the changes are decomposed by using Malmquist index. The results are seen in Table 1. From Table 1, from 2001 to 2011, the average annual growth rate of TFP of pharmaceutical industry of China is 9.7%. The changes of three indexes of technological efficiency, technological progress efficiency and TFP efficiency are transformed into a linear graph to explore the affecting factors causing the changes of TFP values. The result shows that the changing direction of TFP and the changes of technological progress value are nearly identical and there was a big gap between them only in 2004. That was caused by the big environment of SARS and the technological progress was not fully achieved in the pharmaceutical industry. From this, it can be inferred that the change of TFP value was mainly caused by the change of technological progress.
Table 1 the changes of innovation efficiency of pharmaceutical industry of 23 provinces and cities of China from 2001 to 2011
Period EFFC TC PTEC SEC M
2001-2002 1.005 1.048 0.945 1.063 1.053 2002-2003 1.153 0.993 1.061 1.087 1.145 2003-2004 0.833 1.230 0.934 0.892 1.025 2004-2005 1.335 1.071 1.066 1.252 1.429 2005-2006 1.116 0.999 1.156 0.965 1.114 2006-2007 1.053 0.952 1.045 1.008 1.003 2007-2008 1.017 1.170 1.010 1.007 1.190 2008-2009 1.053 0.957 1.033 1.019 1.007 2009-2010 1.027 0.929 1.016 1.011 0.954 2010-2011 0.995 1.025 1.002 0.993 1.020 Average 1.057 1.037 1.027 1.030 1.097
Although the average growth rate of technological progress is only 3.7%, by investigating the technological progress change indexes in Table 1 from 2001 to 2011, over a half of the annual technological progress value is smaller than 1, which shows that the entire technological progress capability of China needs to be improved and the entire scientific research ability and strength of China still needs to be enhanced. This is the main factor which should be taken in to account to improve the innovation efficiency of pharmaceutical industry of China. Opposite to technological progress changes, the average annual technological efficiency of China’s pharmaceutical industry from 2001 to 2011 is 5.7%. In most years, the technological efficiency value is larger than 1, which shows that the pharmaceutical industry of China gradually has the ability of introducing, absorbing, transforming technologies and converting scientific research results into commercial products.
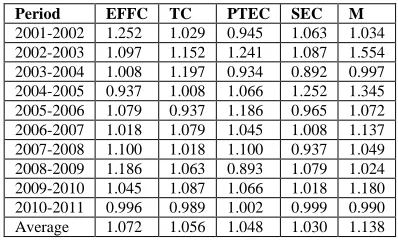
Table 2 the changes of innovation efficiency of pharmaceutical manufacturing industry from 2001 to 2010
Period EFFC TC PTEC SEC M
2001-2002 1.252 1.029 0.945 1.063 1.034 2002-2003 1.097 1.152 1.241 1.087 1.554 2003-2004 1.008 1.197 0.934 0.892 0.997 2004-2005 0.937 1.008 1.066 1.252 1.345 2005-2006 1.079 0.937 1.186 0.965 1.072 2006-2007 1.018 1.079 1.045 1.008 1.137 2007-2008 1.100 1.018 1.100 0.937 1.049 2008-2009 1.186 1.063 0.893 1.079 1.024 2009-2010 1.045 1.087 1.066 1.018 1.180 2010-2011 0.996 0.989 1.002 0.999 0.990 Average 1.072 1.056 1.048 1.030 1.138
[image:4.595.206.405.559.680.2]industry of China. The mean value of technological efficiency is 7.2% and the average annual growth rate of technological progress is 5.6%, which are higher than those of the entire pharmaceutical industry of China. The changes of TFP are caused by the joint changes of technological progress and technological efficiency.
RESULTS AND DISCUSSION
By means of DEA-Malmquist index analysis method, based on the provincial data of pharmaceutical industry of China and data of listed companies, the author has studied the changes and change source of the innovation efficiency of pharmaceutical industry of China. The researches on the provincial data in middle scope and data of enterprises from micro scope both show the following results: in view of the changes of efficiency of resource allocation, technological progress and innovation efficiency calculated based on Malmquist indexes and structural decomposition, the growth rate of resource allocation of China’s pharmaceutical industry is faster than that technological progress and the total growth of innovation efficiency is mainly affected by technical change. The overall technological progress ability of China’s pharmaceutical industry still needs to be improved and the overall scientific research ability and strength still needs to be enhanced.
Acknowledgement
This research work was supported by Beijing Union University, and The Project of Importation and Development of High-Caliber Talents of Beijing Municipal Institutions(CTT&TCD201304088).
REFERENCES
[1] W Nasierowski, FJ Arcelus.Socio Economic Planning Sciences .2003(2);215-234. [2] A Hashimoto, S Hancda.Research Policy.2008 (10);1829-1836
[3]CT Chen, CF Chien Lin; JT Wang.International Journal of Business.2004,9 (4);1083-4346. [4]JP Guo, YH Wu. Chinese Journal of Management Science.2005(2); 40-43.
[5]AM Zhang, YZ Zhang, RA Zhao. Journal of Comparative Economics. 2008,(31);444-464. [6]BL Liu,F Xu, LB Li. Management World.2013(2);111-124.