2017 2nd International Conference on Wireless Communication and Network Engineering (WCNE 2017) ISBN: 978-1-60595-531-5
A New Method to Design Modified Robust Distribution of LT Codes
Yu-zhou SHANG
*, Li-min MENG, Pei-rui JIANG and Yang-tian-xiu HU
College of Information Engineering Zhejiang University of Technology Hangzhou, Zhejiang, China, 310023
*Corresponding author
Keywords: LT codes, Degree distribution, Robust soliton distribution.
Abstract. The performance of the decoding process of LT codes depends largely on its degree distribution. Due to the Significance of the degree distribution, the optimization of it is worth explored. In this paper, we propose a new method to design the degree distribution. We make modification to the robust soliton distribution through adding adjusted binary exponential distribution and modified Poisson distribution on RSD and controlling the weight of them. This method can combine the advantages of these degree distributions and highly improve the performance of encoding and decoding. Through simulation experiments, we have obtained the optimal value of weight and verified its better performance.
Introduction
The concept of digital fountain, also known as fountain code, is first proposed by M. Luby et al. at the year of 1998. However, there was no practical scheme of fountain. Until 2002, M. Luby proposed first practical scheme named Luby Transform (LT) code. Compare to traditional erasure codes, LT code has less complexity, which means the amount of computation is lower in the encoding and decoding process.
The encoding process of LT code is easy to understand. The process begins by generating an integer d which is defined as degree according to degree distribution Ω( )d . After that, the encoder selects d symbols from k source symbols and does XOR of these symbols to generate an encoded symbol. By repeating these operations, we can obtain infinite encoded information flow. After receiving enough encoded symbols, the decoder can start decoding. The decoding process of LT code employs the Belief Propagation (BP) decoding algorithm. In the first step of decoding, the decoder randomly selects a degree-1 symbol which can directly recover its source symbol from all selected symbol. In the second step, all received symbols connected with the selected symbol perform XOR operations with the selected symbol and their degrees decrease by 1. By repeating these two steps, all received symbols could be recovered. In the decoding process, the set of covered input symbols that have not yet been processed is called the ripple, and thus at this point all covered input symbols are in the ripple. From the encoding and decoding process, it is obvious that degree distribution has a great influence on the performance of LT codes.
based on optimization of ripple size. The optimization is done by constructing a Loss function with ripple size and minimize the Loss.
In this paper, we propose a new way to modify the robust soliton distribution. After making appropriate adjustment to BED and PD, we add these two adjusted distributions on RSD and control the weight of them. Simulation result shows that compare to the RSD, MRSD with proper value of weight can improve both decoding efficiency and the symbol recovery probability.
Existed Degree Distribution
Robust Soliton Distribution
During LT decoding process, we hope the number of degree-1 encoded symbols remain unchanged in every iteration. The Ideal Soliton Distribution(ISD), which is a special case, can be obtained [2], and its function is defined as follow:
1 / , 1
( )
1 / ( ( 1)), 2,...,
k d
d
d d d k
ρ = =
− =
(1)
( )d
ρ is the probability that an encoded symbol has degree d. k is the number of source symbols. The ISD theoretically ensure that at each iterative decoding step, the number of degree-1 encoded symbol is 1. However, like most ideal thing, ISD is nearly useless in practice. Because the theoretically number of drgree-1 encode symbol is always 1, any variance will cause the disappearance of degree-1 symbols and the failure of decoding process.
Robust Soliton Distribution (RSD) makes an improvement of ISD by introducing two parameters δ and c, where δ is the allowable failure probability of the decoder to recover the data for a given number of k encoded symbols and c is a suitable positive constant. Then the auxiliary function
( )d
τ can be defined as follow:
/ , 1,..., / 1 ( ) ln( / ), /
0, / 1,...,
R dk d k R
d R R d k R
d k R k
τ δ = − = = = + (2)
Where R is a constant, and its value is c⋅ln( / )k δ ⋅ k .
The RSD can be obtained by adding ( )ρ d to ( )τ d and normalizing it:
1 ( ) ( ) ( ) ( ) ( ) k d d d d d d ρ τ µ ρ τ = + = +
∑
(3)Binary Exponential Distribution
The number of symbols generated by the robust soliton distribution is relatively large, so that all the source symbols can be covered as much as possible in the encoding process. But it produces less coding symbols, and the decoding process may interrupt. In [3], the authors propose the Binary Exponential Distribution (BED) which increases the probability of the occurrence of smaller values of degree, defined as follows:
1
1/ 2 , 1, 2,..., 1 ( )
1/ 2 ,
d d d k b d d k − = − = =
(4)
( )
decreasing very rapidly. So, we can get only a few encoded symbols with big degree, the coverage rate of source symbols is low.
Poisson Distribution
In probability theory and statistics, the Poisson distribution is a discrete probability distribution that expresses the probability of a given number of events occurring in a fixed interval of time and/or space if these events occur with a known average rate and independently of the time since the last event. The Poisson distribution can also be used for the number of events in other specified intervals such as distance, area or volume.
Due to Similarity between Poisson distribution and other frequently-used degree distribution, Poisson distribution with appropriate modification have the potential to be a good degree distribution. The probability density function of Poisson distribution is as follow:
( ) 1, 2,... !
d
e
p d d
d
λ
λ −
= , = (5)
Where λ is a positive constants.
Proposed Scheme
Important Characteristics of Degree Distribution
It has been found that a good degree distribution has some common characteristics after a great deal of research work. The fraction of certain degrees in a degree distribution dominates the performance of the decoding process of LT codes. For a good degree distribution, the fraction of degree-2 symbols must be the maximum in the degree distribution. In [8], O. Etesami and A. Shokrollahi investigated the performance of fountain codes on arbitrary binary input memoryless symmetric channels (BIMSCs), and generalized the bound on the degree-2 fraction if the error probability of the BP decoder converges to zero. The range of degree-2 fraction is constrained to 0≤µ(2) 1 / 2≤ in general,
(2) 1 / 2
µ = in binary erasure channel (BEC), and 1 / ln(16)≤µ(2) 1/ 2≤ in the binary-symmetric channel (BSC) and the binary input additive white Gaussian noise (BIAWGN). Many scholars have considered adjusting degree-2 fraction reasonably to improve the performance of LT codes, and have made certain achievements. In this letter, we also pay great attention to this characteristic.
Modified Robust Soliton Distribution
1
0.25, 1
0.5, 2
( )
1 / 2 , 3,..., 1 1 / 2 ,
d d d d b d d k d k − = = = = − = (6)
For PD, we change the value of (2)p , then the modified PD can be obtained:
0.5, 2 ( ) , ! d d
p d e
others d λ λ − = = (7)
Following the modification of BED and PD, we can obtain the proposed Modified Robust Soliton Distribution by combining the RSD, adjusted BED and MPD. The function of the distribution is as follow:
1
( ) ( ) ( )
( ) , 1,...,
( ) ( ) ( )
k d
d b d d
d d k
d b d d
ρ α β θ
ρ α β θ
=
+ ⋅ + ⋅
Ω = =
+ ⋅ + ⋅
∑
(8) Where ( )b d is adjusted BED and ( )θ d is MPD, k is the number of source symbol, α and β are the weighting coefficients. We could control the weight of adjusted BED and MPD through adjusting the value ofα
and β , So these two coefficients have direct effect on the performance of the distribution. However, due to the difficulty and complexity of calculating the accurate value ofα
andβ, we will obtain the optimal value through simulation experiments
Simulation Results
In this section, we test the performance of the MRSD by doing several simulation experiments and compare the results with RSD after 1000 encoding/decoding processes. We set the constants c=0.3 and =0.2δ in RSD and adopt the Belief Propagation algorithm to decode the encoded data. In [5], the author had proved that PD with =3.04λ can achieve optimal performance, so we adopt this value in our simulation.
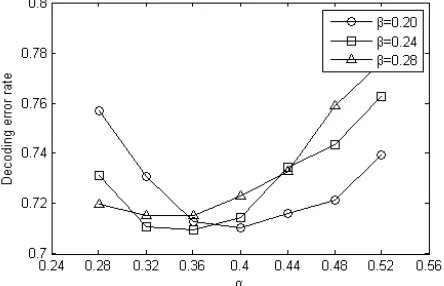
[image:4.612.190.412.558.701.2]To obtain the optimal value of
α
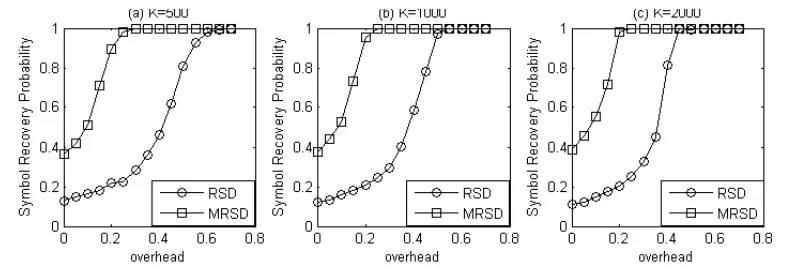
and β, Several simulation experiments are carried out and the results is in Figure 1. We set the overhead ε =0.2 in this simulation. From the Figure 1 we can see that Setting =0.36α and =0.24β can make the decoder reaches the minimum of decoding fail rate when we combine RSD, adjusted BED and MPD to form MRSD. Thus, =0.36α and =0.24β are optimal values of weight of adjusted BED and MPD to obtain best performance.The symbol recovery probability versus the overhead for MRSD and RSD with different k is shown in Figure 2. The symbol recovery probability means the rate of successfully recovered symbols which decoded from encoded symbols by the decoder. Obviously, when the parameter is chosen reasonably, the fewest encoded symbols are needed for decoder to successfully recover all source symbols. When the overhead is lower, the performance of MRSD is remarkably superior to RSD. As the overhead increasing, the symbol recovery probability of MRSD rises rapidly to 1 for different k.
Figure 2. Symbol recovery probability versus overhead with different k.
Summary
This paper combined the characteristics of several degree distributions include RSD, adjusted BED and MPD. To optimize RSD, we introduce a new scheme of adding adjusted BED and MPD on RSD and controlling the weight of adjusted BED and MPD. We obtain the optimal value of the weight through several simulation experiments. Simulation result shows that the MRSD with optimal value of weight obviously outperform than RSD and other optimized degree distribution.
Acknowledgement
This work was supported by the National Natural Science Foundation of China (61372087).
References
[1] J. Byers, M. Luby, M. Mitzenmacher, “A digital fountain approach to reliable distribution of bulk data,” ACM SIGCOMM Computer Communication Review, 1998, pp. 56-67.
[2] M. Luby, “LT codes,” in Proc. IEEE Symp. Found. Comput. Sci., Vancouver, BC, Canada, Nov. 2002, pp. 271–280.
[3] K. A. Agha, N. Kadi, I. Stojmenovic, “Fountain codes with XOR of encoded packets for broadcasting and source independent backbone in multi-hop networks using network coding,” Proceedings of Vehicular Technology Conference, Barcelona, Spain, Apr.26-29, 2009, pp. 1-5.
[4] M. S. Zaman, G. R. Murthy, “A new degree distribution for LT codes for broadcasting in Ad hoc network using network coding,” First UK-India International Workshop on Cognitive Wireless Systems (UKIWCWS), Delhi, India, Dec. 10-12, 2009, pp. 1-5.
[5] Weiqing Yao, Benshun Yi, Taiqi Huang, Weizhong Li, "Poisson Robust Soliton Distribution for LT Codes", Communications Letters IEEE, 2016, vol. 20, pp. 1499-1502.
[7] K.-K. Yen, Y.-C. Liao, and H.-C. Chang, “Design of LT code degree distribution with profiled output ripple size,” in Proc. IEEE Workshop Signal Process. Syst. (SiPS), Hangzhou, China, Oct. 2015, pp. 1–6.