2017 International Conference on Mathematics, Modelling and Simulation Technologies and Applications (MMSTA 2017) ISBN: 978-1-60595-530-8
Numerical Research on Wave Evolution near an Island
Using SWAN Model
Li ZOU
1,2,*, Jin DONG
1, Sheng-chao JIANG
1, You YU
1and Yu-guo PEI
11School of Naval Architecture, State Key Laboratory of Structural Analysis for Industrial Equipment,
Dalian University of Technology, Dalian 116024, P.R. China
2Collaborative Innovation Center for Advanced Ship and Deep-Sea Exploration,
Shanghai 200240, P.R. China *Corresponding author
Keywords: SWAN model, Wave evolution, Wave spectra.
Abstract. Wave evolution near an island is simulated using SWAN model. Comparisons of the wave heights and wave spectra between simulation and observation are carried out, in which a significant agreement between them can be observed. In this paper, SWAN numerical model proves to simulate wave evolution well over sharp topography in South China Sea, and this study can provide basic data for engineering construction.
Introduction
In recent years, with the development of economy, the coastal tourism, shipping and marine engineering become more and more frequent. In order to ensure the safety of humanity activities, a structure that can withstand extreme natural conditions is necessary. When designing a structure to withstand wave conditions at the position where it is proposed to be built, predictions of the expected wave conditions must be made. In this paper, the SWAN model is used to simulate the evolution of waves near an island.
Lin et al. [1] simulated the wave evolution of Chesapeak Bay with SWAN. The results showed fairly good response in predicting mean wave direction, but SWAN overestimated significant wave height and underestimated peak period. Wood et al. [2] found that the SWAN model showed a better response in shallow water flume experiments when the triad interaction was excluded. Chen et al. [3] used SWAN model to simulate steady wind waves and ‘9711’ typhoon waves in the Rudong sea area in Jiangsu Province, and the results were in good agreement with the observed ones. Sun et al. [4] simulated the wave fields in Bohai sea from 1985 to 2004 with SWAN model, and the comparisons of wave heights between observation showed a good agreement in general. In addition, many researchers have also improved the nonlinear terms of SWAN. The improved model has been applied to several engineering projects, and the simulated results show good response with observation or experimental results[5,6,7,8].
In this paper, SWAN model is implemented in the South China Sea to study wave evolution near an island. The basic formulations and the validation of SWAN model are described firstly and then the comparisons between simulated results and experimental results are given.
SWAN Model and Validation
Basic Formulations
( , )
( , )/
N
σ θ
E
σ θ σ
, (1) where is the relative frequency ,
is the wave direction.The spectral action balance equation [9] is expressed in Cartesian-ordinates as given by:
y
x c N σ θ tot
c N c N c N S
N
t x y σ θ σ
, (2)
where cx ,cy ,c and c are the velocities of
x
,y
, and
space, respectively.The first term in the left-hand of Eq. 2 denotes the local rate of change of density in time, and the second and third term denotes the energy propagation of wave energy with velocities cx and cy in x and
y
space, respectively. The fourth term represents shifting of radian frequency due to variations in depths and currents. The fifth term represents depth-induced and current-induced refraction. And the Stot is the source term denoting the processes of wind generation, dissipation and nonlinearwave-wave interactions. In shallow water, six processes [9] are included:
3 4
tot wind nl nl wc bot db
S S S S S S S . (3) These terms represent, respectively, energy input by wind, nonlinear transfer of wave energy through three-wave and four-wave interactions and wave decay due to whitecapping, bottom friction and depth-induced wave breaking. The details of these terms can be found in reference [9].
Validation of SWAN Model
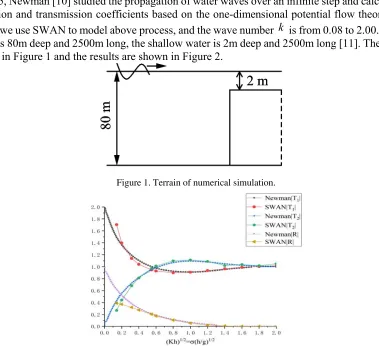
In 1965, Newman [10] studied the propagation of water waves over an infinite step and calculated the reflection and transmission coefficients based on the one-dimensional potential flow theory. In this paper, we use SWAN to model above process, and the wave number k is from 0.08 to 2.00. The deep water is 80m deep and 2500m long, the shallow water is 2m deep and 2500m long [11]. The terrain is shown in Figure 1 and the results are shown in Figure 2.
[image:2.612.110.489.366.712.2]Figure 1. Terrain of numerical simulation.
Where
Amplitude of wave transmitted into shallow water Amplitude of wave incident from deep water T1
Amplitude of wave transmitted into deep water Amplitude of wave incident from shallow water T2
Amplitude of reflected wave R
Amplitude of incident wave
.
The above results have shown that the results of SWAN have a good agreement with theoretical results when the value of (Kh)1/2increases gradually. As a result, using SWAN to model the wave evolution near islands is reasonable.
Experiments and Model Set Up
Model Experiments
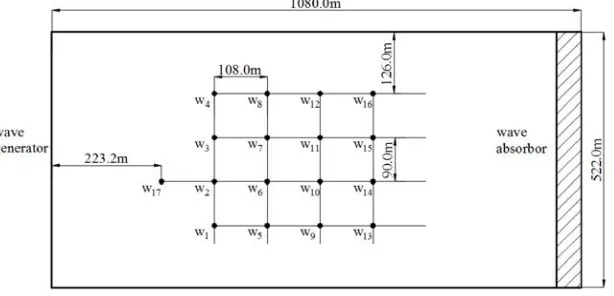
[image:3.612.155.462.351.499.2]A set of experiments to examine wave transmission over real terrain are carried out. The experimental terrain is generated according to the measured terrain, and simplified treatment is done in some complex zones. In this paper, two cases with irregular waves are carried out and 17 wave gauges are used. The cases are shown in Table 1, experimental layout and positions of wave gauges are shown in Fig 3, the origin is in the lower left hand, and wave generator is in the wave tank. In addition, an absorbing zone is at the end of wave tank.
Figure 3. Positions of wave gauges and experimental layout.
Model Set Up
The SWAN wave model runs in the third generation and non-stationary mode in Cartesian ordinates. The directional wave energy density spectrum function is discretized using 36 directional bins and 100 frequency bins between 0.05 Hz and 0.25 Hz. The numerical scheme was BSBT, which is a more suitable method for the simulation of complex terrain [9]. The physical sources including whitecapping, bottom friction, wave breaking and wave-wave interactions are calculated in the simulation, and all values of above sources are default. The computational zone is 1080m long and 522m wide, the terrain of numerical simulation and measure points can be seen in Fig 4.
Table 1. Test conditions.
Case number Significant wave height [m] Peak period [s]
1 2.596 10.02
Figure 4. 2D and 3D terrain of numerical simulation and measure points.
In this simulation, the size of computational grid is 2.25m long and 2.25m wide. The JONSWAP spectra are used as incident spectra. Two cases are calculated by SWAN according to the experiments which are listed in Table 1.
Results
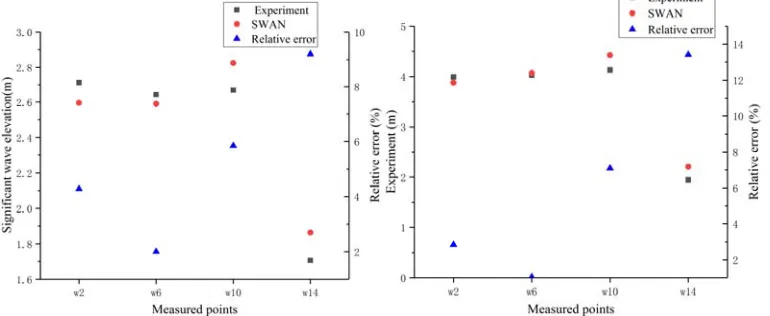
From numerical simulation and model experiments, the wave parameters of measured points such as wave height and wave period for both cases are got. Four typical points marked w2, w6, w10, w14 are chosen for detailed discussion. The water level is getting shallower from w2-w14. From Fig 5 and Fig 6, it can be observed that the results of SWAN show a great agreement with experiments in terms of significant wave height, and the maximum value of relative error is about 13%. Results of significant wave heights in shallow water agree better than that in deep water.
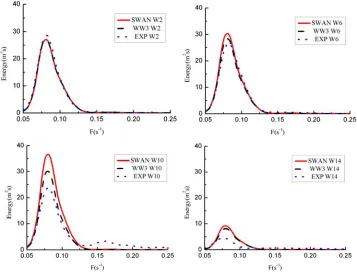
[image:4.612.116.501.357.515.2]The wave spectra from SWAN and experiments are also obtained which are compared with the results calculated by Sun [12] using WAVEWATCH–III (WW3). The comparisons of wave spectra are shown in Fig 6 and Fig 7.
[image:5.612.125.492.115.390.2]
Figure 6. Comparisons of wave spectra between experiments and SWAN and WW3 in case 1.
Figure 7. Comparisons of wave spectra between experiments and SWAN and WW3 in case 2.
[image:5.612.128.485.419.693.2]of w2 show a great agreement with experimental results and WW3 including peak values and shape of spectra. However, when water depth becomes shallow, SWAN overestimates the peak value, but the shape of spectra also agree well with experiments and WW3.
Summary
In this study, wave evolution near an island is calculated successfully by SWAN numerical model. Comparisons between experimental results and simulation results show great response.
By statistical analysis, we observe that significant wave height increases when water depth becomes shallow, however, wave height decreases sharply when the water depth is very shallow such as the measured point w14. In addition, wave spectra energy also decreases sharply in shallow water. Nonlinear interactions in shallow water such as whitecapping and wave breaking might lead to this phenomenon. It is also found that SWAN overestimates peak value of wave spectra. Default values of physical sources are used in this paper which might result in over predictions. Therefore, further examination of alternative definitions could lead to better results.
The SWAN model proves to simulate wave evolution successfully near an island in South China Sea. And this study can help us provide basic data for ocean environment research and engineering construction.
Acknowledgement
The present work is supported by the National Natural Science Foundation of China (51522902, 51379033,51579040), the Fundamental Research Funds for the Central Universities (DUT17ZD233).
References
[1] Lin, W., L.P. Sanford, B.J. Alleva, and S.E. Suttles, Wave measurements and modeling in Chesapeake Bay. Cont. Shelf Res. 22 (2002) 2673–2686.
[2] Wood, D.J., M. Mattray, and H. Oumeraci, The SWAN model used to study wave evolution in a flume, OceanEng. 28 (2001) 805–823.
[3] Chen Bo, Jiang Chang- bo, Chen Han- bao, Numerical Simulation of Wind Waves Around Rudong Sea Area in Jiangsu Province, Port & Waterway Engineering. 01(2007) 20-24+29.
[4] Sun Xiao-juan, Zyou Liang-ming, Wang Ai-fang, Study on the wave extreme parameters of the Bohai Sea with the numerical simulation using SWAN, Marine Science Bulletin, 15(2013) 16-26. [5] Zijlema, M., Van der Westhuysen, A.J., On convergence behaviour and numerical accuracy in stationary SWAN simulations of nearshore wind wave spectra, Coast. Eng. 52(2005) 237–256. [6] Li Daming, Pan Fan, LUO Hao, A study of the numerical forecast model of wind waves in Bohai Bay, Journal of Harbin Engineering University, 35 (2014) 132-140.
[7] Jiang Ting-song, REN Jian-li, Shen Cai-qin, Simulation of significant wave height in the shallow shelf area by SWAN model and its improvement, Marine Forecasts, 31(2014) 9-17.
[8] Lim, S.H.L., and E.S. Chan, Surf Zone Wave Modeling -Improvement of Dissipation by Depth-Induced Wave Breaking in Swan, the Tenth OMISAR Workshop on Ocean Models, Hanoi, Vietnam, (2003).
[9] The SWAN Team. SWAN Scientific and Technical Documentation (41.01A). Delft: Delft University of Technology (2015).
[10]newman n j. Propagation of water waves over an infinite step, J. Journal of Fluid Mechanics, 23(1965) 399-415.