Spectrum Requirements Estimation for the Future IMT
Systems: Current Work and Way Forward
Jing Pang1, Tan Wang2, Jingchun Li2, Biao Huang2
1
School of Information Engineering, Hebei University of Technology, Tianjin, China 2
The State Radio Monitoring Center, Beijing, China Email: [email protected]
Received June 2013
ABSTRACT
In order to satisfy the spectrum requirements of the future international mobile telecommunication (IMT) systems, to realize scientific allocation and usage of spectrum resources and to avoid spectrum waste brought by allocation in ad- vanced, there is a need to make a reasonable estimation for the spectrum demands of future IMT systems. The estima- tion results can also provide guidelines for the subsequent spectrum planning and assignment work. This paper gives a description of study progress of related spectrum estimation for future IMT systems. From the analysis of current work and practical situation, the key factors in the estimation methodology are summarized to provide a reference for the fol- lowing work.
Keywords: Spectrum Requirements; Estimation; IMT Systems
1. Introduction
Spectrum resources are shared by the world and allocated by each country. It is scarce and widely used in national economy and defense construction. The mobile commu-nication industry is one of the most important sectors which closely associate with the spectrum resources. Stu-dies from a number of agencies have shown that, in re-cent years, with the development of wireless technology and people’s demand for high rate multimedia services, future mobile data traffic will show explosive growth, which is shown in Figure 1 [1]. This poses a serious challenge to the development of new technologies and spectrum resources management.
In order to cope with the huge demand of wireless traffic, technologies and wireless communication systems are evolving rapidly, a number of key technologies and new network architectures have emerged. The interna-tional mobile telecommunication system defined by Ra-diocommunication Sector of International Telecommu-nication Union (ITU-R) has come to the era of 4G and is proceeding to 5G gradually. Accordingly, China has set up IMT-2020 (5G) Promotion Group, and strives to lead the trend of the development of international technolo-gies in 5G era.
Researches show that occurrence of the next genera- tion of wireless communication services will have a strong gathering feature [2], such as home, office, etc. Reports show that two-thirds of the voice services and 90%
of the data services in Europe are expected to be hap- pened in hotspots [3]. In the United States, it is supposed to be 50% of the telephone calls and 70% of the data services [4]. The new characteristic of service distribu-tions will be a strong impetus to the development of network deployments and coverage strategies in hotspots, such as “Small cell” [5] advocated by the 3rd generation partnership project (3GPP).
[image:1.595.312.538.564.713.2]The new IMT systems have much more demand for spectrum resources. Currently, ITU-R is carrying out re-searches about total spectrum requirements estimation for future IMT systems. Countries such as the U.S., Russia, Japan and organizations such as Global System for Mo-
bile Communications Association (GSMA) have partici- pated in the related studies. The Chinese government and enterprises have also taken part in the activities.
With the deep integration of industrialization and in- formation technology, the contradiction between spectrum supply and demand has become increasingly prominent. In order to realize the scientific management of spectrum resources, to promote the development of related indus-tries, on one hand, the plan and allocation scheme should be made timely. On the other hand, it is necessary to make a reasonable estimation of spectrum requirements, to avoid the waste of resources caused by allocation in advanced. Reasonable estimation for IMT spectrum re-sources can not only meet the need of solving current IMT issues, but also provide a reference for future spec- trum requirements estimation work of other industry sec- tors.
The arrangement of this paper is as follows. Section 2 gives the current status of the related spectrum require- ments estimation work. In Section 3, the key factors are analyzed for the estimation methodology. The conclusion is presented in Section 4.
2. Status of Spectrum Estimation Work
2.1. International Aspect
Driven by ITU-R, the estimation work for IMT spectrum requirements is carried out actively in the world. In the Recommendation ITU-R M.1768 [6], Working Party (WP) 5D proposes a complete and worldwide estimation me-thod, which includes two main advantages. One is the detailed survey about traffic types and market needs of the future wireless communication, the other is estab-lishing a complete set of mapping relation between “traf-fic needs”, “service environments”, “deployment scena-rios” and “access techniques”, which is shown in Figure 2.
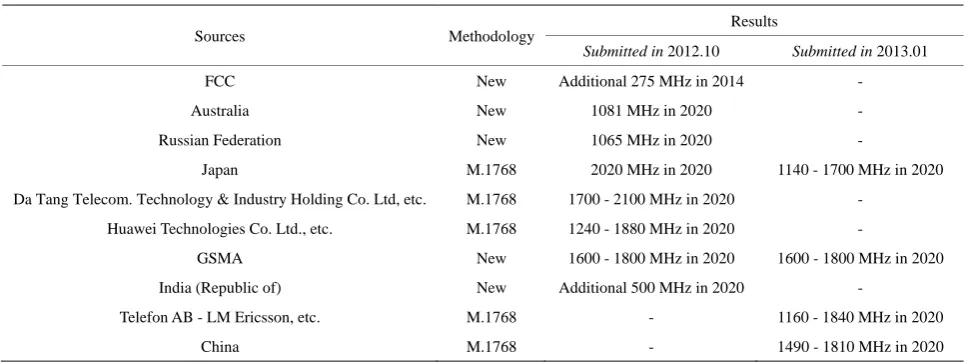
Complete as it is, to some extent, the M.1768 method is very complex. The calculation process is less intuitive. Federal Communications Commission (FCC) of the U.S. proposes a much simpler and intuitive model [7]. In this model, only traffic growth, sites growth and spectrum effi-ciency are taken into account, and the spectrum require-ments are estimated from an overall point of view. A sim-ilar method [8] is proposed by Russian Federation, which believes that the most advanced communication stan-dards will be deployed in all cells, and higher spectrum efficiency will be achieved in 2020. In addition, the me-thod [9] proposed by GSMA jointly considers both the macro-forecast and micro-mapping by combining ITU-R M.1768 with the FCC method. The spectrum require-ments forecast results from multiple sources in latest ITU-R WP 5D conferences are shown in Table 1.
2.2. Chinese Aspect
In China, spectrum requirements estimation work is mainly carried out from the following three aspects.
[image:2.595.311.539.365.516.2]Firstly, it is carried out from finding available spec-trum for the future IMT systems according to WRC-15
Figure 2. Flow chart for method in M.1768.
Table 1. Latest spectrum requirements forecast results from multiple sources on WP 5D meetings.
Sources Methodology Results
Submitted in 2012.10 Submitted in 2013.01
FCC New Additional 275 MHz in 2014 -
Australia New 1081 MHz in 2020 -
Russian Federation New 1065 MHz in 2020 -
Japan M.1768 2020 MHz in 2020 1140 - 1700 MHz in 2020
Da Tang Telecom. Technology & Industry Holding Co. Ltd, etc. M.1768 1700 - 2100 MHz in 2020 -
Huawei Technologies Co. Ltd., etc. M.1768 1240 - 1880 MHz in 2020 -
GSMA New 1600 - 1800 MHz in 2020 1600 - 1800 MHz in 2020
India (Republic of) New Additional 500 MHz in 2020 -
Telefon AB - LM Ericsson, etc. M.1768 - 1160 - 1840 MHz in 2020
[image:2.595.56.539.556.737.2]Agenda item 1.1. Spectrum requirements estimation is the premise and foremost work of searching for available spectrum.
Secondly, in order to make sure that WRC-15 Agenda item 1.1 progresses successfully, China Communications Standards Association (CCSA) Technology Commission 5 (TG5) which focuses on wireless communications is concentrating on this issue.
[image:3.595.311.538.536.706.2]The first two parts of the study focus on the ITU-R level and usage of the M.1768 method, the results of which have been submitted to WP 5D and Asia-Pacific Telecommunity (APT) as national proposals, as shown in Table 1. In order to better consider the practical situa-tions of China, a project on this item has been approved and initiated by Spectrum Sub-Working Group under IMT-2020 Promoted Group in China. The project is ex-pected to develop a spectrum requirements estimation method which will be more suitable for the practical sit-uation of China. The modeling process should stresses the realistic network data, finds out more straightforward and accurate methodologies and conclusions, so as to re-flect the actual needs of Chinese mobile communication networks, and provide a reference for the following fre-quency planning work.
As for the methodology, Beijing University of Posts and Telecommunications makes a prediction on the spec-trum demands of three Chinese operators by using Game Theory and Gray Prediction methods based on M.1768 method, and proposes planning scheme [10] at the same time. The State Radio Monitoring Center of China also proposes a method of future IMT spectrum requirements forecast based on dense urban areas analysis according to M.1768. In the method, the mapping relation between traffic volume and base station (BS) number from dif-ferent access technologies to difdif-ferent deployment cells in the selected dense urban areas is fully taken into ac-count of based on typical dense urban areas. China Acade-my of Telecommunication Research (CATR) of Ministry of Industry and Information Technology (MIIT) proposes an estimation method [11] based on the GSMA metho-dology. The method combines files from Ministry of Housing and Urban-Rural Development of the Republic of China with annual data reports from three domestic operators in recent years, and estimates future traffic vo-lume and carrying capacity using curve fitting algorithm.
3. Key Factors Analysis for Spectrum
Requirements Estimation
According to the plan of ITU-R WP 5D, IMT spectrum requirements estimation work has come to a crucial stage, the final result would be initially submitted in July, 2013. On one hand, from an international level, the present me-thods and outputs need to be further revised to be more refined, accurate and reasonable. On the other hand, in
the research progress of China, methods need to be fur-ther developed in order to fully accommodate the nation-al practicnation-al situation, and to better reflect the renation-alistic network data. In this section, the key factors in spectrum requirement estimations are analyzed, to provide refer-ences for the following studies.
3.1. Scenario under Consideration
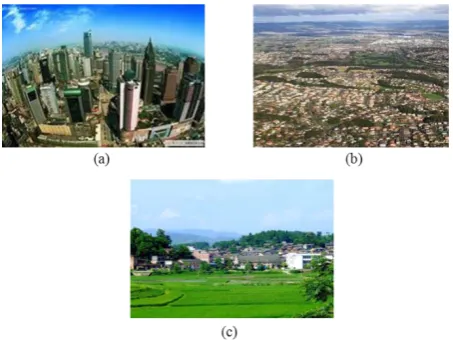
The demand for spectrum resources is closely related to traffic intensity. Spectrum requirements are largely deter-mined by the average demand of the scenario which has the most intensive traffic volume. In M.1768, scenarios are divided into urban, suburban and rural, as shown in Figure 3, and the final spectrum requirement is recog-nized as the maximum among them. The final results show that spectrum requirement of urban areas is much higher than the latter two scenarios. Russian Federation and GSMA also draw similar conclusions.
Therefore, traffic increase in suburban and rural areas will not have substantive influence on the final spectrum requirement results. In contrast, traffic distributions among different scenarios may introduce error to the final results. Firstly, if the overall traffic volume is estimated before being distributed among different scenarios, different dis-tribution ratios will bring greater differences to the re-sults. As the accurate distribution ratio is hard to calcu-late, the actual spectrum demand of the urban area is dif-ficult to be obtained. Secondly, because of the different development degrees of urban areas, “urban area” de-fined in M.1768 is not clear enough to reflect the actual spectrum demand of a country or region. Therefore, a more in-depth analysis of the urban area will be a short-cut to solve the problem of spectrum requirements.
3.2. Baseline Year Selection
In the estimation for future traffic volume, the baseline
year (or other time period such as months) is always the first to be determined. Then the traffic growth multiplier is predicted based on the traffic statistic data of the base-line year. We can say that the basebase-line year selection is closely related to the prediction of traffic growth multip-lier.
Historical statistic data are usually combined with so-cial investigation and curve fitting algorithm in present methods to estimate the traffic growth multiplier. Some methods introduce the concept of “average annual growth rate”, this means the traffic growth multiplier of several years is averaged at each observing year. This kind of methods may provide a reference to the calculation, but should be carefully used, because when the growth rate of adjacent few years fluctuate obviously, using these methods may introduce error to the final results.
For example, we assume that 2012 is the baseline year, and the total traffic volume in 2012 is 1, our goal is to estimate the total traffic volume in 2014.
Case1: It is forecasted that the traffic volume in 2013 will increase to 2 times as compared with 2012, so the traffic volume in 2013 will be 2. If the traffic volume in 2014 still increases 2 times compared with 2013, the traffic volume in 2014 is 4. So the average annual growth rate is 2 times. If we maintain the average annual growth rate as 2, and select 2013 as the baseline year, the traffic volume in 2014 would be 4, which is in accordance with the above conclusion.
Case 2: It is forecasted that the traffic volume in 2013 will increase to 4 times as compared with 2012, so the traffic volume in 2013 will be 4. If the traffic volume in 2014 has no increase compared with 2013, it is still 4 in 2014. It is easy to know that the average annual growth rate is still 2 times. If we maintain the same average an-nual growth rate, and select 2013 as the baseline year, the traffic volume in 2014 would be 8, which disagrees with the above conclusion.
Researchers generally agree that the traffic growth rate will increase first and decrease afterwards between 2010 and 2020. Therefore, in order to avoid the error introduced by using the average annual growth, the baseline year and data should be determined before the traffic growth multiplier.
3.3. Total Traffic Growth Multiplier
Reasonable and accurate forecast for the total traffic growth multiplier is an important premise of the estimation work. Typically, there is a linear positive correlation between the total traffic growth multiplier and the final spectrum requirements estimation result. The traffic growth mul-tiplier is one of the key input parameters of any estima-tion methods.
On the latest meeting of ITU-R WP 5D in January,
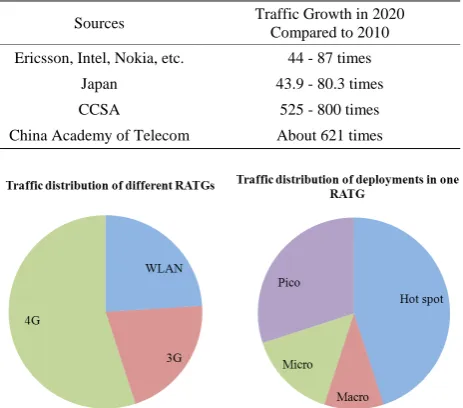
2013, proposal submitted by companies such as Ericsson, Intel, Nokia and etc. shows that there will be a 44 - 87 times traffic increase in 2020 compared with 2010. In the proposal submitted by Japan, it is between 43.9 - 80.3 times. In contrast, China has a greater potential for future traffic development of IMT systems because of its large population. According to CCSA forecast report, the total traffic volume in China is expected to have an increase of 35 - 40 times between 2010 and 2015, and an increase of 15 - 20 times between 2015 and 2020. Similarly, CATR forecasts that the total traffic volume in 2020 will represent a 621 times increase compared with 2010. Traffic fore-cast results show a large span between different sources from countries or organizations, as shown in Table 2.
3.4. Traffic Distribution
Deployment distribution means mapping from the total traffic volume to different radio access technique groups (RATGs), and then to different radio environments (REs) including macro, micro, pico and hotspot cells, which is shown in Figure 4. Different RATGs have different ca-pacity in deploying different cells. Therefore, the same traffic volume with different offloading coefficients will bring greater difference to the final results. For example, if all the traffic is carried out by the macro base stations, the spectrum requirement may be several times more than the spectrum demand when all the traffic is assigned to the hotspot cells. Literatures in the Introduction show that traffic volume of the hotspot cells will account for at least 70% of the total traffic volume. Development of technologies such as “Small cell” will be a continuous impetus to the progress of covering capacity in hotspot
Table 2. Total traffic growth multipliers form different sourcese.
Sources Traffic Growth in 2020
Compared to 2010
Ericsson, Intel, Nokia, etc. 44 - 87 times
Japan 43.9 - 80.3 times
CCSA 525 - 800 times
[image:4.595.308.540.513.717.2]China Academy of Telecom About 621 times
[image:4.595.307.539.513.719.2]cells. These conclusions should be fully considered in the traffic distribution calculation.
3.5. Distribution Ratio of WLAN
As a main broadband wireless access technology group of non-IMT, wireless local area networks (WLAN) has become increasingly prominent in the carrying capacity of the stationary/pedestrian users. Generally, the distribu-tion ratio of WLAN has inverse correladistribu-tion reladistribu-tionship with the spectrum requirements of IMT systems. It is said that, traffic distributed by WLAN will account for 15% - 30% of the total traffic in hotspot cells. In recent years, as WLAN businesses develop rapidly in China, spectrum allocated for WLAN is increasing at the same time. While the convergence trend of future networks has not been fully considered in present estimation methods, traffic distributions of non-IMT wireless access technique groups should be fully taken into account of in the fol-lowing estimation work.
3.6. Base Station Number and Cell Coverage Area
There is no direct contact between the increase of BS number and spectrum requirements. The BS number and cell coverage area are important factors to different traf-fic carrying capacity in different deployment scenarios. If the distribution ratios have been determined, the less the BS number is in each type of deployments, the greater the unit coverage area per BS will be, resulting in the less frequency reuse and the higher demand for spectrum. In a typical urban environment, the coverage distance be-tween different types of BS is shown in Table 3.
In fact, the increasing of BS number should be consi-dered comprehensively. On one hand, further deployment of BS will be difficult in dense urban areas, there may only be hotspot and home base stations in these areas. On the other hand, with the development of suburban and rural areas, although a large number of base stations will be deployed, the new increased BS will not have sub-stantial effects on spectrum requirements, because spec-trum requirement is largely determined by the average demand of the dense urban. Therefore, analysis of BS number increasing should be combined with different deployment scenarios in the estimation methodology.
3.7. Spectrum Efficiency
According to present spectrum requirement estimation methods, it is generally recognized that the spectrum effi-ciency is inversely proportional to spectrum requirements. Spectrum efficiency represents the carrying capacity of unit base station. Theoretical reference values of spec-trum efficiency under different scenarios in 2020 given
by ITU-R are shown in Table 4 [12].
However, spectrum efficiency is restricted by the dif-ficulty of BS deployment and the high complexity of en-vironment in actual application, and is always lower than the reference value. For example, spectrum efficiency of the current commercial 3G system in China reaches only 40% of the former standardized assessment spectral effi-ciency of 3G system.
Therefore, differences between theoretical reference values and actual deployment results should be fully taken into account of in the estimation work.
3.8. Traffic Ratio of Downlink to Uplink
Research from Qualcomm Inc. shows that asymmetry between downlink and uplink mobile data traffic of IMT systems will continue to grow. It suggests that the ratio of downlink to uplink traffic was around 6:1 in 2010 and that this could rise to 10:1 in 2015 [13]. Supplemental downlink (SDL) and time division duplexing (TDD) with different DL/UL configurations can address traffic asym-metry on mobile broadband networks by providing addi-tional downlink capacity.
In order to make it easily understandable, here we give a simple case. Assume that in 2015, there is a 200 MHz demand for downlink traffic, if the spectrum must be deployed symmetrically, the spectrum demand for uplink traffic is also 200 MHz, and the final spectrum demand is 400 MHz. If the SDL and TDD technologies are adopted and the ratio of downlink to uplink traffic will be 10:1 according to the prediction form Qualcomm Inc., then the spectrum demand for uplink traffic may decline to 40 MHz when taking into account of factors such as the differences between frequency division duplexing (FDD) and TDD technologies and the control of channel over-head. So the final spectrum demands might be only about 240 MHz, where the spectrum resources are greatly saved. Therefore, the development of new technologies aimed at solving traffic asymmetry should be fully considered.
Table 3. Coverage distance between different types of base station.
BS types Coverage radius (m)
Macro cell about 400
Micro cell about 200
Pico cell about 40
[image:5.595.307.538.592.665.2]Hot spot about 10
Table 4. Spectrum efficiency of urban areas in 2020.
Spectrum efficiency (bps/Hz) Macro Micro Pico Hot spot
3G Urban 2 4 4 4
[image:5.595.307.539.693.737.2]4. Conclusion
It is necessary that spectrum resources are allocated scien- tifically and reasonably, so as to achieve further devel-opments of technologies and industries, as well as better resource utilizations. Spectrum resources are greatly de-manded by IMT systems, which are the main bearers of future mobile communications. Reasonable estimation and assessment of spectrum requirements are important to the development of mobile communication systems. In this paper, the key factors in the estimation methodology are summarized on the basis of analysis of current work in order to better combine the following estimation work with the practical situation of China.
5. Acknowledgements
This work is supported by Chinese National Key Project under Grant No. 2012ZX03003004 and No. 2012ZX03 006-003-003.
REFERENCES
[1] Report ITU-R M.2243, “Assessment of the Global Mo-bile Broadband Deployments and Forecasts for Interna-tional Mobile Telecommunications,” 2011.
[2] D. Mavrakis and M. Kamal-Saadi, “Mobile Broadband Access at Home: The Business Case for Femtocells, UMA and IMS/VCC Dual Mode Solutions,” Informa Te-lecoms and Media, 2008.
[3] S. Carlaw, “IPR and the Potential Effect on Femtocell
Markets,” FemtoCells Europe, London, 2008.
[4] G. Mansfield, “Femto Cells in the US Market-Business Drivers and Consumer Propositions,” Femto Cells Europe, ATT, London, 2008.
[5] 3GPP Technical Report TR 36.814 v9.0.0, “Further Ad- vancements for E-UTRA Physical Layer Aspects,” 2010. [6] Report ITU-R M.1768, “Methodology for Calculation of
Spectrum Requirements for the Future Development of the Terrestrial Component of IMT-2000 and Systems beyond IMT-2000,” 2006.
[7] Federal Communications Commission, “Mobile Broad-band: The Benefits of Additional Spectrum,” 2010. [8] Russian Federation, “Document 5D/118-E, Future IMT
Spectrum Requirements Assessment for the Russian Fed-eration”.
[9] GSMA, “A New Model for Spectrum ESTIMATION,” 2012.
[10] B. Nie, Z. Y. Feng, Z. B. Feng and X. G. Song, “Fre-quency Planning of IMT Systems Based on the Hierar-chical Spectrum Demand Forecast,” Telecommunications Science, 2012.
[11] China’s Ministry of Industry and Telecommunications Research Institute, “Spectrum Requirements Estimation of IMT Systems,” 57th Meeting of CCSA TC5 WG8. [12] Report ITU-R M.2078, “Estimated Spectrum Bandwidth
Requirements for the Future Development of IMT-2000 and IMT-Advanced,” 2006.
![Figure 1. Predicted future traffic growth of wireless com-munications [1].](https://thumb-us.123doks.com/thumbv2/123dok_us/7865970.737778/1.595.312.538.564.713/figure-predicted-future-traffic-growth-wireless-com-munications.webp)