Munich Personal RePEc Archive
Doha Round Impacts on India: A Study
in a Sequential Dynamic CGE
Framework
Raihan, Selim and Khondker, Bazlul Haque
South Asian Network on Economic Modeling (SANEM),
Department of Economics, University of Dhaka, Bangladesh
February 2010
Revised Draft
D
OHA
R
OUND
I
MPACTS ON
I
NDIA
:
A
S
TUDY IN A
S
EQUENTIAL
D
YNAMIC
CGE
F
RAMEWORK
Selim Raihan
1Bazlul Haque Khondker
2February 2010
1
Associate Professor, Department of Economics, University of Dhaka, Bangladesh. [email protected]
2
1
C
ONTENT
Executive Summary 2
Chapter One: Introduction 12
Chapter Two: The Doha Round Issues for India 14
Chapter Three: Overview of Indian Economy 23
Chapter Four: Description of the Data 27
Chapter Five: Description of the Model 31
Chapter Six: The Impact of Agricultural Liberalization 35
Chapter Seven: The Impact of NAMA 41
Chapter Eight: The Impact of Full Doha Scenario 46
Chapter Nine: The Impact of Services Liberalization 52
Chapter Ten: Conclusion 56
Annex 1: Description of the India SAM 2006 59
Annex 2: Description of the India Dynamic CGE Model 91
Annex 3: Detailed Results of Agricultural Liberalisation 97
Annex 4: Detailed Results of NAMA Liberalisation 99
2
E
XECUTIVE
S
UMMARY
Background
• The Doha Round of negotiations by the WTO (World Trade Organisation) Members will have profound and far-reaching impact on developing countries like India. Doha negotiations target especially agriculture and manufacturing sectors, and India, being a developing country, is likely to have important implications of such negotiations.
• The general objective of this research is to examine the impact of Doha round negotiations on the economy of India. The specific objectives are to examine the impact of agricultural trade liberalisation under the Doha negotiations, to examine the impact of NAMA negations, to explore the combined effect of agricultural and NAMA negotiations, and to examine the impact of liberalisation of the domestic services sectors.
• With a view to addressing these important issues, this study examines the effects of Doha agreement for India in a sequential dynamic computable general equilibrium (CGE) framework. We develop the first dynamic CGE model for India. The Social Accounting Matrix has also been updated for year 2006. The dynamic CGE model takes into account accumulation effects and thus allows long-run poverty analysis. In addition, it enables to track the adjustment path of the economy, which may include substantial effects on poverty. All these effects are analysed by comparing the business-as-usual scenario and the impacts of different policy scenarios.
Issues in WTO Doha Negotiations for India
• Agriculture has been at the centre stage of multilateral trade negotiations during the past 20 years. Several studies predict that, with the elimination of export and production subsidies, prices of agricultural commodities are likely to increase. Rise in prices following liberalisation will be, on the whole, welfare-enhancing for a net-exporter country, while for a net-importer country this will be translated into a terms of trade shock with adverse welfare consequences. India is a net exporter of many agricultural commodities. India was among the top 15 exporters of agricultural products and in 2007 India registered a 1.4 percent share of world exports of agricultural products.
3
terms of both market access in developed countries’ markets and domestic trade liberalisation in the manufacturing sectors. In 2007, India was among the top 15 exporters of manufacturing products and it registered a 1.0 percent share of world exports of manufacturing products in that year.
• In present day world services sector is the fastest growing sector of the global economy and it accounts for two thirds of global output, 30 percent of global employment and 20 percent of global trade. Services sector was not included in the world trade negotiation process till the inception of Uruguay Round. Commencement of General Agreement on Trade in Services (GATS) in world trade negotiation is relatively a recent phenomenon. GATS is the first initiative with the aim of progressive liberalisation of trade in services. After the inception of GATS, services trade is getting the importance in WTO multilateral trade negotiations. Services trade liberalisation has also important implications for India. It appears that for almost all broad services categories, India was among the top 15 countries in the world in 2007.
Overview of the Indian Economy
• The structure of the Indian economy has undergone significant changes since the 1980s with the share of agriculture in GDP declining to about half in 2006. The agriculture sector, for so long the mainstay of the Indian economy, now accounts for only about 20 per cent of GDP, yet employs over 50 per cent of the population. The average rate of GDP growth since the 1980s has been 5.82 per cent per year with wide variations over different sub-periods. There have been some remarkable growth performances during the 2003 and 2006 when the GDP growth rate exceeded 8 percent level.
• The growth performance over the period was underpinned by relatively steady rates of savings, investment and improvements in other macroeconomic indicators. As a share of GDP, investment increased to 34 per cent in 2006 along with increases in domestic and national savings. The changes in the external sector were significant. The share of exports of goods and services in GDP rose to 23 per cent in 2006 from only 6 per cent in early 1980s. On the other hand, the share of imports of goods and services in GDP rose from only 8.7 percent in 1981 to around 26 percent in 2006.
• India undertook significant liberalisation of trade during the 1990s. Average tariff rate was as high as 100 percent in 1986, which came down to 14 percent in 2007. There has also been substantial reduction in the import-weighted average rate during this period. The highest rate of duty was declined from 335 percent in 1990-91 to 35 percent in 2000- 01. It is noted that tariffs on consumer goods were drastically reduced as compared to tariffs on intermediate and capital goods.
4 • The trade basket, however, indicates an increasing concentration of manufactured
goods accounting for 70 per cent of total merchandise exports in 2005. The shares of food and agricultural raw materials in total exports were reduced over time. In the case of imports, manufacturing accounts for slightly more than 50 percent of total imports and its share has increased over time. Fuels account for more than one third of the total imports. The shares of food and agricultural raw materials have declined over time.
• Considering head count poverty ratio for rural and urban India since 1973-74, it can be seen that rural poverty has always been higher than urban poverty until late 1990s. Approximately 80 percent of the total poor live in rural areas. There has generally been a reduction in poverty over the last three decades of so both in the rural and urban areas. However, the reduction was sharp between 1993-94 and 1999-00 largely due to an increase in GDP growth rate. Interestingly during 2001 and 2006, the reduction in rural head-count poverty has been remarkable whilst the reduction in urban poverty has been rather modest. In the case of inequality, both rural and urban Gini coefficients increased in the period between 1993-1994 and 1997, and declined between 1997 and 1999-2000.
Data and the Dynamic CGE Model
• In this study, the dynamic CGE model is be numerically calibrated to a recent an updated Social Accounting Matrix (SAM) of India. We worked on the latest available SAM for India for the year 2004 and updated it for 2006. We have updated the SAM for 73 sectors. For the modelling purpose, we use an aggregated version of SAM that includes 29 sectors, four factors of production: skilled and unskilled labour, agricultural and non-agricultural capital. An important feature of the SAM is the decomposition of the households into nine representative groups. Households are classified in terms of location: urban and rural. In case of both rural and urban households occupation is the main criterion to differentiate household groups.
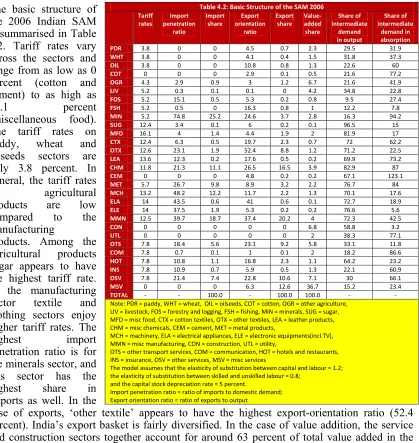
• The basic structure of the 2006 Indian SAM suggests that tariff rates vary across the sectors and range from as low as 0 percent (cotton and cement) to as high as 16.1 percent (miscellaneous food). The tariff rates on paddy, wheat and oilseeds sectors are only 3.8 percent. In general, the tariff rates on agricultural products are low compared to the manufacturing products. Among the agricultural products ‘sugar’ appears to have the highest tariff rate. In the manufacturing sector textile and clothing sectors enjoy higher tariff rates. The highest import penetration ratio is for the minerals sector, and this sector has the highest share in imports as well. In the case of exports, ‘other textile’ appears to have the highest export-orientation ratio (52.4 percent). India’s export basket is fairly diversified. In the case of value addition, the service and construction sectors together account for around 63 percent of total value added in the economy. The aggregate agricultural and the manufacturing sectors contribute 18 percent and 19 percent of the total value added respectively. The share of intermediate consumption in total demand is highest for the sugar sector.
5
remuneration. In the rural areas, agricultural labour and rural other labour households are heavily dependent on unskilled labour income. In contrast, rural non-agricultural self employed households derive incomes mostly from two sources: skilled labour and agricultural capital. The rural other households are heavily dependent on non-agricultural capital income. In the urban area the casual labour households derive more than three-fourth of their income from unskilled labour whereas urban salaried class household derive around two-third of their income from skilled labour. For the urban other households and urban self employed households income from the non-agricultural capital seem to be significant. For some household categories, like rural non-agricultural self employed households, rural agricultural self employed households, urban self employed households and urban other households, public transfer is also an important source of income. For the urban self employed households, urban other households and rural other households, remittance constitutes a notable share in their income. These considerable differences in income sources for different households are expected to generate varying income and poverty effects when different policy shocks are introduced in the model.
• The consumption composition of households, as derived from the SAM 2006, shows that, on average, agricultural commodities account for 40 percent of the consumption of the households. However, this share is around 45 percent for the rural households whereas, for the urban households the share is only 30 percent. For both rural agricultural labour and rural other labour this share is around 52 percent. It is also observed that the shares of non-food items are considerably high among the urban households. These differences in the consumption composition for different households are expected to cause varying consumption effects as a result of different policy shocks.
• A dynamic CGE model is constructed. The representative household approach is followed and the information of Household Expenditure Survey (HES) of India for 2006-06 is used to subsequently estimate poverty effects of different trade policy shocks. It is also important to mention here that initially the Doha scenarios are generated using the global general equilibrium model, namely the GTAP model. Then the price results obtained from the GTAP model are introduced as part of the shocks in the Indian dynamic CGE model.
Agricultural Trade Liberalisation under Doha
6
sectors would experience some rise in export prices. On the other hand, all these sectors would face rise in import prices.
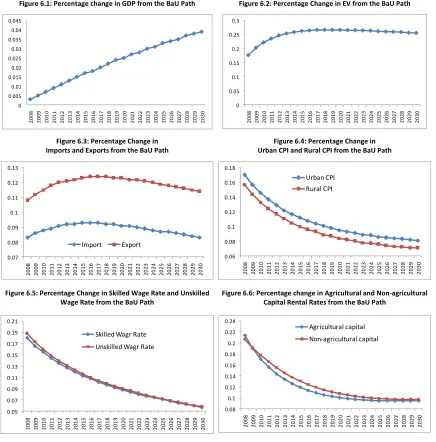
• The simulation results from the dynamic CGE model for India suggest that the impacts on GDP and welfare are positive both in the short and long run. The impact of the Doha agricultural scenario on real GDP appears to be very small. The small impact on GDP can be explained by the fact that the simulation generated two types of opposite shocks in the economy. Head-count poverty appears to decline both in the short and long run and the long run effect is more prominent. On the one hand, because of the export price rise there would be a rise in exports from different sectors which would also lead to rise in production. On the other hand, because of domestic trade liberalization in the agricultural sectors the there would be rise in imports which might lead to fall in domestic production. The net effect will depend on the relative strength of these two effects will certainly the rise in import prices shock in the economy There are also some small but positive impacts on imports and exports in the short run and they increase further in the long run. The rural and urban consumer price indices would experience some rise in the short run though the extent rise tend to lessened in the long run. Skilled and unskilled wage rates rise, although less so in the long run when capital is reallocated toward the expanding sectors. The rise in unskilled wage rates is somewhat larger, given the expansion of unskilled labour– intensive agricultural sectors. The agricultural capital rental rate increases more than the non-agricultural capital rental rate in the short run, and they eventually decline.
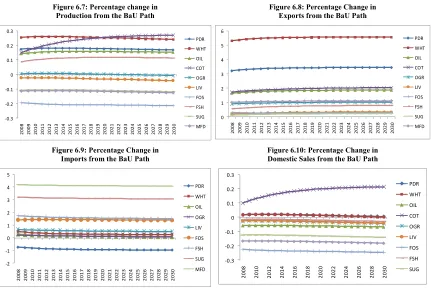
• Tariff elimination leads to an immediate reduction in the domestic price of imports of all agricultural commodities, except paddy, that is proportional to the initial sectoral tariff rates. Domestic consumers respond by increasing import demand, once again in rough proportion to the fall in import prices, with the strongest increases in the sugar and miscellaneous food. Because of the general equilibrium effect, the manufacturing and services sub-sectors are also affected. It appears that since only the agricultural sub-sectors have been liberalized, the protection on the non-agricultural sectors make these sectors profitable for increased investment. The export response is generally smaller in the long run. With a negative sloping demand curve for exports and rising world price of exports, FOB export prices rise. As a result of the rise in export demand, sectoral outputs expand in paddy, wheat, oilseeds and cotton sectors in the short run and they increase further in the long run compared to the BaU path. Production of cotton would expand on an increasing trend during the period under consideration. All other agricultural sectors would however experience fall in production despite the fact that their export demand also rise. It is due to rise in imports as a result of tariff liberalization in these sectors.
• As the four major agricultural sectors (paddy, wheat, oil seeds and cotton) expand they also attract increased investment into their sectors. In the short run the highest percentage rise in investment is observed to be in the wheat sector followed by the paddy sector. However, in the long run the percentage deviation of investment from the BaU appears to be lessened. Because of increased investment in those aforementioned four agricultural sectors, resources are also reallocated from other contracting sectors to these sectors.
7
these households derive substantial income from land, and the rate of return on land increases more than the rate of return on any other factor of production. However, the rate of change in CPI is also high for this category of households. Both in the short and long run, real consumption increases for all households as nominal income rises more than consumer prices. All the household categories also experience rise in EVs both in the short and long run and the rural agricultural labour and rural other labour would emerge as the biggest winners.
• In the short run, head-count poverty declines for all households. Also the depth of poverty and the severity of poverty decrease in the short run and they decline further in the long run. Poverty indices fall more for the poorer households. It suggests that accumulation effects captured by the model play a major role in alleviating poverty.
NAMA Trade Liberalisation under Doha
• Using the GTAP model we simulate a moderate Doha- NAMA scenario where developed countries cut their industrial tariffs by 36 percent whereas the developing countries, including India, cut their tariffs by 24 percent. It appears from the GTAP simulation results that because of the tariff cut on non-agricultural commodities all the industrial commodities experience fall in world export price. The highest fall in export price is observed for the machinery sub-sector. Also, because of sectoral interlinkages the export prices of agricultural and services sub-sectors would also decline. On the other hand, import prices of all manufacturing commodities decline whereas those of agricultural sectors increase. The largest fall in import prices is observed in the other textile sector.
• The simulation results from the dynamic CGE model for India suggest that the NAMA scenario would lead to a rise in real GDP for India. However, aggregate welfare would fall both in the short and long run. The reason would be because of the fact that all the factor returns fall more than the fall in consumer price indices both in the rural and urban areas. The negative effect on welfare, however, appears to be less prominent in the long run. It appears that imports and export would experience some positive growth both in the short and long run and the growth in exports would be higher than that of imports. Contrary to the agricultural liberalization, CPIs, both in the rural and urban areas, would fall and though their effects are slightly lessened in the long run. All the factor returns also experience negative growth and the fall in non-agricultural capital rental rate appears the highest among all these factors.
8 • Because of increased flow of imports, output shrinks in most of the manufacturing
sectors except cotton textile and other textile. Under such a scenario, the expanding sectors are only two manufacturing sectors: cotton textile and other textile. Though the leather sector would experience slight fall in production, its exports would rise, which would be facilitated decreased domestic sales of leather products. The largest percentage fall in production in the manufacturing sector appears to be for the machinery sub-sector followed by electrical goods. The effects on production (either positive or negative) are more prominent in the long run. Among the agricultural and services sectors some sub-sectors would gain out of this scenario, especially, cotton, oilseeds, transport services and other services.
• As a result of the expansion of the textile sector non-agricultural capital and labour migrate to this sector and away from the other manufacturing sectors, with relatively little movement in the agricultural and services sectors. In the long run, the non-agricultural capital stock response is much larger and tempers the reallocation of skilled and unskilled labour. Investment in the textile sector also increases though the percentage rise appears to be narrowed in the long run. The average returns to capital fall slightly more in the non-agricultural sector, although these rates converge after long-term adjustment in sectoral investment rates.
• Under the NAMA scenario, a fall in nominal income for all households is observed in both the short run and the long run. This reduction is the highest among rural other households and smallest among urban other households. There are also reductions in the consumer price indices for all household categories. However, the fall in incomes is much higher than the fall in CPIs which suggests a decline in real consumption for these household categories. The changes in EVs are also in line with the changes in real consumption. It appears that in the rural areas rural other labour and in the urban area urban casual labour are the worst sufferer. The long run negative effects on EVs are much smaller than the short run effects.
• All household categories would experience rise in head-count poverty both in the short and long run, though the long run effects are smaller than the short run effects. In the rural area rural other households and in the urban area urban casual labour would experience the largest rise in head-count poverty. For all household categories poverty gap and poverty depth also increase and again the rural other households and urban casual labour are the worst sufferer.
Full Doha Scenario
• It appears from the analysis on agricultural trade liberalisation and NAMA liberalisation that agricultural trade liberalisation under the Doha round would be beneficial whereas the NAMA scenario would have negative effects as far as the poverty and welfare impacts are concerned in the context of the Indian economy. However, it should be mentioned here that under the WTO’s Doha round of negotiations the agricultural and NAMA liberalisation would be executed under a single undertaking. Therefore, it is more plausible to examine the joint effects of these two scenarios on the Indian economy.
9
developing countries, including India, cut their agricultural and industrial tariffs by 24 percent. In addition, both the developed and developing countries carry out a one-third reduction in domestic agricultural subsidies and a complete elimination of agricultural export subsidies. It appears from the GTAP simulation results that all the agricultural products would experience rise in their prices in the world market. With respect to the export price, because of combined effects of agriculture and NAMA liberalisation, the export price changes of the manufacturing products are less prominent than those under the NAMA scenario. In contrast, the import price changes are relatively higher than those under the NAMA scenario.
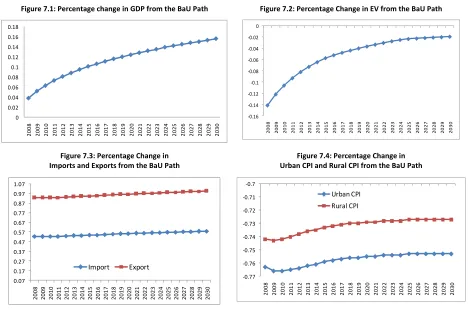
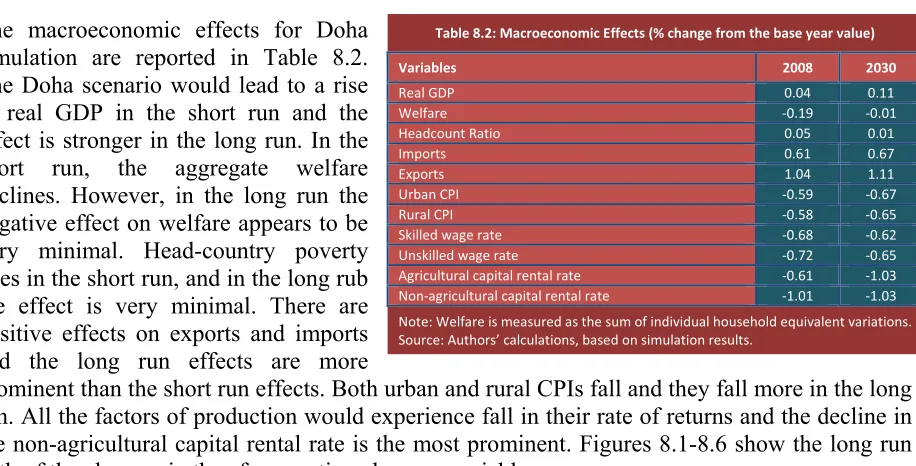
• The simulation results from the dynamic CGE model for India suggest that the Doha scenario would lead to a rise in real GDP in the short run and the effect is stronger in the long run. In the short run, the aggregate welfare declines. However, in the long run the negative effect on welfare appears to be very minimal. Head-country poverty rises in the short run, and in the long rub the effect is very minimal. There are positive effects on exports and imports and the long run effects are more prominent than the short run effects. Both urban and rural CPIs fall and they fall more in the long run. All the factors of production would experience fall in their rate of returns and the decline in the non-agricultural capital rental rate is the most prominent.
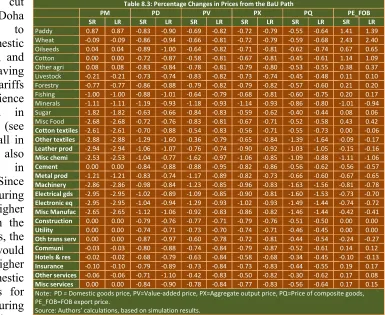
• Domestic tariff cut under the Doha scenario leads to reduction in domestic prices of imports, and the sectors having higher initial tariffs tend to experience higher reduction in import prices. The fall in import prices also leads to fall in domestic prices. Since the manufacturing sectors have higher initial tariffs than the agricultural sectors, the Doha scenario would result in higher reduction in domestic prices of imports for the manufacturing sectors compared to the agricultural sectors. The price of value-added and producer prices fall for all sectors and the manufacturing sector in general experience higher fall in value-added prices and producer prices.
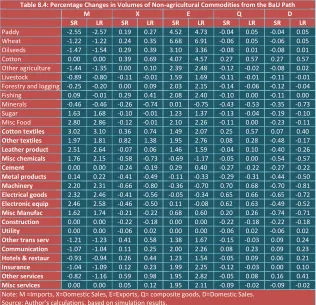
• In general, the agricultural sectors and the services sectors and a few sectors in the manufacturing, namely textile sectors, are the beneficiaries of this scenario. In contrast, production contracts in most of the manufacturing sectors. As a result, non-agricultural capital and labour migrate to the textile and garments sectors and away from the other manufacturing sectors, with relatively little movement in the agricultural sectors. The long run effects are more prominent than those of short run. In the long run, the non-agricultural capital stock response is much larger and tempers the reallocation of skilled and unskilled labour. There are also moderate capital stock increases in the agricultural and service sectors.
• Among the agricultural sectors the most expanding sub-sector appears to be the cotton sector, whereas in the manufacturing sector output expands mostly in the other textile sub-sector. The largest reduction in output would be seen in the machinery sector. As result of increased demand in the expanding sub-sectors in agriculture and manufacturing, a number of services sectors also expand and the largest expansion would be seen in other services sub-sector.
10
largest rise in demand for the factors. Also, the services sub-sectors would see increased demand for the factors. All other contracting sectors would however confront reduction in demand for factors. The long run effects of demand for skilled and unskilled labour seem to be higher than the short run effects. However, the long run effects of demand for capital appear to be higher than the short run effects. Since in the long run the rate of return to capital declines more than the fall in rate of return to labour categories. All the expanding sectors would also see increased investment while the contracting sector would experience fall in investment. The long run effects of investment appear to be smaller than the short run effects.
• Under the Doha scenario, a fall in nominal income for all households is observed in both the short run and the long run. In the rural area this reduction is smallest among rural agricultural labor and, in the urban area among the urban other households. The consumer price indices also decline both in the short and long run though the long run impacts are stronger than the short run impacts. Since the fall in the is larger than the fall in CPIs, all households, in the short run, would experience negative growth in real consumption, However, in the long run, for some household categories, like rural agricultural labour, urban self employed, urban salaried class and urban other households, the fall in income would be lower than the fall in CPIs, and therefore they would experience rise in real consumption. The figures of EVs are very much in line with real consumption growth.
• It appears that a full Doha scenario would result in a rise in head-count poverty for all household categories in the short run, though the long run effects are much less pronounced, and in fact for some household categories, head-count poverty declines in the long run. In the rural area, rural agricultural labour and in the urban area urban self employed, urban salaried class and urban other households would experience fall in head-count poverty in the long run. Among these household groups, the fall in head-count poverty appears to be most prominent for the urban other households. The poverty gap and squared poverty gap indices also suggest similar pattern as is observed for the head-count poverty.
Services Trade Liberalisation
• Services trade liberalisation is one of the major areas of negotiations under the Doha round. However, there are difficulties in modelling services trade liberalisation because of the lack of data on the protection of services sector. Given this context, we have considered a simple approach to model the services protection in Indian economy and we have examined the impact of liberalisation of this protection on the Indian economy using the dynamic CGE model for India. There are many forms of barriers and protection in the services trade and it is very difficult to quantify them. In the current exercise we assume that five services sectors (where there are imports of services) have a tariff equivalent protection equal to the average tariff rate on the manufacturing and agricultural sectors and we simulate a full liberalisation of these protections. In addition we also assume that along with the liberalisation there would be a 10 percent rise in foreign direct investment into these services sectors.
11
declines further in the long run. Exports and imports register positive growth in the short run and some larger growth in the long run. The consumer prices indices, both for the rural and urban households decline. All the factors returns would register negative growth and their long run deviations from the BaU path appear to be larger than the short run deviations.
• Because of the removal of restriction on import in the services sectors the import prices as well as the domestic prices in these sectors fall. As a result of the sectoral inter-linkages, and because of the fact that the rate of factor returns have declined, domestic prices in most of the manufacturing and agricultural sectors fall. The value-added price fall in lesser extents for the services sectors in general because of the increased flow of foreign direct investments into these sectors. The FOB export prices also fall for most of the sectors which indicates rise in export competitiveness for the export-oriented sectors.
• The services trade liberalisation scenario would entail two opposite effects. Because of trade liberalization domestic services sectors would tend to contract. On the other hand, because of increased flow of FDI into these sectors these sectors would expand. The net impact would depend on the relative strength of these two effects. It appears that the services sectors under consideration expand both in the short and long run, which suggests much stronger impact of the later effects. Exports from these services sectors also increase. Because of the rise in competitiveness in general we also observe increased export performance from some of the agricultural and manufacturing sectors.
• Liberalization in the services trade, along with increased flow of foreign direct investment, results in rise in net investments into these sectors. There are also increased demands for skilled and unskilled labour as well capital in these sectors. As a result, some of the sectors with weaker linkages with the services sectors experience contraction and reduced demand for the factors of production. Among the services sectors, the largest rise in investment would be in other services. This sector would also experience higher increased demand for factors compared to any other sectors.
• The nominal incomes of the households as well as the CPIs fall both in the short and long run. However, the reductions in incomes are smaller than the fall in CPIs, which suggests rise in real consumption of the households. The figures of EVs are very much in line with real consumption growth. All household categories would register rise in EVs both in the short and long run. In the short run, rural other households and urban other households would experience the largest rise in EVs compared to the BaU path. However, in the long run, urban other households would register the largest rise in EV.
12
C
HAPTER
1:
I
NTRODUCTION
1.1. Background
International trade is a strong instrument for development. This is equally important when it comes to the ongoing WTO Doha Development Round. The Doha Round of negotiations by the WTO Members will have profound and far-reaching impact on developing countries like India. The Doha Round of negotiations have at least three very important components from India’s perspective: agricultural trade liberalisation, liberalisation of the manufacturing sector, and liberalisation of the services sector. With respect to the negotiations on global agricultural trade liberalisation, a number of studies have predicted that, with the elimination of export and production subsidies, prices of agricultural commodities are likely to increase in the international market. This will be beneficial to a number of developing countries that have clear comparative advantage in this sector. Liberalisation will also imply further market access opportunities for these countries as a result of reduced tariff barriers in the developed country markets. India, being a net exporter of agricultural commodities, is likely to gain from such liberalisation. WTO negotiations with respect to the NAMA negotiations are proceeding towards the elimination or the reduction of bound tariff rates, bringing unbound tariff rates under binding commitments which will be subject to formula cuts, and identifying and removing Non-tariff Barriers (NTBs). The important considerations under the NAMA negotiations are the extent and modalities of tariff cut for industrial goods in order to reduce and ultimately eliminate high bound tariffs rates, tariff peaks and tariff escalation. The NAMA liberalisation is likely to have important implications for India in terms of both market access in developed countries’ markets and domestic trade liberalisation in the manufacturing sectors. Finally, negotiations on services trade liberalisation under GATS also have important implications for India as India has important offensive and defensive interests in a number of services sectors.
To address these important issues, this study examines the poverty effects on India of the Doha agreement in a sequential dynamic computable general equilibrium framework, which takes into account accumulation effects and long-run poverty analysis. In addition, the model tracks the adjustment path of the Indian economy, which may include substantial effects on poverty. All these effects are analysed by comparing the business-as-usual scenario and the impacts of different policy scenarios.
13 1.2. Objective of the Research
The general objective of this research is to examine the impact of Doha round negotiations on the economy of India. The specific objectives are as follows:
- To examine the separated impacts of agricultural trade liberalisation on India under the Doha negotiations
- To examine the separated impacts of NAMA negations on India under Doha negotiations
- To assess the combined effects of agricultural and NAMA negotiations
- To examine the impacts of liberalisation of the domestic services sectors in the context of the Indian economy.
1.3. Methodology
Like any other useful work, the research has reviewed the relevant literature, data analysis, and discussions with the concerned stakeholders. In addition, a strong analytical framework is incorporated to provide credible results and thereby to promote informed policy analysis. The application of this kind of methodology means use of simulation exercises based on general equilibrium models.
Effective policy negotiations partly depend on the policymakers’ (negotiators’) a priori assessment about the implications arising from different negotiation outcomes. Therefore, it is very important to provide the policymakers with ex ante analysis of alternative scenarios. For example, for a net-agriculture exporting developing country like India, it is crucial for its negotiators to have a clear idea about the potential implications of agriculture trade liberalization (or, for that matter any other liberalisation scheme) under the WTO-led multilateral trade negotiations. These types of ex-ante analyses have been undertaken in the current research. A global general equilibrium model and a country-specific CGE model for India have been used to simulate the effects arising from alternative negotiating outcomes for India. The Social Accounting Matrix has also been updated for year 2006.
1.4. Outline of the Report
14
C
HAPTER
2:
T
HE
D
OHA
R
OUND
I
SSUES FOR
I
NDIA
2.1. Introduction
The Doha Round of negotiations involves developed-country reforms that have at least three very important components from India’s perspective: agricultural trade liberalisation, liberalisation of the manufacturing sector, and services trade liberalisation. Furthermore, the implementation of the Doha Round agreement will require domestic reforms in India, notably in the area of trade liberalisation. Thus, the objectives of this study will be to analyse poverty and other economic impacts of these issues. They are discussed below.
2.2. Agricultural Trade Liberalisation
Agriculture has been at the centre stage of multilateral trade negotiations during the past 20 years. Despite having a major progress in improving the rules for trade, the overall achievement in terms of increasing market access for agricultural goods was considered to be ‘disappointing’ at the end of the Uruguay Round (Martin and Winters, 1996). Although under the WTO Agreement on Agriculture members committed to carrying on reforms, not much progress has so far been made in further opening-up of the markets. Nevertheless, agriculture continues to be an active area of negotiation. While the modalities for future liberalisation in the sector are being negotiated, the potential implications arising from such liberalisation have drawn a lot of attention. Several studies (e.g., Hertel et al., 2000; Diao et al., 2001;
Beghin et al., 2002; Elbehri and Leetmaa, 2002; van Meijl and van Tongeren, 2001;
Dimaranan et al., 2003; Francois et al., 2003) predict that, with the elimination of export and production subsidies, prices of agricultural commodities are likely to increase. This will be beneficial to a number of developing countries that have clear comparative advantage in the sector. Liberalisation will also imply further market access opportunities for these countries as a result of reduced tariff barriers in the developed country markets.
15 out to be the looser (Panagariya 2002). There are competing predictions about such impact based on simulation results of various global trade models. Some studies foresee expansion of world trade, real output, wages and incomes in developing countries (Beghin et al. 2002, Conforti and Salvatici 2004, Polaski, 2006). On the other hand, some studies raise concerns about potential negative impact for the net food importing countries (François et al. 2003, Fabiosa et al. 2003).
2.2.1. World Agricultural Trade: Where does India Stand?
There have been fluctuations in the world trade in agricultural products over the last two decades (Figure 2.1). However, in recent time there has been an increasing trend in the world trade in agricultural products. During the first half of 1990s there was a positive rate of growth which turned into a negative growth during the second half. During 2000 and 2007 the annual average growth rate in agricultural trade was 13 percent which was mainly due to considerably higher growth rate in later years of that period. Especially, from 2005 the growth rate in agricultural trade has been more than doubled and in 2007 the growth rate stood at 19 percent.
It also appears that agricultural products constitute a sizeable share in world merchandise exports (Table 2.1). In 2007, the trade in agriculture was around 1128 billion US$ which was around 30 percent of
the world exports of primary products. However, in terms of the share in total world merchandise exports the share was only 8.3 percent.
It appears from Table 2.2 that in the case of the share of agricultural exports in total regional merchandise exports Latin American countries’ has the highest share (25.1 percent). The Asian countries, on average, have lower export-orientation in agricultural products compared to all the regions except the Middle East. On the other hand, in the case of imports, the Asian countries, on average, have lower import-orientation in agricultural products compared all the regions except the North America. The African countries, on average, appear to have the highest import-orientation as far as the agricultural imports are concerned.
Figure 2.1: Growth in World Agricultural Trade (%)
‐2 9
7
‐1 13
8 11
19
1
980
‐
85
1
985
‐
90
1
990
‐
95
1
995
‐
00
2
000
‐
07
20
05
20
06
20
07
Source: International Trade Statistics 2008
Table 2.1: World Trade in Agricultural Products, 2007
Value in 2007 1127.7 $bn
Share in world merchandise trade % 8.3 Share in world exports of primary products % 29.8 Source: International Trade Statistics 2008
Table 2.2: Agricultural products’ share in trade, by region, 2007
Share in total
merchandise trade, % Exports Imports
World 8.3 8.3
North America 9.6 6.0
South and Central America 25.1 8.7
Europe 9.0 9.2
CIS 7.6 10.9
Africa 8.1 14.0
Middle East 2.5 10.2
Asia 5.6 7.4
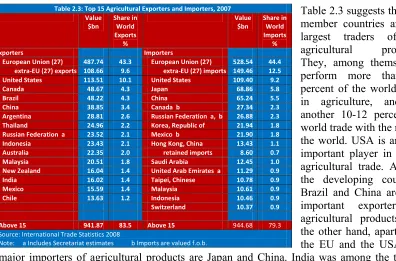
16 Table 2.3 suggests that EU member countries are the largest traders of the agricultural products. They, among themselves, perform more than 43 percent of the world trade in agriculture, and do another 10-12 percent of world trade with the rest of the world. USA is another important player in world agricultural trade. Among the developing countries Brazil and China are also important exporters of agricultural products. On the other hand, apart from the EU and the USA, the major importers of agricultural products are Japan and China. India was among the top 15 exporters of agricultural products and in 2007 India registered a 1.4 percent share of world exports of agricultural products.
India is a net exporter of many agricultural commodities. To give one example, consider the case of rice. Rice is one the most important crops in India. It is by far the staple food for a large number of people and the major means of livelihood for millions of farm households in the country. Table 2.4 suggests that though India is the second biggest rice consuming country in the world it also the second largest rice producing and exporting country in the world. Therefore, if global agricultural trade liberalisation, as envisaged by the Doha round of
negotiations, results in rise in the price of rice in the world market, being a net exporter of rice, India is likely to gain from such liberalisation.
2.2.2. Negotiations on Global Agricultural Trade Liberalisation
In WTO terminology, subsidies in general are identified by “boxes” which are given the colours of traffic lights: green (permitted), amber (slow down — i.e. be reduced), red (forbidden). In agriculture, things are, as usual, more complicated. The Agriculture Agreement has no red box, although domestic support exceeding the reduction commitment levels in the amber box is prohibited; and there is a blue box for subsidies that are tied to
Table 2.3: Top 15 Agricultural Exporters and Importers, 2007 Value
$bn
Share in World Exports %
Value $bn
Share in World Imports %
Exporters Importers
European Union (27) 487.74 43.3 European Union (27) 528.54 44.4 extra‐EU (27) exports 108.66 9.6 extra‐EU (27) imports 149.46 12.5 United States 113.51 10.1 United States 109.40 9.2 Canada 48.67 4.3 Japan 68.86 5.8 Brazil 48.22 4.3 China 65.24 5.5 China 38.85 3.4 Canada b 27.34 2.3 Argentina 28.81 2.6 Russian Federation a, b 26.88 2.3 Thailand 24.96 2.2 Korea, Republic of 21.94 1.8 Russian Federation a 23.52 2.1 Mexico b 21.90 1.8 Indonesia 23.43 2.1 Hong Kong, China 13.43 1.1 Australia 22.35 2.0 retained imports 8.60 0.7 Malaysia 20.51 1.8 Saudi Arabia 12.45 1.0 New Zealand 16.04 1.4 United Arab Emirates a 11.29 0.9 India 16.02 1.4 Taipei, Chinese 10.78 0.9 Mexico 15.59 1.4 Malaysia 10.61 0.9 Chile 13.63 1.2 Indonesia 10.46 0.9 Switzerland 10.37 0.9
Above 15 941.87 83.5 Above 15 944.68 79.3 Source: International Trade Statistics 2008
[image:18.612.95.491.90.351.2]Note: a Includes Secretariat estimates b Imports are valued f.o.b.
Table 2.4: Leading Countries in Production, Consumption, Exports and Imports of rice in 2003
Rank Producing Consuming Exporting Importing
1 China China Thailand Indonesia
2 India India India Nigeria
3 Indonesia Indonesia Vietnam Bangladesh
4 Bangladesh Bangladesh United States Iran
5 Vietnam Vietnam China Philippines
6 Thailand Japan Pakistan Brazil
7 Japan Thailand Uruguay Iraq
8 Myanmar Myanmar Argentina Saudi Arabia
9 Philippines Philippines Egypt EU
10 Brazil Brazil Myanmar Senegal
11 United States Korea, Rep. of Australia China 12 Korea, Rep. of United States Japan South Africa
13 Pakistan Nigeria EU Co^te d´ Ivory
14 Egypt Egypt Guyana Malaysia
15 Cambodia Iran Ecuador Cuba
17 programmes that limit production. There are also exemptions for developing countries (sometimes called an “S&D box”, including provisions in Article 6.2 of the agreement).
While the Uruguay Round Agreement on Agriculture made some significant progress on rules of trade in agriculture by replacing the QRs with tariffs and for specifying initial commitments on reduction of tariffs and subsidies, the momentum could not be maintained under the WTO-sponsored negotiations. The domestic support given to agriculture in the developed countries has not come down since the implementation of the commitments of the Uruguay Round began in 1995 (Naik, 2005). Although in the Doha Ministerial Declaration member countries vowed to achieve substantial improvements in market access through phasing out of all forms of export subsidies and substantial reductions in trade-distorting domestic support (WTO 2001, para. 13), no major breakthrough has been made after the conclusion of the Hong Kong Ministerial conference, held in December 2005. While members are still negotiating modalities for further liberalisation, consensus has been reached on abolishing all export subsidies only by 2013 (WTO 2005, para 6).1 It however appears that export subsidies constitute very insignificant portion of the total domestic support measures given to agriculture in the developed countries.
Despite the lack of progress related to agricultural liberalisation in the post Uruguay Round period there is no denying that, most of the agricultural commodities have long been the most protected commodities in world trade, any significant liberalisation measure in this sector will likely to have huge welfare implications.
2.3. Liberalisation of the Manufacturing Sector
WTO negotiations with respect to the non-agricultural commodities (all those are not covered under the negotiation on agriculture, sometimes referred to as industrial or, manufactured goods) center around the enhancement of Non-Agricultural Market Access (NAMA), and are, therefore, proceeding towards the elimination or the reduction of bound tariff rates, bringing unbound tariff rates under binding commitments which will be subject to formula cuts, and identifying and removing Non-tariff Barriers (NTBs). The important considerations under the NAMA negotiations are the extent and modalities of tariff cut for industrial goods in order to reduce and ultimately eliminate high bound tariffs rates, tariff peaks and tariff escalation. Although, for the developed countries almost all of their tariff lines are bounded, in case of developing countries, the proportions of the bound tariffs to total tariff lines are quite low. As trade theory suggests, for small and vulnerable economies, industrial tariffs are used as a tool to protect domestic industries with artificially maintaining high price in the local market. It is also true that for many developing countries, tariff revenue acts as a major source of government revenue. Therefore, it is quite common that the developing countries might keep the floor open to adjust with economic shocks by not-committing to WTO, or not setting bound tariff rates. Similar considerations are applicable for ‘less than full reciprocity’ flexibility for the developing countries to be allowed for industrial tariff cut.
18 2.3.1. World Manufacturing Trade: Where does India Stand?
Figure 2.2 shows the growth rate in the world manufacturing trade over the last two decades. It appears that during the first half of 1980s the annual average growth in trade in manufacturing products was very low, only 2 percent, which increased to 15 percent during the second half of the 19080s. However during the 1990s the world trade in manufacturing experienced some lower rate of growth which, however, increased considerably
during the 2000s. Since 2005 there has been an increasing trend in the growth rate in this regard.
Table 2.5 shows that the trade in manufacturing products has the dominant share in world trade. In 2007, the total value of the trade in manufacturing products was US$ 9500 billion which was 69.8 percent of the total merchandise trade in that year.
Table 2.6 suggest that in the case of the share of manufacturing exports in total regional merchandise exports the Asian countries has the highest share (81.6 percent). The African countries, on average, have lower export-orientation in manufacturing products compared to all the regions in the world. On the other hand, in the case of imports, the Asian countries, on average, have the lowest import-orientation in manufacturing products compared all the. The CIS countries, on average, appear to have the highest import-orientation as far as the agricultural imports are concerned.
Figure 2.2: Growth in World Manufacturing Trade (%)
Source: International Trade Statistics 2008
Table 2.5: World Trade in Manufacturing Products, 2007
Value in 2007 9500 $bn
Share in world merchandise trade % 69.8 Source: International Trade Statistics 2008
Table 2.6: Manufacturing products’ share in trade, by region, 2007
Share in total
merchandise trade, % Exports Imports
World 69.8 69.8
North America 72.2 72.8
South and Central America 30.9 69.1
Europe 78.6 72.1
CIS 25.1 76.7
Africa 18.8 68.0
Middle East 21.0 75.7
Asia 81.6 63.7
Note: CIS = Commonwealth of Independent States Source: International Trade Statistics 2007 2
15
9
5 12
10 13
15
1980
‐
85
1985
‐
90
1990
‐
95
1995
‐
00
2000
‐
07
2
005
2
006
2
19 According to Table 2.7, EU member countries are the largest traders of the manufacturing products. They, among themselves, perform more than 41-44 percent of the world trade in manufacturing products, and do another 12-15 percent of world trade with the rest of the world. China and USA are the two major important players in world agricultural trade. Apart from China, the other developing countries having important shares in world exports of manufacturing products are Malaysia, Thailand, India and Turkey. India was among the top 15 exporters of manufacturing products and in 2007 India registered a 1.0 percent share of world exports of manufacturing products. On the other hand, apart from the EU and the USA, the major importers of manufacturing products are China and Japan.
2.3.2. Negotiations on NAMA
Trade negotiations in the Uruguay Round, under the broad title of Non-agricultural Market Access (NAMA), achieved a progress in terms of reducing developed country’s average tariff rates from 6.3 percent to 3.8 percent, and an increase in developing country’s binding coverage from 21 percent to 73 percent. Under the ongoing Doha Round, the negotiations on NAMA incorporate the reduction or elimination of overall industrial tariff rates as well as the reduction or elimination of tariff peaks and tariff escalation, and also the removal of the non-tariff barriers (NTBs). In line with the work programmes, set in article 16 of the Doha Ministerial declaration, negotiations on NAMA were launched in January 2002 with the creation of a Negotiating Group on Market Access (NGMA). The sectors which should be covered for the formula approach for tariff reduction, as proposed by the NGMA in 2003, include (i) electronics and electrical goods, (ii) fish and fish products, (iii) footwear, (iv) leather goods, (v) motor vehicle parts and components, (vi) stones, gems, and precious metals, and (vii) textiles and clothing.
[image:21.612.91.409.106.383.2]The July 2004 package moved onward with a framework for establishing modalities for NAMA negotiations and the 6th Ministerial Declaration in Hong Kong in December 2005 set out the mandate to use a ‘Swiss type’ formula for the reduction in the bound tariff rates.
Table 2.7: Top 15 Manufacturing Exporters and Importers, 2007 Value
$bn
Share in World Exports %
Value $bn
Share in World Imports %
Exporters Importers
European Union (27) 4249.1 44.7 European Union (27) 4029.7 41.0 extra‐EU (27) exports 1406.5 14.8 extra‐EU (27) imports 1187.2 12.1 China a 1134.8 11.9 United States 1409.6 14.3 United States 909.4 9.6 China a, c 677.6 6.9 Japan 640.9 6.7 Hong Kong, China 333.6 3.4 Hong Kong, China 331.2 3.5 retained imports 14.7 0.1 domestic exports 12.3 0.1 Japan 314.4 3.2 re‐exports 318.9 3.4 Canada d 293.8 3.0 Korea, Republic of 330.4 3.5 Mexico a, d 227.9 2.3 Singapore 227.1 2.4 Korea, Republic of 206.2 2.1 domestic exports 104.4 1.1 Singapore 188.1 1.9 re‐exports 122.7 1.3 retained imports 65.4 0.7 Canada 224.5 2.4 Russian Federation b, d 185.6 1.9 Taipei, Chinese 209.6 2.2 Taipei, Chinese 142.6 1.5 Mexico a 204.2 2.1 Switzerland 132.2 1.3 Switzerland 155.5 1.6 Australia d 118.1 1.2 Malaysia a 125.0 1.3 Malaysia a 110.7 1.1 Thailand 116.5 1.2 Turkey b 106.6 1.1 India 92.4 1.0
Turkey b 85.4 0.9
Above 15 8716.9 91.8 Above 15 8158.0 83.0
Source: International Trade Statistics 2008
Note: a Includes significant shipments through processing zones b Includes Secretariat estimates. c In 2007, China reported imports of manufactures from China amounting to $84.1 billion.
20 However, there have been intense debates, and a number of proposals have been put in place with respect to the value and the number of coefficient used in the tariff-cut formula, and no consensus has yet been reached. According to the July 2004 framework, NAMA tariff reduction should have comprehensive product coverage, should commence from bound rates, and all non-ad-valorem duties are to be converted to ad-valorem equivalents and to bind them in ad-valorem terms. Although the tariff reductions are to be from the bound tariff rates, the implication will exert to the applied rates too, as in most of the cases the developed country MFN applied tariffs and bound tariffs don’t have wide spreads for industrial commodities.
The rationale for applying a formula cut approach for tariff reduction includes the willingness of making the process transparent, efficient, equitable and predictable. There were intensive discussions among the member countries regarding the development of modalities for NAMA, and finally they reached a consensus of applying the formula approach, and the negotiation so far proceeded, the formula will be a ‘Swiss type with coefficients’.
2.4. Services Trade Liberalisation
In present day world services sector is the fastest growing sector of the global economy and it accounts for two thirds of global output, 30 percent of global employment and 20 percent of global trade. Services activities in low- and middle-income countries have been expanding faster than GDP for the last two decades. An implication of this continuous shift toward services is that the overall growth of productivity in the economy is becoming increasingly determined by what is happening in the services sector.
Even though services sector is the major contributor to GDP in most of the countries, trade in services is relatively a new phenomenon, and it has a low share in the total world trade. ‘Intangibility’ and ‘no storability’ characteristics of services were considered as main impediments to services trade. Services sector was not included in the world trade negotiation process till the inception of Uruguay Round. Commencement of General Agreement on Trade in Services (GATS) in world trade negotiation is relatively a recent phenomenon. GATS is the first initiative with the aim of progressive liberalisation of trade in services. The World Trade Organization (WTO) administers the agreement with effect from January 1995. After the inception of GATS, services trade is getting the importance in WTO multilateral trade negotiations.
In the era of global economic integration, competitiveness play vital role in the success of international trade. In addition, the competitive environment of the domestic markets facilitates higher economic growth and can help in reducing poverty. Services sector plays fundamental role in ensuring the competitiveness of an economy. Services are used intensively in the production of all goods, making up around 10-20 percent of production costs in both manufacturing and agriculture, and sometimes more (Sauvé, 2006)2.
21 2.4.1. Global Trade in Services: Where does India Stand?
Table 2.8 presents the figures on global trade in services. It appears that global trade in services amounted to more than 3000 billion US$ in 2007. Transpiration and travel sectors together accounted for around 50 percent of the world trade of commercial services. The remaining 50 percent of the world trade in services were accounted by other commercial services.
The growths in services trade over the last two decades are portrayed in Figure 2.3. Despite the fact the growth in services trade were reduced in the second half of 1990s, all the major services categories registered increasing growth rate in their trade during the 2000s. Especially compared to 2006, the growth rates in services trade have been much higher in 2007. The trade in transportation services in 2007 experienced a very high growth rate (19 percent) against a low growth rate of 9 percent in 2006.
India’s relative positions in terms of exports and imports of services among the top 15 countries in the world in 2007 for different types of services are reported in Table 2.9. It appears that in 2007, for almost all broad services categories, India was among the top 15 countries in the world. In 2007, India’s largest export earnings from services trade came from ‘other business services’. In the case of exports of ‘computer and information services’ and ‘other business services’, India ranked
2nd and 3rd respectively. India is also a large importer of commercial services. In 2007, the largest import payment for services trade was in the case of ‘other business services’ and India ranked 4th among the top 15 countries in the world.
India has experienced a significant shift in the structure of her economy towards the dominance of the services sector (from the traditional sectors of agriculture and industry) in national production and employment. At present, the contribution of the services sector to GDP is above 50 percent in India with the sector gaining further prominence. Among the different services categories, India’s success lies in the sectors like Information Technology (IT), Business Processes Outsourcing, tourism, banking, construction etc. and especially on
Table 2.8: World Trade in Commercial Services by Category in 2007
Exports (Billion US$) Share Export Imports (Billion US$) Share Import
Transportation 750 22.8 890 28.9
Travel 855 26.0 775 25.2
Other commercial 1685 51.2 1415 45.9
All commercial services 3290 100.0 3085 100.0
Source: International Trade Statistics 2008
Figure 2.3: Growth in World Services Trade (%)
Source: International Trade Statistics 2008
Table 2.9: Indian Exports and Imports of Services and Ranking among the Top 15 Countries in 2007
Service Categories Exports (million US$) Export Rank Imports (million US$) Import Rank
Transport 8.8 11 31.1 5
Travel 11.1 13 8.8 15
Commercial 69.8 4 37.3 5
Communication 2191 5 899 8
Telecommunication 1096 4 450 6
Construction 403 12 906 10
Insurance 1116 8 2664 8
Financial 2071 8 1316 7
Computer and information 21461 2 2199 4
Personal, cultural and recreational 218 13 ‐ ‐
Other business 30923 3 21453 4
Source: WTO International Trade Statistics 2008
8
5
12 12 12
18 6 3 12 13 9 19 9 3 9 7 9 14 10 7 14 14 16 20 0 5 10 15 20 25
1990‐95 1995‐00 2000‐07 2005 2006 2007 Commercial Transportation
23
C
HAPTER
3:
A
N
O
VERVIEW OF
I
NDIAN
E
CONOMY
3.1. Structural Change and Economic Growth
The average rate of GDP growth since the 1980s has been 5.82 per cent per year with wide variations over different sub-periods (Figure 3.1). There have been some remarkable growth performances during the 2003 and 2006 when the GDP growth rate exceeded 8 percent level. Along with the accelerated growth rate in GDP there have also been significantly high growth rates in per capita GDP.
The structure of the Indian economy has undergone significant changes since the 1980s with the share of agriculture in GDP declining to about half in 2006 (Table 3.1). The agriculture sector, for so long the mainstay of the Indian economy now accounts for only about 20 per cent of
GDP, yet employs over 50 per cent of the population. For some years after independence, India depended on foreign aid to meet its food needs, but in the last 35 years, food production has risen steadily, mainly due to the increase in irrigated areas and widespread use of high-yield seeds, fertilizers, and pesticides. The Country has large grain stockpiles and is a net exporter of food grains.
India’s growth performance during the last one decade or so has been largely driven by the growth in the services sector. Also during the 2000s India has been able to maintain high growth rate in the industrial sector and a stable growth rate in the agricultural sector.
Figure 3.1: Growth in Indian Economy (%)
Source: WDI (2008)
Table 3.1: Structure of Indian Economy
Sectors Shares in GDP
1980 1985 1990 1995 2000 2005 2006
Agriculture 35.7 31.2 29.3 26.5 23.4 18.3 17.5
Industry 24.7 26.1 26.9 27.8 26.2 27.6 27.9
Services 39.6 42.7 43.8 45.7 50.5 54.1 54.6
Total 100.0 100.0 100.0 100.0 100.0 100.0 100.0
Source: WDI (2008)
Table 3.2: Sectoral Growth in India
1981 ‐ 85 1986 ‐ 90 1991 ‐ 95 1996 ‐2000 2001 ‐2005
Agriculture 3.3 3.8 2.4 3.2 3.0
Industry 5.2 7.2 6.0 5.1 7.3
Services 6.3 6.9 6.7 8.0 8.5
GDP 5.2 6.0 5.1 5.8 7.0
Per Capita GDP 2.9 3.8 3.2 4.0 5.4
Source: WDI (2008)
‐2 0 2 4 6 8 10 12 19 80 19 81 19 82 19 83 19 84 19 85 19 86 19 87 19 88 19 89 19 90 19 91 19 92 19 93 19 94 19 95 19 96 19 97 19 98 19 99 20 00 20 01 20 02 20 03 20 04 20 05 20 06
GDP growth (annual %)
24 The growth performance over the
period was underpinned by relatively steady rates of savings, investment and improvements in other macroeconomic indicators (Table 3.3). As a share of GDP, investment increased to 34 per cent in 2006 along with increases in domestic and national savings. The changes in the
external sector were significant. The share of exports of goods and services in GDP rose to 23 per cent in 2006 from only 6 per cent in early 1980s. On the other hand, the share of imports of goods and services in GDP rose from only 8.7 percent in 1981 to around 26 percent in 2006.
3.2. Structure of Government Revenue
The changes in the structure of government revenue are given in Table 3.4. The share of government revenue in GDP remained low over the last one and half decade. There are two major sources of the government’s revenue earnings – tax revenue and non-tax revenue, of which tax revenue contributes almost 85 per cent. It also appears that among tax revenue, the share of taxes on international trade has declined over time, mainly due to the trade liberalisation measures, whereas that of taxes on income, profits and capital gains has increased considerably. On the other hand, the share of taxes on domestic production deceased by some large margin during 2000 and 2006. The non-tax revenue e.g. income from state-owned enterprises, fees and other miscellaneous receipts provided about 20 per cent of total revenue in 1990 which decreased to around 16 per cent in 2006.
3.3. Changes in Trade Policies
After independence from the British rule in 1947, India embarked the strategy that relied on import-substitution, emphasized the role of the government in providing infrastructure, as a regulator, and as a provider of goods and services. As a result, throughout the 1960s and 1970s, the growth rate of GDP in India had been stagnant at 3−3.5 percent per annum. In fact, the trade regime in the early 1980s was characterized by high nominal tariffs and nontariff barriers coupled with a complex import
Table 3.3: Selected Indicators of Indian Economy (As % of GDP)
1981 1985 1990 1995 2000 2005 2006
Consumption 80.5 79.0 77.3 74.6 76.1 69.6 68.9
General Government 10.0 11.3 11.7 10.9 12.6 11.3 11.3
Private 70.5 67.7 65.6 63.7 63.5 58.3 57.6
Investment 22.2 23.5 24.2 26.6 24.8 33.4 33.9
Gross Domestic Saving 19.5 21.0 22.7 25.4 23.9 30.4 31.1 Gross National Saving 20.8 21.5 22.1 26.7 25.6 32.7 33.5
Exports 6.0 5.3 7.1 11.0 13.2 20.3 23.0
Imports 8.7 7.7 8.5 12.2 14.2 23.3 25.8
Source: WDI (2008)
Table 3.4: Structure of Government Revenue
1990 1995 2000 2006
Total Revenue Excluding Grants (Billion LCU) 715.9 1466.5 2504.4 5237.8
Tax Revenue 575.7 1112.4 1885.3 4421.5
Non ‐ tax Revenue 140.1 354.1 619.1 816.3
Total Revenue Excluding Grants as % of GDP 12.6 12.3 11.9 12.7 % Share of Major Taxes in Total Revenue Taxes on Incomes, Profits & Capital Gains 14.8 22.5 27.0 39.2
Taxes on International Trade 28.6 24.2 18.9 14.6
Taxes on Domestic Production 56.6 53.3 54.1 46.1
Total 100.0 100.0 100.0 100.0
Source: WDI (2008)
Figure 3.2: Trend in Average Tariff Rate in India (%)
74.3 100
81.8
41 32.7
16 14
0 20 40 60 80 100 120
1981 1986 1990 1995 2000 2005 2007