http://dx.doi.org/10.4236/am.2013.412230
Optimization of Linear Filtering Model to Predict
Post-LASIK Corneal Smoothing Based on Training Data
Sets
Anatoly Fabrikant, Guang-Ming Dai, Dimitri Chernyak
Research and Development, Abbott Medical Optics, Milpitas, USA
Email: [email protected], [email protected], [email protected]
Received August 29, 2013; revised September 29, 2013; accepted October 6, 2013
Copyright © 2013 Anatoly Fabrikant et al. This is an open access article distributed under the Creative Commons Attribution Li- cense, which permits unrestricted use, distribution, and reproduction in any medium, provided the original work is properly cited.
ABSTRACT
Laser vision correction is a rapidly growing field for correcting nearsightedness, farsightedness as well as astigmatism with dominating laser-assisted in situ keratomileusis (LASIK) procedures. While the technique works well for correct- ing spherocylindrical aberrations, it does not fully correct high order aberrations (HOAs), in particular spherical aberra- tion (SA), due to unexpected induction of HOAs post-surgery. Corneal epithelial remodeling was proposed as one source to account for such HOA induction process. This work proposes a dual-scale linear filtering kernel to model such a process. Several retrospective clinical data sets were used as training data sets to construct the model, with a downhill simplex algorithm to optimize the two free parameters of the kernel. The performance of the optimized kernel was testedon new clinical data sets that were not previously used for the optimization.
Keywords: Simulation-Driven Optimization; Downhill Simplex Method; Corneal Smoothing; LASIK
1. Introduction
Historically, eyeglasses and contact lenses have been used to alleviate refractive problems such as nearsight- edness, farsightedness, and astigmatism. With the advent of excimer lasers [1] specially designed for laser-assisted in situ keratomeliusis (LASIK) and photorefractive ker- atectomy (PRK), patients started to enjoy a new type of vision correction that is free of eyeglasses. With wave- front-guided LASIK [2], the correction of ocular aberra- tions is no longer limited to the so-called low-order ab- errations, i.e., the spherocylindrical error that can be cor- rected with traditional eyeglasses. This new technology enables the correction of higher-order aberrations (HOAs) that are beyond the spherocylindrical error, most notably spherical aberration and coma. Thus, super sharp vision is attainable in theory with the wavefront-guided LASIK.
Unfortunately, the human cornea is not a piece of plas- tic [3]. With LASIK, it involves first cutting a flap on the corneal stroma, lifting it to the side, then delivering the UV laser pulses to remove tissue, and finally putting back the flap, which heals shortly after surgery. The pre- cise design of an ablation target may cut the corneal stroma as needed to achieve a desired shape immediately
after surgery. However, the biomechanical process and the corneal epithelial remodeling after surgery change the surface of the cornea, resulting in deviations from the original optical design of the ablation shape. Therefore, the post-operative induction of HOAs, especially sphere- cal aberration (SA), is currently among the most serious challenges for laser vision correction technology. Among several possible root causes of SA induction, the post- operative cornea remodeling was found the most impor- tant [4]. The main effect of the cornea remodeling is the smoothing of epithelial anterior surface, when the epithe- lium tends to grow thicker at the center and fill in the dips of the cornea surface, created by refractive surgery [5]. The epithelial smoothing causes some spherocylin- drical regression after refractive surgery, which can be corrected by a linear adjustment of the intended refrac- tive correction. It also leads to the induction of high-or- der aberrations, which are increasingly strong for high myopia and hyperopia cases [4,6].
1695
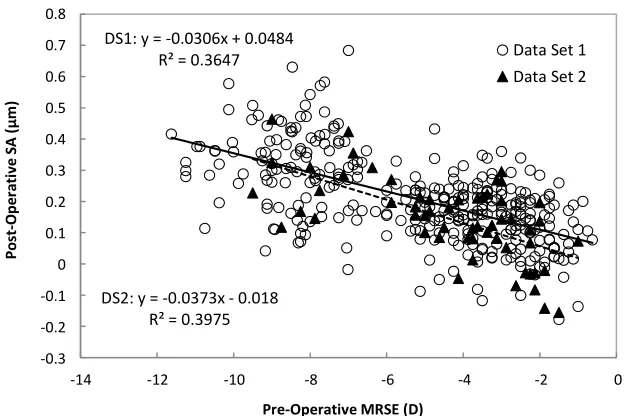
duced SA shows a statistically significant trend versus the magnitude of the treated refraction. Figure 1 shows
the post-operative SA over a 6 mm diameter as a func- tion of the pre-operative manifest refraction in spherical equivalent (MRSE). The regression slope of the induc- tion is remarkably consistent between different data sets.
The purpose of this study is to find a corneal smooth- ing model to represent the corneal change post-surgery using an optimization algorithm, based on retrospectively available clinical data. The kernel is then tested with other clinical data sets that were not previously used for the optimization. This well tested kernel can then be used to “reverse” the biological corneal smoothing effect by a mathematical deconvolution process. An improved treat- ment algorithm can then be designed, which hopefully will remove the induced spherical aberration.
2. Modeling of Post-Operative Corneal
Smoothing
Various models can capture geometric changes to the surface of the human cornea occurring after the surgery. We considered an optimized linear filter (OLF) model, which describes post-operative smoothing of the corneal ablation. This model is characterized by a small set of parameters determined by a model optimization based on retrospective clinical data.
The post-operative epithelial smoothing process can be simulated by means of a simple mathematical model. This model defines the shape of the post-operative cor- nea surface as a convolution of the ablation target profile with a linear smoothing filter as
post-op pre-op ,
h h K x y T x
where h stands for the elevation maps of the corneal sur- face for pre-operative and post-operative situations, re- spectively, denotes a convolution operation, T(x,y) is the ablation target profile and K(x,y) is the linear smooth- ing filter kernel. A simple squared Butterworth low-pass filter [7] has been proposed. A squared Butterworth filter of the first order takes a form with the square term of the spatial frequency as
22 1 ,
1 x y
r K k k
k s
(2)
where K(kx,ky) is the Fourier transform of K(x,y), 2 2
r x
k k ky , and s is a parameter representing the
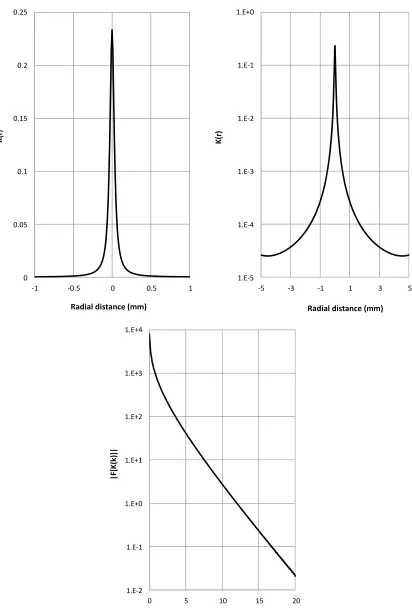
scale of the kernel. With limited success using the squared Butterworth filter as defined by Equation (2), we began consideration of dual-scale and triple-scale OLFs that has a somewhat similar shape as the squared But- terworth filter. Our tests show that a dual-scale OLF model has the advantage of faster convergence and pro- per account of biological change of the epithelial cells than the triple-scale model. Therefore, we have used a dual-scale OLF kernel that is defined as
22 4
1 ,
1 K x y
r r
s s
4
(3)
where r x2y2 is the radial distance from the co-
ordinate origin, s2 and s4 are two unknown free parame- ters to be determined. For our application, r, s2 and s4 all have dimensions in mm. Figure 2 shows the cross-sec-
tion of the kernel and its power spectrum.
,y (1)
DS1: y = -0.0306x + 0.0484 R² = 0.3647
DS2: y = -0.0373x - 0.018 R² = 0.3975
-0.3 -0.2 -0.1 0 0.1 0.2 0.3 0.4 0.5 0.6 0.7 0.8
-14 -12 -10 -8 -6 -4 -2 0
Po
st-Ope
ra
ti
ve S
A
(
μ
m)
Pre-Operative MRSE (D)
Data Set 1 Data Set 2
[image:2.595.141.454.496.704.2]0 0.05 0.1 0.15 0.2 0.25
-1 -0.5 0 0.5 1
K(r
)
Radial distance (mm)
1.E-5 1.E-4 1.E-3 1.E-2 1.E-1 1.E+0
-5 -3 -1 1 3 5
K(r)
Radial distance (mm)
1.E-2 1.E-1 1.E+0 1.E+1 1.E+2 1.E+3 1.E+4
0 5 10 15 20
|F
[K
(k
)]
|
[image:3.595.92.504.82.695.2]k (cycles/mm)
Figure 2. Cross-section of the optimized linear filter. Left panel, linear scale of the center of the kernel; middle panel, loga- ithmic scale of the entire kernel; right panel, power spectrum of the kernel.
1697
3. Optimization of the Kernel Parameters
“obs” stands for observation, i.e., clinical outcome.Several different optimization algorithms have been tested. Our choice of the downhill simplex method [8,9] works well with our model and the data sets. With four clinical data sets (two parts of Data Set 1, low myopia and high myopia, and Data Sets 3 and 5) used for opti- mization, we found that s2 = 0.0334 mm and s4 = 0.464 mm give the minimum σ as defined in Equation (4). By using Equation (3) in Equation (1) using the pre-op-
erative and post-operative wavefront data as well as the treatment targets for various previously treated eyes, the two unknown parameters s2 and s4 can be obtained by minimizing the difference between the simulated post- operative wavefront error and the observed post-opera- tive wavefront error. This minimization is a least-squares type which minimizes the regression slopes of the post- operative spherical equivalent (SE) and post-operative SA as a function of the pre-operative SE for all eyes as
2
2 simu obs
obs 2 simu obs obs slopeSE slopeSE slopeSE slopeSA slopeSA slopeSA
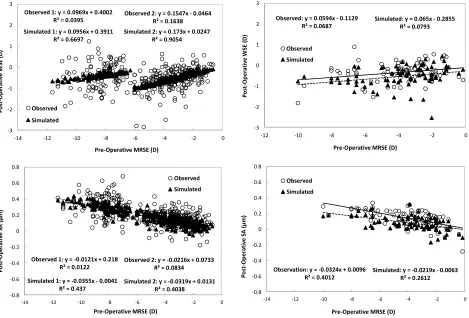
(4)With these two kernel parameters, application of the treatment parameters for those eyes using Equation (1) enables us to obtain the simulated clinical outcome, which includes spherocylindrical error (wavefront sphe- rical equivalent, or WSE) and SA. The WSE is measured in diopters (D) and the SA is measured in microns (µm) over a 6 mm diameter. Figure 3 shows the comparison
between the observed and simulated post-operative out- come for two data sets that were used for the optimiza- tion. Both the post-operative WSE and SA as a function of the pre-operative WRSE are plotted. With no surprise, the regression slopes of the simulated eyes agree well with those of the observed eyes.
where slopeSE and slopeSA are the regression slopes of the post-operative SE versus pre-operative SE and post- operative SA versus pre-operative SE, respectively. δ
stands for 95% confidence interval of the observed slope. Subscript “simu” stands for simulation and subscript
Once the parameters s2 and s4 are determined, the OLF kernel can be determined based on Equation (3). To ob- tain a new target shape that is capable of removing the
y = 0.1547x - 0.0464
Observed 2: y = 0.1547x - 0.0464 R² = 0.1638 Simulated 2: y = 0.173x + 0.0247
R² = 0.9054 Observed 1: y = 0.0969x + 0.4002
R² = 0.0395
Simulated 1: y = 0.0956x + 0.3911 R² = 0.6697
-3 -2 -1 0 1 2 3
-14 -12 -10 -8 -6 -4 -2 0
Po st -O p e ra ti ve W SE ( D )
Pre-Operative MRSE (D) Observed
Simulated
Observed: y = 0.0594x - 0.1129 R² = 0.0687
Simulated: y = 0.065x - 0.2855 R² = 0.0793
-3 -2 -1 0 1 2 3
-12 -10 -8 -6 -4 -2 0
Po st -O p e ra ti ve W SE ( D )
Pre-Operative MRSE (D) Observed
Simulated
Observed 2: y = -0.0216x + 0.0733 R² = 0.0834
Simulated 2: y = -0.0319x + 0.0131 R² = 0.4038 Observed 1: y = -0.0121x + 0.218
R² = 0.0122
Simulated 1: y = -0.0355x - 0.0041 R² = 0.437
-0.8 -0.6 -0.4 -0.2 0 0.2 0.4 0.6 0.8
-14 -12 -10 -8 -6 -4 -2 0
Po st -O p e ra ti ve SA ( μ m)
Pre-Operative MRSE (D)
Observed Simulated
Observation: y = -0.0324x + 0.0096 R² = 0.4012
Simulated: y = -0.0219x - 0.0063 R² = 0.2612
-0.8 -0.6 -0.4 -0.2 0 0.2 0.4 0.6 0.8
-14 -12 -10 -8 -6 -4 -2 0
Po st -O p e ra ti ve SA ( μ m)
Pre-Operative MRSE (D) Observed
[image:4.595.78.283.236.310.2]Simulated
Figure 3. Comparison of simulated and observed post-operative aberrations (WSE and SA) for Data Set 1 (left panels, two ubsets, n = 390) and Data Set 3 (right panels, n = 76).
s
[image:4.595.65.534.391.709.2]post-operative induction of spherical aberration, a de- convolution process of Equation (1) can be employed as
new INV current * current 2 2 , , SNR x y x y
T K T
K k k F
K k k
T
(5)
where F(·) stands for a Fourier transform, * denotes a complex conjugate, Tcurrent is the current treatment target with induction of post-operative SA, Tnew is the new tar- get that is expected to remove the post-operative SA, and
KINV is the inverse kernel of K(x,y). This is the typical Wiener filtering technique [9]. The SNR is used to pre- vent noise amplification and oscillation at the edge. A constant value of 0.1 was used for practical purpose.
4. Verification of the Model with New Test
Data
The effect of post-LASIK central corneal thickening caused by epithelial smoothing has been observed previouslyin the literature [4,5,10-12] and provided at least partial explanation for regression after refractive surgery for myopia. The OLF obtained in this study
confirms the central corneal thickening phenomena, which gives biological support of the kernel.
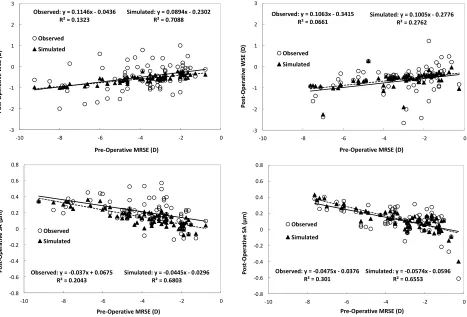
For the first verification, we used the kernel optimized with Data Sets 1, 3 and 5 and applied it to Data Sets 2 and 4, as depicted in Figure 4. It is interesting to see that
the regression slopes of the simulated eyes agree well with those of the observed eyes, even though these data sets were not used for the optimization. This result is expected because the model is supposed to simulate the post-operative corneal smoothing process, which should not be different for different data sets.
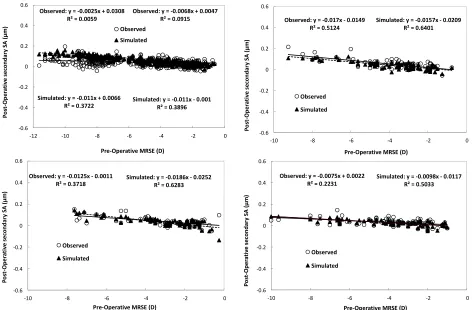
For the second verification, recall that we used SE and SA as two aberration parameters for optimization in Equation (4). More convincingly, we used the same ker- nel to obtain similar regression slopes for the secondary spherical aberration, which is not a parameter used in the optimization, as shown in Figure 5. Again, we have
good matches between the observed and the simulated slopes. This result comes as expected, as the induction of HOAs from the corneal smoothing is primarily rotation- ally symmetric. Secondary spherical aberration is the most important rotationally symmetric after sphere and primary spherical aberrations.
Some regression plots show a constant offset between
Observed: y = 0.1146x - 0.0436 R² = 0.1323
Simulated: y = 0.0894x - 0.2302 R² = 0.7088
-3 -2 -1 0 1 2 3
-10 -8 -6 -4 -2 0
Observed: y = 0.1063x - 0.3415 R² = 0.0661
Simulated: y = 0.1005x - 0.2776 R² = 0.2762
-3 -2 -1 0 1 2 3
-10 -8 -6 -4 -2
Po st -O p er at ive W SE ( D )
Pre-Operative MRSE (D) Observed Po st -O p er at iv e W SE ( D )
Pre-Operative MRSE (D) Simulated
0
Observed
Simulated
Observed: y = -0.037x + 0.0675 R² = 0.2043
Simulated: y = -0.0445x - 0.0296 R² = 0.6803
-0.8 -0.6 -0.4 -0.2 0 0.2 0.4 0.6 0.8
-10 -8 -6 -4 -2 0
Observed: y = -0.0475x - 0.0376 R² = 0.301
Simulated: y = -0.0574x - 0.0596 R² = 0.6553
-0.8 -0.6 -0.4 -0.2 0 0.2 0.4 0.6 0.8
-10 -8 -6 -4 -2
Po st -O p e ra ti ve SA ( μ m)
Pre-Operative MRSE (D)
Po st -O p e ra ti ve SA ( μ m)
Pre-Operative MRSE (D)
0
Observed
Simulated Observed
[image:5.595.93.256.118.176.2]Simulated
[image:5.595.66.533.393.710.2]1699
Observed: y = -0.0068x + 0.0047 R² = 0.0915
Simulated: y = -0.011x - 0.001 R² = 0.3896 Observed: y = -0.0025x + 0.0308
R² = 0.0059
Simulated: y = -0.011x + 0.0066 R² = 0.3722
-0.6 -0.4 -0.2 0 0.2 0.4 0.6
-12 -10 -8 -6 -4 -2 0
P o st -Op er ati ve seco ndary SA ( μ m)
Pre-Operative MRSE (D) Observed
Simulated
Observed: y = -0.017x - 0.0149 R² = 0.5124
Simulated: y = -0.0157x - 0.0209 R² = 0.6401
-0.6 -0.4 -0.2 0 0.2 0.4 0.6
-10 -8 -6 -4 -2
Po st -O p e ra ti ve s e co n d ar y SA ( μ m)
Pre-Operative MRSE (D)
0
Observed
Simulated
Observed: y = -0.0125x - 0.0011
R² = 0.3718 Simulated: y = -0.0186x - 0.0252R² = 0.6283
-0.6 -0.4 -0.2 0 0.2 0.4 0.6
-10 -8 -6 -4 -2 0
Observed: y = -0.0075x + 0.0022 R² = 0.2231
Simulated: y = -0.0098x - 0.0117 R² = 0.5033
-0.6 -0.4 -0.2 0 0.2 0.4 0.6
-10 -8 -6 -4 -2
Po st -O p e ra ti ve s e co n d ar y SA ( μ m)
Pre-Operative MRSE (D)
P o st -Oper at iv e second ar y S A ( μ m)
Pre-Operative MRSE (D) Observed
0
Observed
[image:6.595.62.534.84.394.2]Simulated Simulated
Figure 5. Post-operative secondary SA as a function of the pre-operative SE for simulated and observed eyes in the Data Set 1 (upper left, n = 390), Data Set 2 (upper right, n = 74), Data Set 3 (lower left, n = 76), and Data Set 4 (lower right, n = 76). All eyes are myopic.
the simulated and the observed trend lines. These offsets for post-operative SE or SA trend are about the same for all pre-operative MRSE values, indicating that they do not depend on ablation depth. They may be caused by the creation of the LASIK flap [10-13]. Depending on the choice of microkeratome and individual surgeon tech- nique, the flap-induced aberrations may differ from site to site or surgeon to surgeon [14].
5. Discussion
Search of the smoothing kernel to model the post- operative induction of spherical aberration is a relatively new field of study. Based on the observation of post-op- erative refractive regression, a simple low-pass squared Butterworth filter was proposed [7]. This kernel is de- fined by a single free parameter, which characterizes the scale of smoothing. Unfortunately, this model does not provide a satisfactory fitting for the regression slopes for both post-operative low-order refraction and high order aberrations simultaneously. Optimization for both refrac- tion and spherical aberration leads to diverged outcomes.
The proposed OLF with two free parameters models a dual-scale smoothing. Looking at the cross-section of the
kernel in logarithmic scale in Figure 2, the sharp core
corresponds to the short scale diffusion process and the wide wings correspond to the long scale smoothing proc- ess. These two separated processes can be linked to the post-operative corneal change in low-order and high- order aberrations, respectively. Consequently, the OLF yields a good match for both low-order aberrations (WSE) and high order aberrations (SA) observed clinically. Fur- thermore, this match can be extended to different data sets and different aberration types (secondary spherical aberration).
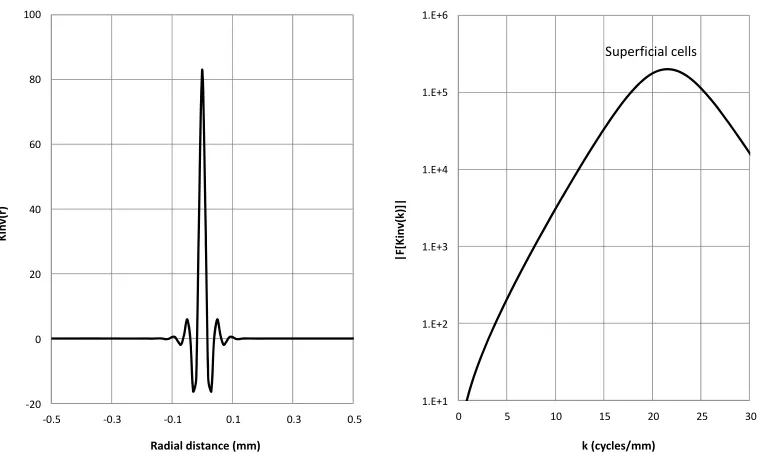
Looking at the inverse kernel KINV, as depicted in Fig-
ure 6, we found that the peak of the power spectrum of
the inverse kernel corresponds to the size of the superfi- cial cells of the epithelium. This may not be just a coin- cidence, as the movement of the epithelial cells, espe- cially the superficial cells, it’s attributed to the mecha- nism of the post-operative corneal smoothing. As the smoothing kernels generally smooth high curvature areas, the effect of the inverse kernel works exactly the oppo- site, sharpening areas that have high curvature changes. The link of the peak of the power spectrum of the inverse kernel to the size of the superficial cells of the epithelium
-20 0 20 40 60 80 100
-0.5 -0.3 -0.1 0.1 0.3 0.5
Kin
v(
r)
Radial distance (mm)
1.E+1 1.E+2 1.E+3 1.E+4 1.E+5 1.E+6
0 5 10 15 20 25 30
|F[
K
in
v(
k)
]|
k (cycles/mm)
[image:7.595.108.487.85.312.2]Superficial cells
Figure 6. Cross-section of the inverse kernel of the OLF. Left panel, the inverse kernel; right panel, the power spectrum.
Similar to the neural network technique where a data set is used to train the network and a new data set is used to test the network, we used combination of data sets to optimize the free parameters of the proposed kernel and used new data sets to test the effectiveness of the model. The successful test of the model strengthens is useful- ness, which can be important when costly clinical trials are decided.
REFERENCES
[1] S. L. Trokel, R. Srinivasan, and B. Braren, “Excimer Laser Surgery of the Cornea,” American Journal of Ophthal- mology, Vol. 96, No. 6, 1983, pp. 710-715.
[2] G.-M. Dai, “Wavefront Optics for Vision Correction,” SPIE Press, Bellingham, 2008.
http://dx.doi.org/10.1117/3.769212
[3] C. Roberts, “The Cornea Is Not a Piece of Plastic,” Jour- nal of Refractive Surgery, Vol. 16, No. 4, 2000, pp. 407- 413.
[4] G. Yoon, S. MacRae, D. R. Williams and I. G. Cox,
“Causes of Spherical Aberration Induced by Laser Re- fractive Surgery,” Journal of Cataract & Refractive Sur- gery, Vol. 31, No. 1, 2005, pp. 127-135.
http://dx.doi.org/10.1016/j.jcrs.2004.10.046
[5] S. V. Patel, J. C. Erie, J. W. McLaren and W. M. Bourne, “Confocal Microscopy Changes in Epithelial and Stromal Thickness up to 7 Years after LASIK and Photorefractive Keratectomy for Myopia,” Journal of Refractive Surgery, Vol. 23, No. 4, 2007, pp. 385-392.
[6] T. Oshika, K. Miyata, T. Tokunaga, T. Samejima, S. Amano, S. Tanaka, Y. Hirohara, T. Mihashi, N. Maeda and T. Fujikado, “Higher Order Wavefront Aberrations of Cornea and Magnitude of Refractive Correction in Laser
in Situ Keratomileusis,” Ophtalmology, Vol. 109, No. 6, 2002, pp. 1154-1158.
http://dx.doi.org/10.1016/S0161-6420(02)01028-X
[7] D. Huang, M. Tang and R. Shekhar, “Mathematical Model of Cornea Surface Smoothing After Laser Refractive Surgery,” American Journal of Ophthalmology, Vol. 135, No. 3, 2003, pp. 267-278.
http://dx.doi.org/10.1016/S0002-9394(02)01942-6
[8] J. A. Nelder and R. Mead, “A Simplex Method for Func- tion Minimization,” Computer Journal, Vol. 7, No. 4, 1965, pp. 308-313.
http://dx.doi.org/10.1093/comjnl/7.4.308
[9] W. H. Press, S. A. Teukolsky, W. T. Vettering and B. P. Flannery, “Numerical Recipes in C++,” Cambridge Uni- versity Press, London, 2002.
[10]J. Porter, S. MacRae, G. Yoon, C. Roberts, I. Cox and D. Williams, “Separate Effects of the Microkeratome Inci- sion and Laser Ablation on the Eye’s Wave Aberration,”
American Journal of Ophthalmology, Vol. 136, No. 2, 2003, pp. 327-337.
http://dx.doi.org/10.1016/S0002-9394(03)00222-8
[11]I. G. Pallikaris, G. D. Kymionis, S. I. Panagopoulou, C. S. Siganos, M. A. Theodorakis and A. I. Pallikaris, “Induced Optical Aberrations Following Formation of a Laser in Situ Keratomileusis Flap,” Journal of Cataract & Refrac- tive Surgery, Vol. 28, No. 10, 2002, pp. 1737-1741.
http://dx.doi.org/10.1016/S0886-3350(02)01507-9
[12]D. S. Durrie and G. M. Kezirian, “Femtosecond Laser versus Mechanical Keratome Flaps in Wavefront-Guided
in Situ Keratomileusis: Prospective Contralateral Eye Stu- dy,” Journal of Cataract & Refractive Surgery, Vol. 31, No. 1, 2005, pp. 120-126.
http://dx.doi.org/10.1016/j.jcrs.2004.09.046
1701
Prospective Clinical Study Comparing Induced Aberra- tions with Intralase and Hansatome Flap Creation in Fel- low Eyes: Potential Impact on Wavefront-Guided Laser
in Situ Keratomileusis,” Journal of Cataract & Refractive Surgery, Vol. 31, No. 1, 2005, pp. 97-105.
http://dx.doi.org/10.1016/j.jcrs.2004.10.037