Improved Image Segmentation Using Dirichlet
Process Multiple-View Learning With K-Means
Clustering
Poonam Mathan
1, Yogendra Kumar Jain
2Research Scholar1Head of the Department2, Computer Science & Engineering Department Samrat Ashok Technological Institute, Vidisha (M. P.) India
ABSTRACT
The image segmentation is a key challenge in image analysis. In this paper, a new method is proposed for performing interactive image segmentation extracting the object of interest from the non-trivial background, such as interactive multimedia applications. Although, fully automatic image segmentation algorithms have already been improved significantly, it is still not possible to apply an automatic image segmentation algorithm with a guaranteed performance in the general case. The image segmentation using multiple view learning is an efficient technique, but contains high error rate and also the smoothing factor is less but the segmentation ratio is less. Therefore, we proposed Image segmentation method using k-means algorithm along with Dirichlet process, which shows the improvement over these limitations. The proposed method improves the segmented part of the image as well as reduces the error rate of the image.
Keywords
Dirichlet process, Dirichlet process mixture, Image Segmentation, Stochastic procedure, Random Walker segmentation, k-means clustering
1. INTRODUCTION
In spite of a lot of years of research and development, unsupervised image segmentation practices without human dealings still do not produce satisfactory results. Due to that large development of such techniques are still going on. Fully automated segmentation is an ill-posed problem due to the fact that there is neither a clear definition of a correct segmentation nor an objective measure of the goodness of a segment. In order to do semantically meaningful image segmentation, it is essential to take a priori information about the image into account [1].
A real world classification task can often be viewed as consisting of multiple correlated subtasks. In remote sensing, for illustration, one may have numerous sets of data, each collected at a meticulous geographical location; rather than designing individual classifiers for each of these sensing tasks; it is desirable to share data across tasks to enhance overall sensing performance. This represents a typical example of a general learning scenario called Multi-Task Learning (MTL) or learns to learn. In contrast to MTL, Single-Task Learning (STL) refers to the approach of learning
one classification task at a time, only using the corresponding data set; often STL assumes that the training samples are drawn independently from an identical distribution [2].
A common assumption in the previous literature on MTL work is that all tasks are (equally) related to each other, but recently there have been a few investigations concerning the extent of relatedness between tasks. An ideal MTL algorithm should be able to automatically identify similarities between tasks and only allow similar tasks to share data or information. Based only on the features and class labels, the suggested statistical models automatically identify the similarities between the various tasks and adjust the complexity of the model, that is, the number of task clusters, relying on the implicit nonparametric clustering mechanism of the DP [2].
errors. Moreover, it is also attractive not to include any correction stage in the algorithm in order to avoid tedious zooming and correction processes [3].
Interactive segmentation methods in the literature can be divided into two main classes, as boundary-based [4] and region-based methods [2] [5] [6] [7]. Boundary based methods require the user to select an approximate boundary around the object; then, try to find the correct boundary. Such methods accomplish their goal by either minimizing an energy function locally via graph search or minimizing an energy function globally by using graph-cut and then letting user perform local changes on the result [4]. Main drawback of such algorithms is their convergence to a local minimum in highly textured regions due to the high edge profile.
On the other hand, region-based methods either exploit region grow/merge like methods or region cut like approaches. Regions grow/merge type of methods starts from the interacted regions and try to enlarge this region by the help of a measure using color or texture profile. The main advantage of these algorithms is their computational efficiency. On the other hand, the solution, obtained by these methods, could be a local minimum of the specified energy function; therefore, it might not be the globally optimum solution [3].
(A) Interactive Image Segmentation
Automatic image segmentation is a hard problem which requires modeling the problem based on domain knowledge. And even after that, some form of human intervention is required to correct anomalies in the segmentation. Moreover, automatic segmentation methods are not generic. For slightly easier and more approachable problem, interactive image segmentation has also received a lot of attention over the years. The segmentation problem is then modeled using Markov Random Field (MRF) where an energy function encodes a prior model and the constraints which are imposed by the marked pixels.
Interactive image segmentation involves minimal user interaction to incorporate user intention into the segmentation process and is an active research area in recent years because it can achieve satisfactory segmentation results that are unattainable by the state-of-the-art automatic image segmentation algorithms. For a good interactive image segmentation algorithm, there are two basic requirements: (1) given a certain user input, the algorithm should produce intuitive segmentation that reflects the user intent; (2) the algorithm must be efficient so that it can provide instant visual feedback [8].
(B) Dirichlet Process
The Dirichlet process is a stochastic process used in Bayesian nonparametric models of data, predominantly in Dirichlet process mixture models (infinite mixture models). It is an allocation or distribution over distributions, for example every one illustrate from a Dirichlet process is itself a distribution. This is known as Dirichlet process because it has Dirichlet distributed infinite dimensional marginal distributions, just like the Gaussian process, an additional popular stochastic process used for Bayesian nonparametric regression, has a Gaussian distributed finite dimensional marginal distributions. These distributions drawn from a Dirichlet process are distinct, but cannot be explained using a limited number of parameters, therefore the categorization as a nonparametric model.
2. RELATED WORK
Lei Ding et al. suggested Interactive Image Segmentation using Dirichlet Process Multiple-View Learning [1]. They presented an interactive segmentation framework that integrates image appearance and boundary constraints in a principled way to address this difficulty. In meticulous, they imagine that small groups of pixels, which are treated as seed pixels, are tagged as the object and background. The seed pixels are used to approximate the brand of the unlabeled pixels using Dirichlet process multiple-view knowledge gaining, which leverages (1) multiple-view learning that incorporates manifestation and boundary constraints and (2) Dirichlet process mixture-based nonlinear categorization that concurrently models image features and distinguishes between the object and background classes. With the anticipated learning and supposition algorithms, this segmentation skeleton is experimentally shown to produce both quantitatively and qualitatively promising results on a standard dataset of images [1].
It works in a semi-supervised manner, in which the features of unlabeled pixels are utilized to learn their densities, instead of being discarded. In particular, for determining the component index, they model feature distributions within a component as a product of the individual feature distributions. In addition, the posterior label distributions given features are synthesized from multiple views. This treatment considers multiple-view features computed from the image systematically as mixtures [1].
(A) Dirichlet Process Mixtures
Where Xiis a data point, i is the model parameter associated with Xi, f (.) is a parametric density function (e.g., multivariate Gaussian), and is a distribution over parameters, which is drawn from a Dirichlet process D with a base distribution G0and a scale parameter. In practice, however, distribution G can be integrated out, resulting in a closed-form conditional distribution of model parameters [1].
(B) DPMVL
Lei Ding et al. describe the proposed extensions to DPMNL to accommodate the use of multiple views in image segmentation, along with related algorithms for parameter learning and inference in the extended model [1]. The resulting methodology is referred to as DPMVL.
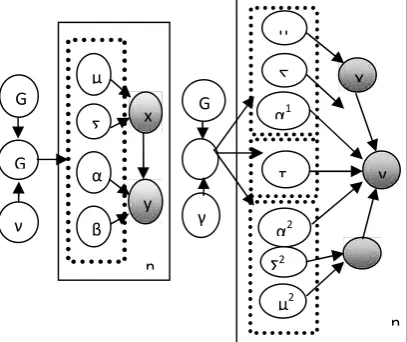
Figure 1: (Left) Graphical model representation of DPMNL. (Right) Graphical model representation of DPMV, where shaded nodes refer to observations and unshaded ones refer to model parameters, n is the total number of training.
The proposed extension to accommodate multiple views is illustrated on the right panel of Fig. 1, where X1 and X2 refer to two complementary feature representations of the same image super pixel which are the color vector (that contains mean RGB values of constituent pixels) and the diffusion signature vector.
The parameters superscripted with 1 and 2 are associated with the two views, respectively. During the assignment of data to components, the two views cooperate to decide the probabilities used for sampling. In parameter re-estimation, parameters associated with each view inside a component are separately updated, and weight parameters {τ, ν} are decided using the interaction between the two views in order to appropriately trade them off [1].
Ya Xue et al. offered Multi-Task Learning for Classification with Dirichlet Process Priors [2]. MTL is distinct from standard STL in two principal respects: (i) the tasks are not equal, thus plainly pooling them and delighting them as a single task is not appropriate; and (ii) some of the classification tasks may be highly, but the strategy of isolating each task and learning the corresponding classifier independently does not exploit the potential information one may acquire from other classification tasks [2].
A DP-based multi-task learning algorithm has been applied to the problem of designing logistic regression classifiers for numerous tasks, for cases in which there is the prospective of enhancing individual-task performance via appropriate sharing of inter-task data. Two overarching formulations have been considered. In the symmetric multi-task learning (SMTL) formulation all of the multi-task-dependent classifiers are learned together. While this is a functional formulation in many cases, it requires one to store all data across previous tasks. In many cases, they may commence a new task and they would like this task to benefit from experience acquired from previous tasks, without having to return to all data observed earlier. This has annoyed what they have termed an asymmetric multi-task learning (AMTL) formulation. In accumulation to the overarching SMTL and AMTL formulizations, they have measured different forms of these algorithms based on how the DP priors are handled [2].
MTL classification performance has been presented on two data sets: (i) a landmine sensing problem based on measured data, and (ii) an art-preference database. Concerning (i), the MTL formulation yielded a clear indication of how the data from the multiple tasks clustered into related physical phenomenon. For this data, they may
µ
Σ
α
β x
y G
o
G
γ
τ, υ µ
1
∑
1
α1
,β
1
α2
,β
2
Σ2
µ2
X
1
y
γ
G G
o
n
[image:4.595.154.358.221.392.2]know the task-dependent environmental conditions under which the sensing was achieved, and the task relatedness reflected in Hinton maps demonstrated close agreement with physical expectations. This make available a powerful confirmation of the utility of the DP formulation for a case
in which “truth” is known, yielding confidence for new
multi-task data sets for which the DP formulation may be used to infer truth [2].
In year of 2012, Ozan Sener et al. offered Error-tolerant Interactive Image Segmentation using Dynamic and Iterated Graph-Cuts [3]. The proposed method is a dynamic process. In the proposed algorithm, when the user selects a color image, the gray scale version of this image is initially displayed to the user. Then, the user starts to colorize the object of interest by the finger strokes on the screen. With each stroke, global segmentation is performed, and the result on the display is updated in
real-time. Main difference between paint selection tool and proposed method is that our method does not require any scribbles on the background. In addition to these, our method finds the globally optimum solution of an energy minimization problem. On the other hand, paint selection tool uses an approximate energy minimization method. In addition to these, classical mouse-based interfaces use left click for foreground and right click for background. However, in touch based interfaces, there is only finger stroke. Therefore, using only foreground scribbles is crucial for the user-centered interaction [3].
[image:5.595.105.429.326.419.2]From the correction point of view, a user always has a chance to correct foreground classified as background. However, user might not have a chance to correct background classified as foreground without restarting the algorithm from scratch. Therefore, it is better solving these types of errors before they occur.
Figure 2: interactive Image Segmentation using dynamic and iterated graph cuts [3].
(i) Image Segmentation using Graph-Cut
Although the interaction methodology and the solution method differ, representation of the energy function of the proposed algorithm is still based on [11]. In [11], an input image is represented as a color vector of the form z = (z1, ..., zn, ..., zN). They modify this representation of an image from pixel-based to super pixel-based. In our framework, zi is the concatenated color vectors of the pixels of super pixel i. Segmentation of the image is represented as a binary vector of
form α = (α1, ...,αn, ..., αN) with αi= 1, if the super pixel i is foreground and vice versa [3].
As the color model, Gaussian Mixture Model (GMM) is used; concatenation of mean and variance vectors of each Gaussian model is stored in a parameter . Then, the energy function, which is in the form of Gibbs energy [11], is formulated as
E (α,, z, k) = U(α,, z, k) + V (α, z)
In this energy function, U (α,, z, k) corresponds to a fit measure of the estimated color models to the
segmentation mask α.
(ii) Dynamic and Iterated Graph-Cut
Proposed algorithm is inherently iterative due to the proposed interaction methodology [13]. By each interaction of a user, energy minimization is updated by the re-estimation of its parameters. Thus, still in the case of via the original graph-cut, the proposed algorithm should work iteratively and dynamically. On the other hand, due to the high computational cost of the algorithm, iteration of the whole approach at each interaction does not seem possible. In order to solve this drawback, they use the residual graph concept with a novel spatial dynamicity improvement [3].
Stated energy minimization problem can be converted to the min-cut/max-flow problem on two terminal (source and sink) graph G (V, E), where V is set of nodes (super pixels) and E is set of directed edges. Global solution to the energy minimization problem is equivalent to the minimum cost cut that separates source and sink nodes in this graph [12]. It is shown that, finding the minimum cost cut is equivalent to the determining maximum flow from source to sink. Moreover, solution to the max-flow problem is obtained by augment paths algorithm. This algorithm can be explained by using the residual capacities and augmenting paths [3].
SOURCE IMAGE
SUPERPIXEL GENERATION
USER STROKE
USER STROKE CORRECTION
UPDATE & DISPLAY RESULT
Residual capacity rijof edge (i, j)€ E is the maximum additional flow that can be sent from i to j through edge (i, j). Initially, residual capacities are set as edge weights. The augmenting path is the path from source to sink through unsaturated residual edges. Augmenting paths algorithm uses the fact that pushing any flow through an augmenting path does not change the solution. In other words, the solution (resulting minimum cut) to the original graph G, and the graph G′ which results from pushing a flow through an augmenting path is equivalent. Augmenting flow algorithm finds a valid path on the residual graph from source to sink and push the maximum possible flow that can go through active edges of the obtained path. This search and pushing flow steps are iterated until there exist no valid path. In other words, when the max-flow is obtained, residual graph is the graph with no possible augmenting path. Moreover, saturated edges correspond to the min-cut solution [3].
(iii) Spatially Dynamic and Iterated Graph-Cut
Iterative solution [14] improves the time efficiency significantly but still there exist some room for additional improvement. In our interaction method, user colourizes the object of interest locally; therefore, the solution required to be obtained should also be a local one. However, min-cut/max-flow solution is determined for the whole graph; therefore, there must be some redundant processing. A straightforward solution to this problem is solving the sub-graph including the user interaction. However, the performed experiments showed that finding a generic size for this sub-graph is impossible. As a result, an adaptive technique for finding an appropriate size of this sub graph is proposed.
On the other hand, when the sub-graph and region R is selected, this condition can also be defined in terms of edge weights between sub-graph and the rest of the global graph. It should be noted that there is no available path within the sub-graph, since this conflicts with the augmenting paths algorithm [12]. Therefore, all the paths which change the solution should go through edges between the sub-graph and the rest of the global graph. Moreover, if the sum of the maximum flows through these paths is less than the terminal weights of the nodes, the resultant labeling cannot be changed via enlargement of the sub-graph. Since, cost of the changing the solution (cutting only the terminal edges) is larger than cutting all edges between sub-graph and the rest of the graph.
(iv) Error Correction
Due to the small screens of the mobile devices, users generally make stroke errors during interaction and these errors typically occur around the boundary of the object of interest. They assume that user starts interaction within the object. Then, the algorithm accumulates the color statistics of
the current region in a single color Gaussian model. When user moves from current superpixel to a new one, algorithm checks the new superpixel. If new superpixel fits to the learned model, the algorithm accepts this new superpixel. If not, the algorithm stores the superpixel which user left the object. Then, new super pixels are stored in a temporary queue and not inserted to the algorithm. In the mean time, color model of these new super pixels are stored in another single color Gaussian model. When another superpixel is examined, if this new superpixel fits to the previously learned color model, super pixels accumulated in the queue is discarded, and the correct path between the superpixel which user left and returned back to the object is calculated and inserted in to the dynamic graph-cut. If the user also leaves the next region (multi-color case), the algorithm calculates the correct path and insert to the dynamic graph-cut. Leaving the next region means not fitting to the temporary color model [3].
Y. Li et al. offered Lazy snapping. They present Lazy Snapping, an interactive image cutout tool [4]. Lazy Snapping is a separates coarse and excellent scale processing, creating object requirement and detailed alteration easy. Moreover, Lazy Snapping affords immediate illustration response, snapping the cutout contour to the true object frontier proficiently regardless of the presence of indefinite or low contrast edges. Instant feedback is made probable by a novel image segmentation algorithm which merges graph cut with pre-computed over-segmentation. A set of intuitive user interface (UI) tools is designed and implemented to provide flexible control and editing for the users. Usability studies specify that Lazy Snapping presents a better user familiarity and produces better segmentation results than the state-of-the-art interactive image cutout tool and Magnetic Lasso in Adobe Photoshop [4].
UI Design
The object boundary produced from the previous step is first converted into editable polygons. The polygon is constructed in an iterative way: the initial polygon has only one vertex, which is the point with the highest curvature on the boundary. At each step, they compute the distance of each point on the boundary to the polygon in the prior step. The farthest point is inserted to generate a new polygon. The iteration stops when the largest distance is less than a pre-defined threshold (normally 3.2 pixels) [4].
Two UI tools are available for polygon editing:
Direct vertex editing allows users to drag the vertex to adjust
Overriding brush enables users to draw a single stroke to
replace a segment of a polygon. This is more proficient than dragging many vertices individually.
In year of 2010, D. Liu et al. proposed fast interactive image segmentation by discriminative clustering [6]. This algorithm offers a better alternative that makes better use of the global and local information than simply running graph cuts on areas. It is logically simple and easy to apply. They do algorithm analysis and show experimental results that the proposed algorithm is much faster than the graph-cuts based method [4] and the similarity based region merging algorithm [12], and performs equally well and often better than these algorithms. After enhancing the speed by an order of magnitude, this algorithm also allows users to quickly and iteratively adjust their inputs and re-do the segmentation if they are not satisfied with the results, instead of waiting for a long time and being surprised by unsatisfactory segmentations. The main contributions of Liu et al [6] are as follows:
i. propose a novel algorithm that is an order of magnitude faster than previous methods and achieves better results;
ii. analyze the effect of the image contents on the speed of our algorithm and compare the most related ones [5] [12];
iii. offer a better way to fully exploit the user input of corner points of a bounding box for the object and a few strokes;
iv. Implement the algorithm on a mobile phone.
Local neighborhood region classification and pruning: After initial cluster merging, there may silent be unmarked areas that are not classified as either foreground or background. Whereas in the first step that classify the unmarked regions only by their mean colors without considering the spatial information, now utilize the local neighborhood information to better shorten the segmentation result [6]. There are two steps:
(i) If there are Nu remaining unmarked regions from the first processing step, each of them is allocated the label of the most similar of its neighboring regions in terms of their mean color. If the largest part similar neighboring region is also an unmarked region, they are combined together to become a new unmarked area and the process reiterates. If there is a tie another time in terms of the mainly similarly labeled neighboring section, the label of the region that has the largest part similar color disagreement is used. (ii) After all the regions have been marked as either
foreground or background, They apply a connected
component algorithm to find isolated foreground or background regions that are surrounded by regions of the opposite labeling. They also specify a set of rules
to decide whether the isolated regions’ label should
be altered. They are tainted to the reverse label only when the following conditions are satisfied.
(a) The section or region was not marked by the user.
(b) The region is not the largest region with that label.
(c) The region is lesser than its surrounding regions. The improvement of speed does not compromise the effectiveness of the proposed algorithm. On the contrary, it works as well or better than the other two methods that have higher complexities. The purpose in each application is to cut out the object that the user chooses with red strokes. Similar to the other two methods, the number of pre-segmented regions
and user input has an effect on the proposed algorithm’s time,
but this algorithm is more robust to these changes. Taking the cheetah image as an instance, they use two dissimilar preliminary pre-segmentations and two more different sets of user inputs [6].
In same year of 2010, Wenxian Yang et al. offered User-friendly Interactive Image Segmentation through Unified Combinatorial User Inputs [8]. They do not attempt to figure out a single universal intelligent means to acquire user feedback and instead they advocate the use of multiple types
of intuitive inputs to better reflect the user’s intention under
different scenarios. In particular, they propose a constrained random walks algorithm that facilitates the use of three types of user inputs: (1) foreground and background seed input, (2) soft constraint input, and (3) hard constraint input, with their combinations. The forefront and background seed input allows a user to draw strokes to identify foreground and background seeds. The soft constraint input permits a user to draw strokes to indicate the region that the boundary should pass through. The hard constraint input permits a user to specify the pixels that the boundary must align with [8].
For most of the images in the MSRC data set, the proposed method achieves very low error rates. High error rates occur in images where the input foreground seeds only cover a small portion of the foreground and thus do not cover all the distinct colors of the foreground, while pixels with similar colors are masked by the background seeds. For such cases, the Grab Cut algorithm and the random walks algorithm also perform poorly (and usually worse).
cases can be significantly further reduced using our unified approach. One example is that by adding several foreground and background strokes to the seven images (with an error rate higher than 9% by our method initially) in the MSRC data set, they reduce the initial errors dramatically and the overall average error rate of the 50 images is dropped from 4.08% to 2.84% [8].
They would like to point out that, although both our method and Lazy Snapping use multiple types of user inputs, this method is quite different from Lazy Snapping. In particular, in terms of user interface, Lazy Snapping uses different algorithms to handle different inputs. To the user, the region segmentation and boundary editing are two separate steps. On the contrary, our work supports multiple intuitive inputs and any of their combinations under one computational framework. In terms of speed, our approach is faster as Lazy Snapping refines the entire contour in the boundary editing step using energy minimization by graph cut, while in our framework boundary editing is a local deformation process [8].
They proposed an interactive image segmentation framework that consists of two components: constrained random walks and local contour deformation. The proposed framework supports multiple intuitive types of user inputs and therefore combines the advantages of different user interactions. The forefront and background brushes are the most commonly used interaction tools as they are easy to use and instructive to the algorithms. The soft boundary brush and the hard boundary pixel selector are extremely useful to handle weak boundaries, where adding more foreground or background strokes may cause unexpected fluctuation in the segmentation results. These tools enable the proposed framework to work fast and accurately with ease. The superior performance of the algorithm has been demonstrated by a number of experiments on the benchmark data sets [8].
Random walk for Image Segmentation is formulated for the following reasons:
(1) Fast solution
solving a sparse linear system
ability of multiple segmentation
fast editing
(2) Nice properties
location of weak/missing boundaries
noise robustness
avoidance of trivial solutions
Primarily due to the progresses in spatial resolution of satellite imagery, the methods of segment-based image
analysis for generating and updating geographical information are becoming more and more important. This work presents a novel image segmentation based on color features with K-means clustering unsupervised algorithm. In this we did not used any training data [15].
The entire work is divided into two stages. First enhancement of color separation of satellite image using decorrelation stretching is carried out and then the regions are grouped into a set of five classes using K-means clustering algorithm. Using this two step process, it is possible to reduce the computational cost avoiding feature calculation for every pixel in the image. Although the colour is not frequently used for image segmentation, it gives a high discriminative power of regions present in the image.
For image segment based classification, the images that need to be classified are segmented into many homogeneous areas with similar spectrum information firstly,
and the image segments’ features are extracted based on the
specific requirements of ground features classification. The color homogeneity is based on the standard deviation of the spectral colors, while the shape homogeneity is based on the compactness and smoothness of shape.
There are two principles in the iteration of parameters: (1) In addition to necessary fineness, we should choose a scale value as large as possible to distinguish different regions; (2) we should use the color criterion where possible. Because the spectral information is the most important in imagery data, the quality of segmentation would be reduced in high weightiness of shape criterion.
This work presents a new image segmentation based on color features from the images. In this we did not used any training data and the work is divided into two stages. First enhancing color separation of satellite image using decorrelation stretching is carried out and then in the second step the regions are grouped into a set of five classes using K-means clustering algorithm. Using this two step process, it is possible to reduce the computational cost avoiding feature calculation for every pixel in the image [15].
3. RESEARCH METHODOLOGY
segmentation using Dirichlet process and k means clustering after random walker Segmentation is show below.
Figure 3: Outline of proposed work.
The proposed algorithm work as follows:
Step 1: Image is input.
Step 2: Apply machine learning to image.
Step 3: Dirichlet Mixture process is then applied to the image.
Step 4: Random walk segmentation is applied. Step 5: K means is applied for clustering.
Step 6: After k-means the segmented image is obtain. The proposed methodology applied here is based on the combination of dirichlet process along with the k-mean clustering algorithm. The k-means clustering applied here is used for the detection of the same segmented region. The process starts with the machine learning approach which is then passed on to the random walker segmentation and hence the data is clustered to get the segmented region.
4. RESULT ANALYSIS
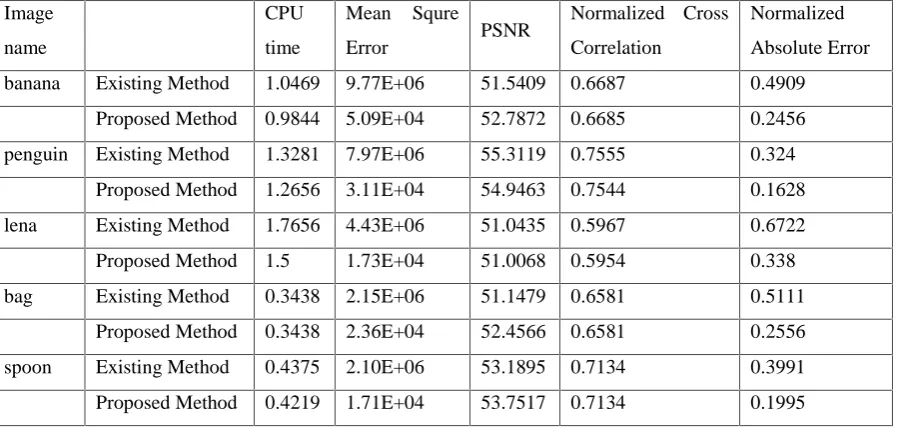
The proposed methodology has been applied to several images for testing. Our main parameter for testing is CPU Time, Mean Square Error, Peak signal-to-noise ratio (PSNR), normalised cross correlation, normalised absolute error:
CPU time: The time requires processing the image by this algorithm.
Mean Squared Error (MSE): MSE average of the squares of the "errors" The error is the amount by which the value
implied by the estimator differs from the quantity to be estimated. The difference occurs because of randomness or because the estimator doesn't account for information that could produce a more accurate estimate. The MSE is calculated by formula a given below.
MSE = ∑ ∑ [ ( , ) − ( , )]2
Peak signal-to-noise ratio (PSNR) is the ratio between the maximum possible power of a signal and the power of corrupting noise that affects the fidelity of its representation.
The PSNR is defined as:
PSNR = 10 •
Normalised Cross Correlation (NCC): NCC is a measure of similarity of two waveforms as a function of a time-lag applied to one of them. This is also known as a sliding dot product or sliding inner-product.
Normalised Absolute Error: The difference between the measured or inferred value of a quantity x0and its actual value x, given by
Δx=x0–x
The proposed algorithm is implemented on following images:
Input
Image
Apply Machine
Learning
Approach
Dirichlet
Mixture
Process
Random
Walker
Segmentation
Segmentatio
n Output
K-mean
Clustering
Original image Segmented image Resultant image
Fig 4: Original Images (Left), Segmented image (Center), and Resultant image (Right)
Table 1: Experimental results for proposed method and existing method using different Parameters (CPU time, Mean Square
Error, PSNR, Normalized Cross Correlation, Normalized Absolute Error)
Image
name
CPU
time
Mean Squre
Error PSNR
Normalized Cross
Correlation
Normalized
Absolute Error
banana Existing Method 1.0469 9.77E+06 51.5409 0.6687 0.4909
Proposed Method 0.9844 5.09E+04 52.7872 0.6685 0.2456
penguin Existing Method 1.3281 7.97E+06 55.3119 0.7555 0.324
Proposed Method 1.2656 3.11E+04 54.9463 0.7544 0.1628
lena Existing Method 1.7656 4.43E+06 51.0435 0.5967 0.6722
Proposed Method 1.5 1.73E+04 51.0068 0.5954 0.338
bag Existing Method 0.3438 2.15E+06 51.1479 0.6581 0.5111
Proposed Method 0.3438 2.36E+04 52.4566 0.6581 0.2556
spoon Existing Method 0.4375 2.10E+06 53.1895 0.7134 0.3991
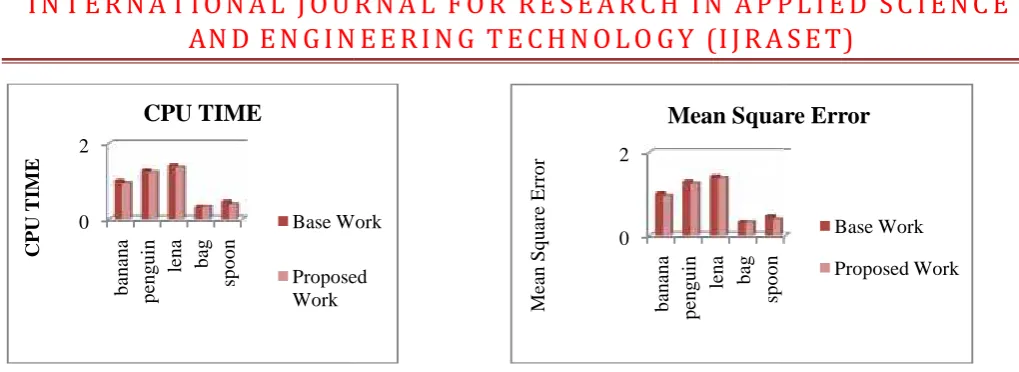
[image:10.595.76.525.470.686.2]Fig 5: Graphical representation of proposed method and existing method using different Parameters (CPU time, Mean Square Error).
The proposed algorithm is applied on several images and test results of the proposed methods are compared with the existing method. The result shows that CPU time, mean square error and Normalised absolute error is decreased while PSNR increased. This shows that the proposed algorithm is efficient in performing image segmentation.
5. CONCLUSION
Image Segmentation is a technique which is used for the analysis of particular region in image processing. The result evidences that our proposed method improve the efficiency of the detected image segmentation using k-means algorithm. K-means is a good method to quickly sort your data into clusters. The proposed method also provides less error rate as compared to the existing techniques like random
walker segmentation and dirichlet’s multiple view learning.
The proposed algorithm also works efficiently in terms of CPU time. The advantage of K-Means algorithm is simple and quite efficient. It works well when clusters are not well separated from each other.
6. REFERENCES
[1] Lei Ding, Alper Yilmaz, and Rong Yan “Interactive
Image Segmentation Using Dirichlet Process
Multiple-View Learning”, IEEE Transactions on Image Processing, vol. 21, No. 4, pp. 2119 – 2130, April 2012.
[2] Ya Xue, Xuejun Liao and Lawrence Carin “Multi-Task Learning for Classification with Dirichlet Process
Priors”, Journal of Machine Learning Research, vol. 8, pp. 35–63, 2007.
[3] Ozan Sener,Kemal Ugur and A. Aydın Alatan “Error -tolerant Interactive Image Segmentation using Dynamic and Iterated Graph-Cuts”, Proceedings of the 2ndACM
international workshop on Interactive multimedia on mobile and portable devices, pp. 9- 16, 2012.
[4] Y. Li, J. Sun, C. K. Tang, and H. Y. Shum. “Lazy snapping”, ACM Transactions on Graphics (TOG), vol. 23, Issue 3, pp. 303-308, Aug. 2004.
[5] F. Calderero and F. Marques “Region merging
techniques using information theory statistical
measures”, IEEE Transactions on Image Processing, vol. 19, Issue 6, pp. 1567–86, June 2010.
[6] D. Liu, K. Pulli, L. G. Shapiro, and Y. Xiong “Fast
interactive image segmentation by discriminative
clustering”, Proceedings of the ACM multimedia
workshop on Mobile cloud media computing, pp. 47-52, 2010.
[7] D. Liu, Y. Xiong, L. G. Shapiro, and K. Pulli,“Robust
interactive image segmentation with automatic
boundary refinement”, In ICIP, pp. 225–228, 2010. [8] Wenxian Yang, Jianfei Cai, Jianmin Zheng, and Jiebo
Luo “User-friendly Interactive Image Segmentation through Unified Combinatorial User Inputs”, IEEE
Transactions on Image Processing, vol. 19, Issue 9, pp. 2470–2479, 2010.
[9] K. Sinop and L. Grady “A seeded image segmentation
framework unifying graph cuts and random walker which yields a newalgorithm”, IEEE 11thInternational Conference on Computer Vision, ICCV 2007, pp. 1-8, 2007.
[10] Maxwell D. Collins, Jia Xu, Leo Grady and Vikas Singh, “Random Walks based Multi-Image Segmentation: Quasiconvexity Results and GPU-based Solutions”,IEEE Conference on Computer Vision and 0 2 b an an a p en g u in le n a b ag sp o o n CP U T IM E
CPU TIME
Base Work Proposed WorkFig 5: Graphical representation of proposed method and existing method using different Parameters (CPU time, Mean Square Error).
The proposed algorithm is applied on several images and test results of the proposed methods are compared with the existing method. The result shows that CPU time, mean square error and Normalised absolute error is decreased while PSNR increased. This shows that the proposed algorithm is efficient in performing image segmentation.
5. CONCLUSION
Image Segmentation is a technique which is used for the analysis of particular region in image processing. The result evidences that our proposed method improve the efficiency of the detected image segmentation using k-means algorithm. K-means is a good method to quickly sort your data into clusters. The proposed method also provides less error rate as compared to the existing techniques like random
walker segmentation and dirichlet’s multiple view learning.
The proposed algorithm also works efficiently in terms of CPU time. The advantage of K-Means algorithm is simple and quite efficient. It works well when clusters are not well separated from each other.
6. REFERENCES
[1] Lei Ding, Alper Yilmaz, and Rong Yan “Interactive
Image Segmentation Using Dirichlet Process
Multiple-View Learning”, IEEE Transactions on Image Processing, vol. 21, No. 4, pp. 2119 – 2130, April 2012.
[2] Ya Xue, Xuejun Liao and Lawrence Carin “Multi-Task Learning for Classification with Dirichlet Process
Priors”, Journal of Machine Learning Research, vol. 8, pp. 35–63, 2007.
[3] Ozan Sener,Kemal Ugur and A. Aydın Alatan “Error -tolerant Interactive Image Segmentation using Dynamic and Iterated Graph-Cuts”, Proceedings of the 2ndACM
international workshop on Interactive multimedia on mobile and portable devices, pp. 9- 16, 2012.
[4] Y. Li, J. Sun, C. K. Tang, and H. Y. Shum. “Lazy snapping”, ACM Transactions on Graphics (TOG), vol. 23, Issue 3, pp. 303-308, Aug. 2004.
[5] F. Calderero and F. Marques “Region merging
techniques using information theory statistical
measures”, IEEE Transactions on Image Processing, vol. 19, Issue 6, pp. 1567–86, June 2010.
[6] D. Liu, K. Pulli, L. G. Shapiro, and Y. Xiong “Fast
interactive image segmentation by discriminative
clustering”, Proceedings of the ACM multimedia
workshop on Mobile cloud media computing, pp. 47-52, 2010.
[7] D. Liu, Y. Xiong, L. G. Shapiro, and K. Pulli,“Robust
interactive image segmentation with automatic
boundary refinement”, In ICIP, pp. 225–228, 2010. [8] Wenxian Yang, Jianfei Cai, Jianmin Zheng, and Jiebo
Luo “User-friendly Interactive Image Segmentation through Unified Combinatorial User Inputs”, IEEE
Transactions on Image Processing, vol. 19, Issue 9, pp. 2470–2479, 2010.
[9] K. Sinop and L. Grady “A seeded image segmentation
framework unifying graph cuts and random walker which yields a newalgorithm”, IEEE 11thInternational Conference on Computer Vision, ICCV 2007, pp. 1-8, 2007.
[10] Maxwell D. Collins, Jia Xu, Leo Grady and Vikas Singh, “Random Walks based Multi-Image Segmentation: Quasiconvexity Results and GPU-based Solutions”, IEEE Conference on Computer Vision and Base Work Proposed Work 0 2 b an an a p en g u in le n a b ag sp o o n M ea n S q u ar e E rr o r
Mean Square Error
Fig 5: Graphical representation of proposed method and existing method using different Parameters (CPU time, Mean Square Error).
The proposed algorithm is applied on several images and test results of the proposed methods are compared with the existing method. The result shows that CPU time, mean square error and Normalised absolute error is decreased while PSNR increased. This shows that the proposed algorithm is efficient in performing image segmentation.
5. CONCLUSION
Image Segmentation is a technique which is used for the analysis of particular region in image processing. The result evidences that our proposed method improve the efficiency of the detected image segmentation using k-means algorithm. K-means is a good method to quickly sort your data into clusters. The proposed method also provides less error rate as compared to the existing techniques like random
walker segmentation and dirichlet’s multiple view learning.
The proposed algorithm also works efficiently in terms of CPU time. The advantage of K-Means algorithm is simple and quite efficient. It works well when clusters are not well separated from each other.
6. REFERENCES
[1] Lei Ding, Alper Yilmaz, and Rong Yan “Interactive
Image Segmentation Using Dirichlet Process
Multiple-View Learning”, IEEE Transactions on Image Processing, vol. 21, No. 4, pp. 2119 – 2130, April 2012.
[2] Ya Xue, Xuejun Liao and Lawrence Carin “Multi-Task Learning for Classification with Dirichlet Process
Priors”, Journal of Machine Learning Research, vol. 8, pp. 35–63, 2007.
[3] Ozan Sener,Kemal Ugur and A. Aydın Alatan “Error -tolerant Interactive Image Segmentation using Dynamic and Iterated Graph-Cuts”, Proceedings of the 2ndACM
international workshop on Interactive multimedia on mobile and portable devices, pp. 9- 16, 2012.
[4] Y. Li, J. Sun, C. K. Tang, and H. Y. Shum. “Lazy snapping”, ACM Transactions on Graphics (TOG), vol. 23, Issue 3, pp. 303-308, Aug. 2004.
[5] F. Calderero and F. Marques “Region merging
techniques using information theory statistical
measures”, IEEE Transactions on Image Processing, vol. 19, Issue 6, pp. 1567–86, June 2010.
[6] D. Liu, K. Pulli, L. G. Shapiro, and Y. Xiong “Fast
interactive image segmentation by discriminative
clustering”, Proceedings of the ACM multimedia
workshop on Mobile cloud media computing, pp. 47-52, 2010.
[7] D. Liu, Y. Xiong, L. G. Shapiro, and K. Pulli,“Robust
interactive image segmentation with automatic
boundary refinement”, In ICIP, pp. 225–228, 2010. [8] Wenxian Yang, Jianfei Cai, Jianmin Zheng, and Jiebo
Luo “User-friendly Interactive Image Segmentation through Unified Combinatorial User Inputs”, IEEE
Transactions on Image Processing, vol. 19, Issue 9, pp. 2470–2479, 2010.
[9] K. Sinop and L. Grady “A seeded image segmentation
framework unifying graph cuts and random walker which yields a newalgorithm”, IEEE 11thInternational Conference on Computer Vision, ICCV 2007, pp. 1-8, 2007.
[10] Maxwell D. Collins, Jia Xu, Leo Grady and Vikas Singh, “Random Walks based Multi-Image Segmentation: Quasiconvexity Results and GPU-based Solutions”, IEEE Conference on Computer Vision and
Mean Square Error
Base Work
Pattern Recognition (CVPR), pp. 1656-1663, June 2012.
[11] Rother, V. Kolmogorov, and A. Blake. Grabcut,
“Interactive foreground extraction using iterated graph
cuts”, ACM Transactions on Graphics”, vol. 23, Issue 3, pp. 309-314, August 2004.
[12] J. Ning, L. Zhang, D. Zhang, and C. Wu, “Interactive
image segmentation by maximal similarity based
region merging”, Pattern Recognition, vol. 43, issue 2, pp. 445–456, Feb. 2010.
[13] Y. Boykov and V. Kolmogorov, “An experimental comparison of min-cut/max-flow algorithms for energy
minimization in vision”, IEEE Transactions on PAMI,
vol. 26, No. 9, pp. 1124-1137, Sept. 2004.
[14] P. Kohli and P. H. S. Torr, “Dynamic Graph Cuts for Efficient Inference in Markov Random Fields”, IEEE PAMI, vol. 29, issue 12, pp. 2079–2088, 2007.
[15] Anil Z Chitade, Dr. S.K. Katiyar , “Colour Based
Image Segmentation Using K-Means Clustering”,
![Figure 2: interactive Image Segmentation using dynamic and iterated graph cuts [3].](https://thumb-us.123doks.com/thumbv2/123dok_us/8588491.863139/5.595.105.429.326.419/figure-interactive-image-segmentation-using-dynamic-iterated-graph.webp)