A Definitive Procedure to Evaluate the Accuracy of
CAD/CAM Machines using Advanced Classifiers
Archana Khandait 1, Dr. Asish Panat2
1
Assistant professor, PCE, Nagpur, 2Professor&Hod (EN and Communication Engg) School of Engg MITADT, PUNE
Abstract: The technical advancements in medical applications have open up wide domains for CAD and CAM machines. The machines produce an output which cannot be fully trusted. This paper focuses on the accuracy of the system output generated. The system used SVM and K-means to evaluate the outputs from the machines. The output is taken from multiple machines which are then analyzed and studied. Finally, the output is observed by a doctor to confirm the results which increase the results.
Keywords:CAD/CAM, Machine performance, SVM, K-Means.
I. INTRODUCTION
Computer aided designs (CAD) frameworks are progressively being utilized as a guide by clinicians for diagnosis and elucidation of ailments. So far various CAD frameworks have been affirmed for clinical utilization and numerous more are presently a work in progress. Well, a CAD framework utilizes a classifier to recognize patterns between irregular or ordinary anomaly in pictures. In the period of classification, arrangements of picture features as well as surface features extricated from the pictures are utilized. The execution of a CAD framework to a great extent relies on upon the assurance and choice of the features pertinent to a particular application. In this manner, feature assurance and feature choice are critical errands in the advancement of CAD. Mutual Information (MI) has been utilized as a similitude metric in picture enlistment and format coordinating and utilized as a component of choice model in CAD. The MI has additionally been utilized as a measure for assessment of restorative imaging frameworks. In the evaluation of picture quality, the MI is utilized to express the measure of data that yields that a picture of Y contains around an
input object of X. At that point, the shared data can be acquired by utilizing the recipe of MI(X; Y) = H(X) + H(Y) − H(X, Y),
where H(X), H(Y), and H(X, Y) are data entropy, yield entropy, and joint entropy, respectively. The more the MI esteem gives, the better picture quality is produced. Through the investigations of MI, we have seen that the measure of yield entropy extraordinarily influences the MI esteem and may be utilized as a successful texture component of a picture. This finding persuades a further examination to conduct the yield entropy of a picture. The reason for this paper is to research the base for the yield entropy of a picture and to exhibit the value of the yield entropy by enhancing features an external influence in the system. A definitive objective is to build up a CAD framework that uses applicable and effective features. With a specific end goal to approve the viability and prevalence of the yield entropy-based features, to enhance the system the saliency map of the image is taken into account which makes the feature measures easy to calculate which can then be processed by any classifier to achieve the end goal. In this paper the following section helps in understanding the proposed techniques used to make the system following with the simulations and results. Finally the conclusion concludes the paper.
II. PROPOSED SYSTEM
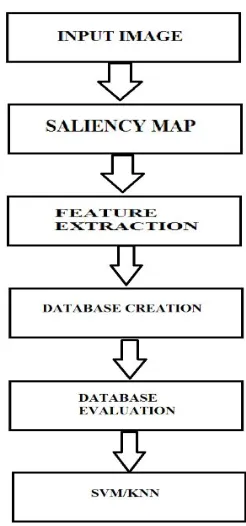
[image:2.612.79.502.592.718.2]As observed from the block diagram we are using the following modules which complete the proposed technique, the system starts with saliency map then extracts the features and lastly the SVM and KNN classifier classifies the features and produces outputs.
A. KNN Classifier:
KNN is the K- nearest neighbour’s algorithm. It is used for classification and regression and is a non-parametric method. In both cases, the input consists of the K-closet training examples in the feature space. The output depends on whether K-NN is used for classification or regression:
The output is a class membership in K-NN classification. In K-NN regression, the output is the property value for the object. This value is the average of the values of the values of its K nearest neighbours. The function is only approximated locally in an instance based learning to type and all computation is deferred until classification. K-NN is a type of instance-based learning. From all the machine learning algorithms, K-NN is the simplest algorithm among all. We choose KNN as our system framework, as the computational complexity is not high and there are not many training parameters and also the performance is satisfactory because KNN is an algorithm based on machine learning.
In KNN algorithm, the calculations done among samples are a key part. While in evaluation, each sample is composed of patent title and summary, the length of each sample is generally shorter, and the data sparse problem is serious because traditional methods such as inner product, cosine, and Euclidean distance are all based on the vector space model, which did not fully consider the length of sample. In order to integrate all kinds of useful information, our system uses the BM25 similarity calculation method, it is a bag of words retrieval function, combines the document frequency and word frequency, balances the length of the document, and is highly efficient similarity calculation method. The patent is defined as a multi-level tree classification structure, according to the international patent classification standards, the patent is defined as multi-level tree classification structure, different sub-categories derived from the same parent node have many common attributes, retrieval will introduce noise inevitably because similarity alone is difficult to objectively measure the degree of similarity samples, which to some extent affects the performance of the classification system.
B. SVM Classifier
Too many engineering applications, the problem of empirical data modelling is germane. The performance of the empirical model is governed by the quality and the quantity of the observations. A process of induction is used to build up a model of the system in empirical data modeling, in which it is hoped to reduce responses of the system that are yet to be observed. The data obtained is finite and sampled which is observed; because of this non-uniform sampling, the data will form only a sparse distribution in the input space due to the high dimensional nature of the problem. Traditional neural network approaches have suffered difficulties with generalization, producing models that can over-fit the data.
This is a consequence of the optimization algorithms used for parameter selection and the statistical measures used to select the ‘best’ model. Due to many attractive features, and promising empirical performance, the foundations of support vector machines (SVM) which is developed by Vapnik, are gaining popularity. The formulation embodies the structural risk minimization (SRM) principle, which has been shown to superior, to traditional Empirical Risk Minimizations (ERM) principle employed by conventional neural networks.
SRM minimizes an upper bound on the expected risk, as opposed to ERM that minimizes the error on the training data. It is the difference which equips SVM with a greater ability to generalize, which is the goal in statistical learning. To solve the classification problem SVMs were developed, but recently they have been extended to the domain of regression problems. The terminology for SVMs is slightly confusing in literature. The term SVM is used to describe classification with support vector methods and support vector regression is used to describe regression with support vector methods.
The term support vector classification (SVM) and support vector regression (SVR) will be used for specification in this report and term SVM also refer to both classification and regression methods. By using kernel trick, SVMs can efficiently perform a nonlinear classification, implicitly mapping their inputs into high dimensional feature spaces.
C. Saliency Map:
The winner-take-all algorithm is used to determine this maximum. There are different mechanisms that suggested the implementation of the neural winner-take-all network. Different researchers like Koch and Ullman in the year 1985, Yuille and Grzywaez in 1989 and most importantly Tsotos, Culhane, lai, wai, nuflo and Davis in 1995 made amulti-scaledwinner-take-all network. This model has two-dimensional layers of fire and integrates neurons consisting of strong global inhibition in which any neuron can activate the inhibitory population. When the first integrate and fire cell fires it leads to a series of actions potentials which in turn shifts the focus of attention towards the winner location.
The inhibitory population is also activated by this action potential which causes inhibition of the all the cells in the layer which resets the network to its initial state.
If there is no further control mechanism, the focus of attention will be directed constantly to one location in case of a static scene and the same winner will be selected always. In order to avoid this behaviour, we use Koch and Ullman and we introduced an inhibitory feedback taken from the winner-take-all (WTA) array to the saliency map. During the spike in the WTA network, an additional input with the spatial structure of a difference of Gaussians is transiently received by the integrators in the saliency map. The inhibitor centre has a standard deviation of half the radius of the FOA. The inhibitor centre is present at the location of the winner and hence it and its neighbour become inhibited in the saliency map.
Therefore the attention is shifted to the next most conspicuous location. This process of inhibition of return has been demonstrated very well for covert attention shifts in human. In humans or trained monkeys, this behaviour of inhibition of return for eye movements has very less evidence. If there are two location of almost equal conspicuity, the one which is closer to the previous focus attention will be attended next. This is the function of the excitatory lobes to favour locality when the focus of attention is displaced. The idea of proximity preference which is proposed by Koch and Ullman is followed by the implementation detail. The conductance, firing thresholds and the time constants are predetermined for the neurons to promote the FOA jump from one salient location to the next in 30-70ms and the attended area is inhibited for 500-900ms. For different locations, there are different delays with the strengths of the saliency map input at those locations. Eventually, the FOA returns to the previously attended location, it is observed psychophysically.
D. Feature Extraction
Since the images are tested to find the output of the system, therefore, we require some features based on which the images will be compared. There are generally 25 image measures are utilized efficiently. The features permits which help in building an appropriate classifier from the set of features. In this work, the Liner Discriminant Analysis (LDA) and Quadratic Discriminate Analysis (QDA) classifiers are used. These quality measures are selected on the basis of performance, complementarily, complexity, speed. Following paragraphs illustrates the image quality measures.
Full reference image quality measure (FRIQA) is based on availability of a clean undistorted image for its reference so that the quality of the test sample, the error sensitivity measures, Customary perceptual picture quality evaluation methodologies depend on measuring the blunders (i.e., signal contrasts) between the contorted and the reference pictures, and endeavour to measure these mistakes in a way that mimics human visual mistake affectability features
1) Pixel Difference Measure (PDM)
It is denoted by the following formula
2) Correlation Based Measures (CBM)
The similarity between two digital images can also be quantified in terms of the correlation. It includes Normalized Cross Correlation (NXC), Mean Angle Similarity (MAS) and Means Angle-Magnitude Similarity (MAMS).
3) Edge-Based Measures (EBM)
One of the two-dimensionalfeatures is the edge, corners of the image which are one of the data sensitive parts of image playing avital role in computer visual algorithms which includes. It includes Total Edge Difference (TED) and Total Corner Difference (TCD).
4)Spectral Distance Measure (SDM)
One of the traditional processing tools is the Fourier transform which is been applied to the image quality assessment which includes Spectral Magnitude Error (SME) and the Spectral Phase Error (SPE).
5) Gradient Based Measure (GBM)
The technique focuses on the distortion which affects an image are reflected by a change in the image radiance, it includes Gradient Magnitude Error (GME) and Gradient Phase Error (GPE).
The structural source of similarity is an error sensitivity based model. It was proposed by using the hypothesis that the human visual system which is highly adapted for extracting structural from viewing field. It includes Structural Similarity Index Measure (SSIM).Lastly, Information Theoretic Measures which includes Visual Information Fidelity (VIF) and Reduced Reference Entropic Difference index (RRED).Programmed no-reference image quality appraisal (NR-IQA) calculations attempt to deal with the exceptionally unpredictable and testing issue of surveying the visual nature of pictures, without a reference.
The technique starts with Distortion-Specific Approaches which is designed on the basis of previously acquired knowledge of quality loss which includes JPEG Quality Index (JQI), High-Low Frequency Index (HLFI). The training based approaches are based on using a clean and distorted image, it includes Blind Image Quality Index (BIQI). Finally,Natural Scene Statistic Approaches used blind IQA from which the knowledge is taken from natural scene distortion free images. The technique includes Natural Image Quality Evaluator (NIQE).
III. IMPLEMENTATION
Fig 5: Flow of the proposed system
As observed from the above figure we have the following modules which ae being used to predict the output. The system starts by taking an image as an input. The images are taken from medical machinery which are used for analysis.
Once the image is taken as the input it sent to extract saliency map. The image is taken as the input and then the maps are calculated. The map is calculated in multiple iterations and the final output is the mean of the maps calculated. Once the saliency map s found it is then sent to the feature extraction phase. In the feature extraction phase features like the Mean Square Error, Peak Signal To Noise Ratio, Signal To Noise Ratio, Structural Content, Maximum Difference, Average Difference and many more are calculated. Once the features ae calculated they are sent to storage. In the storage phases all the calculated feature set are stored in the database. The databases are taken to the classifiers. The system test two classifiers first is the SVM and the second is the KNN. The feature sets are processes using both the techniques and the results are compared. To add an extra level of accuracy the results of both the classifiers are shown to a doctor for making an accurate prediction.
IV. RESULTS
We evaluated SVM and kNN on various image sets, and obtained the following results, Number
of images
Accuracy (kNN) %
Accuracy (SVM) %
Delay (kNN) ms
Delay (SVM) ms
10 80 90 1.2 1.1
20 85 95 1.25 1.18
30 87 96 1.28 1.17
40 88 97 1.29 1.19
50 88 97.5 1.29 1.195
V. CONCLUSION
REFERENCES
[1] Prathamesh M. Sonavane, “Fake Biometric Trait Detection Using Image Quality Features”, © 2015 IJEDR | Volume 3, Issue 2 | ISSN: 2321-9939. [2] DrNicosBilalis, “Computer Aided Designs”, INNOREGIO: dissemination of innovation and knowledge management techniques.
[3] Laurent Itti, Christof Koch, “A saliency-based search mechanism for overt and covert shifts of visual attention”, Vision Research 40 (2000) 1489–1506. [4] Steve Gunn, “Support Vector Machines for Classification and Regression”, University of Southampton.
[5] Yun-lei Cai, Duo Ji,Dong-fengCai, “A KNN Research Paper Classification Method Based on Shared Nearest Neighbor”, roceedings of NTCIR-8 Workshop Meeting, June 15–18, 2010, Tokyo, Japan.
[6] N. Suguna, and Dr. K. Thanushkodi, “An Improved k-Nearest Neighbor Classification Using Genetic Algorithm”, IJCSI International Journal of Computer Science Issues, Vol. 7, Issue 4, No 2, July 2010.
[7] Lor`eneDubreuil, YannQuinsat, Claire Lartigue. CAD-based calibration for on-machine measurement using vision.CAD’15, 12th annual International CAD Conference, Jun 2015, London, United Kingdom. 2015.
[8] Julia Schwaab, “Computer-aided image quality assessment in automated 3D breast ultrasound images”, University of Bermen, Germany, 2016.