© Associated Asia Research Foundation (AARF)
A Monthly Double-Blind Peer Reviewed Refereed Open Access International e-Journal - Included in the International Serial Directories.
Page | 320
EXPECTANCY-DISCONFIRMATION BASED ASSESSMENT OF
CUSTOMER SATISFACTION WITH ELECTRIC UTILITY IN
HARYANA
Sunita Saini
Department of Management Studies
Deenbandhu Chhotu Ram University of Science & Technology Murthal, Sonepat, India
ABSTRACT
Customer satisfaction has become a pivotal option for electric utilities in Haryana to tackle
with the soaring losses. This work assesses the customer satisfaction using
expectancy-disconfirmation paradigm which is based on analysis of the service quality. The quality of
company’s performance is judged against the customers’ needs. For this purpose,
SERVQUAL model having ten different dimensions has been employed for comparing the
company’s performance and the customers’ expectations. This work determines the customer
satisfaction depending on the result of SERVQUAL model, i.e., whether performance
confirms with the expectations or disconfirms. This empirical analysis has been carried out
by conducting the sample survey with 500 respondents from five districts in Haryana which is
served by UHBVN. Results of this study show that customers are satisfied with
communication service and empathy of the electric utility. They have negative perceptions
and are not satisfied with the company’s services with respect to other eight dimensions of
service quality.
Keywords – Customer satisfaction, SERVQUAL model, gap analysis, expectancy-disconfirmation.
International Research Journal of Human Resources and Social Sciences ISSN(O): (2349-4085) ISSN(P): (2394-4218) Impact Factor- 5.414, Volume 5, Issue 01, January 2018 Website- www.aarf.asia, Email : [email protected] , [email protected]
© Associated Asia Research Foundation (AARF)
A Monthly Double-Blind Peer Reviewed Refereed Open Access International e-Journal - Included in the International Serial Directories.
Page | 321
1. INTRODUCTION
Electricity distribution sector is reeling under losses which are badly impacting the
service quality of the electricity service sector (Saini, 2018a, 2018b). It can also be
understood in other way that poor service quality of electric utilities is causing financial loss
to them (Saini, 2017). Losses and service quality have interdependent relationship (Saini,
2018c). In both ways, service quality has become a serious matter of concern for the electric
utilities. In today’s competitive world, it has gained more momentum to make the company
stand in the fierce competition of the market. Though, the public sector has less competition,
even then,service quality largely determines the profitability of the electric utility (Bolton and
Drew, 1991; Singh et al., 2016). Since, customers have become more aware about their rights
about the services they are offered, raising the service quality has become the need of the
hour for electric utilities to sustain in the market. Beside appropriate quantity of electricity
supply, now, customers also expect good quality of supply and other related services which
are intangible. Consequently, measurement of the electricity services is not an easy task.
Focussing on the quality of power supplied, many authors have worked on the power quality
analysis of the electricity used by the customers (Saini&Kapoor, 2012; Kapoor&Saini, 2007;
Saini et al., 2011; Saini&Kapoor, 2010; Saini&Beniwal, 2018).
Measurement of service quality of the electric utilities becomes important as the level
of services offered to the customers is associated with the customer satisfaction
(GremlerandGwinner, 2000). Good service quality reflects the superiority/excellence (Taylor
&Baker, 1994) which further brings the customer satisfaction. Customer Satisfaction is
defined in many different ways in literature. Some authors define customer satisfaction as
post choice evaluative judgement related to a particular service paid for. Customer
satisfaction is the result of assessment made by the customer of upto what level the utility
services fulfil their expectations (Bruhn, 2003). The most widely employed model for this
assessment is expectancy-disconfirmation paradigm. Expectancy-disconfirmation paradigm
depends on the customer expectations from the utility services and by how much the actual
service disconfirms with the expectations (Oliver 1981). Positive disconfirmation, i.e., higher
level of company performance than expected performance, results into customers’
satisfaction and negative disconfirmation leads to customer dissatisfaction. Customers’
perceptions of company’s performance depend on the quality of the services delivered
(Cronin and Taylor, 1992) and on the evaluation of overall experience with the company
© Associated Asia Research Foundation (AARF)
A Monthly Double-Blind Peer Reviewed Refereed Open Access International e-Journal - Included in the International Serial Directories.
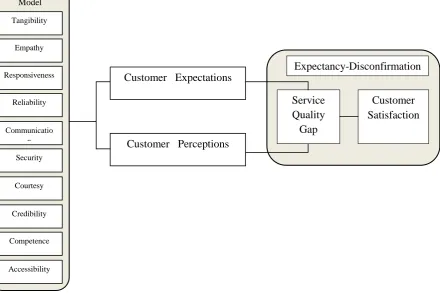
Page | 322 Expectancy-disconfirmation approach focuses on thedifference between the customer
expectations from company’sservices and actual performance of the company (Oliver, 1980).
Actual performance of the company forms the customers’perceptions towards its services.
Thus, the judgement of customer satisfaction using expectancy-disconfirmation paradigm is
based on the gap between customer expectations and their perceptions towards company’s
services on different dimensions.The relationship between customer satisfaction and the
service quality gap on different dimensions of services is indicated in Figure 1. A review of
the relevant literature also indicates that service quality is closely tied to customer satisfaction
(Wisniewski & Donnelly, 1996; Sureschander, Rajendran, &Nitecki, 2002).
Measurement of gap or service quality can be performed using service quality models.
There has been many models proposed for the measurement of service quality, but the most
reliable and exploited model is SERVQUAL model developed by Texas A& M University
(TAMU) Professors Valarie A. Zeithaml, A. Parasuraman, and Leonard L. Berry in 1980s
(Parasuraman et al., 1985; Parasuraman et al., 1988). SERVQUAL measures the customers’
needs and company performance at ten different dimensions, briefed below:
Tangibility: This dimension measures appearance of physical facilities, equipments, personnels, and different related materials.
Reliability: This dimension measures ability to perform the promised service dependably and
© Associated Asia Research Foundation (AARF)
A Monthly Double-Blind Peer Reviewed Refereed Open Access International e-Journal - Included in the International Serial Directories.
[image:4.595.83.524.58.352.2]Page | 323 Figure 1. Schematic Diagram for Relationship between Service Quality and Customer
Satisfaction
Responsiveness: This dimension measures willingness to help customers and provide prompt
service.
Competence: This dimension measures possession of required skill and knowledge in vague
to perform the demanded service.
Courtesy: This dimension measures politeness, respect, consideration and friendliness of
contact personnel.
Credibility: This dimension measures trustworthiness, believability, honesty of the service
provider.
Security: This dimension measures freedom from danger, risk, or doubt.
Accessibility: This dimension measures approachability and ease of contact.
Communication: This dimension measures listening to its customers and acknowledging
their comments.
Empathy: This dimension measures the company’s tendency of giving personal attention to
the customers for their well-being.
All these dimensions of SERVQUAL model have been considered in this work for
analysing the service quality of the electric utility. In this study, empirical study has been
Tangibility
Empathy
Responsiveness
Reliability
Communicatio n Security
Courtesy
Credibility
Competence
Accessibility SERVQUAL
Model
Customer Expectations
Customer Perceptions
Service Quality Gap
© Associated Asia Research Foundation (AARF)
A Monthly Double-Blind Peer Reviewed Refereed Open Access International e-Journal - Included in the International Serial Directories.
Page | 324 undertaken using the well-structured questionnaire based on SERVQUAL model (Saini et al.,
2018). The model gives the gap which defines the disconfirmation/confirmation of customer
expectations with the services they are offered. Using the expectancy-disconfirmation
paradigm, customer satisfaction is determined on the basis of confirmation-disconfirmation.
2. OBJECTIVES OF THE STUDY
This study aims at the assessment of customer satisfaction with UHBVN, electricity
distribution company serving northern districts of Haryana. Based on the SERVQUAL model
and expectancy-disconfirmation paradigm, this paper comprises of following objectives:
1. To measure the gap between customer expectations and customer perceptions of
the services offered by electricity distribution company in Haryana.
2. To assess the customer satisfaction with the services offered by electricity
distribution company in Haryana.
3. RESEARCH HYPOTHESES
This study presents the assessment of customer satisfaction with the electricity
distribution company. Following null hypotheses have been framed for this study.
𝐻01: Customers are satisfied with tangibility of the electric utility.
𝐻02: Customers are satisfied with empathy of the electric utility.
𝐻03: Customers are satisfied with responsiveness of the electric utility.
𝐻04: Customers are satisfied with reliability of the electric utility.
𝐻05: Customers are satisfied with communication services of the electric utility.
𝐻06: Customers are satisfied with security in services of the electric utility.
𝐻07: Customers are satisfied with courtesy of the electric utility.
𝐻08: Customers are satisfied with credibility of the electric utility.
𝐻09: Customers are satisfied with competence of the electric utility.
𝐻010: Customers are satisfied with accessibility of the electric utility.
𝐻01to𝐻010 gives the null hypotheses concerned with different dimensions of services of the
electric utility. There is no interdependency between all these null hypotheses. In this work,
© Associated Asia Research Foundation (AARF)
A Monthly Double-Blind Peer Reviewed Refereed Open Access International e-Journal - Included in the International Serial Directories.
Page | 325
4. RESEARCH METHODOLOGY
Exploratory cum descriptive research design has been adopted in this study. This
study undertakes the empirical analysis using the collected data through sample survey in five
districts of Haryana State. Thus, respondents comprise of electricity customers of northern
Haryana where UHBVN caters the electricity need of the residents. In this study, stratified
random sampling has been used for the selection of respondents. There are eleven districts of
the State of Haryana which come under the jurisdiction area of UHBVNL. Randomly, five
districts have been chosen as different strata. Selected districts are Rohtak, Sonipat, karnal,
Panipat and Kurukshetra. Total sample population for all districts is taken as 500. Here,
population means electricity connections. Thus, the sample populationfor the survey is
calculated for each district using equation (1) as per stratified random sampling:
𝑆𝑎𝑚𝑝𝑙𝑒 𝑠𝑖𝑧𝑒 = 𝐷𝑜𝑚𝑒𝑠𝑡𝑖𝑐 𝑐𝑜𝑛𝑛𝑒𝑐𝑡𝑖𝑜𝑛𝑠 𝑜𝑓 𝑑𝑖𝑠𝑡𝑟𝑖𝑐𝑡
𝑇𝑜𝑡𝑎𝑙 𝑑𝑜𝑚𝑒𝑠𝑡𝑖𝑐 𝑐𝑜𝑛𝑛𝑒𝑐𝑡𝑖𝑜𝑛𝑠 𝑢𝑛𝑑𝑒𝑟 𝑈𝐻𝐵𝑉𝑁 × 500 (1)
As sample population comprises electricity connections, equation (1) gives number of
electricity customers asked to fill the questionnaire from each district.
This study performs the sample survey using well-structured questionnaire
instrument. The questionnaire consists of three parts: demographic profile, expectation
andperception. Demographic part collects the respondents’ personal information like age,
gender, category, education, monthly income, locality, and type of employment. Other two
parts of the questionnaire are designed on the basis of SERVQUAL model. Questionnaire
comprises of ten dimensions of SERVQUAL model, i.e., tangibility, empathy,
responsiveness, reliability, communication, security, courtesy, credibility, competence and
accessibility. Both expectation and perception part include five questions for each dimension.
The responses are collected through 5-point Likert scale varying from 1 (highly disagree) to 5
(highly agree). Empirical analysis on collected data has been done in SPSS (version 20.0)
software.
5. DATA ANALYSIS
5.1.Demographic Analysis
Demographic profile of customers like age, gender, education, income, category, type
of employment affects the customer expectations and perceptions regarding the service
© Associated Asia Research Foundation (AARF)
A Monthly Double-Blind Peer Reviewed Refereed Open Access International e-Journal - Included in the International Serial Directories.
Page | 326 have high expectations from the utility company. Similar to education, all other demographic
characteristics affect the customers’ expectation and perception differently. Therefore,
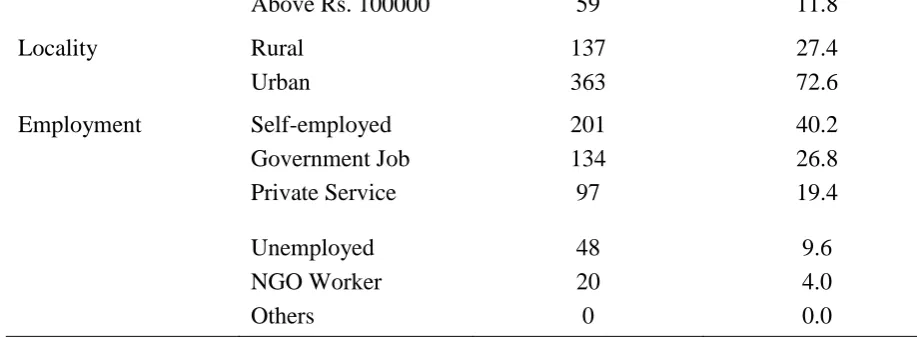
demographic analysis of 500 respondents is carried out in the present study. Table 1 shows
the demographic profile of respondents in terms of their age, gender, category, education,
monthly income, locality and type of employment.
Out of 500 respondents, maximum respondents (43%) are of age group 30-40 years
followed by age group 18-30 years (20.8%), age group 40-50 years (17.4%) and age group
50-60 years (13.8%). Most of the respondents (74%) are male and only 26% respondents are
female. 58.8% respondents belong to general category and 23.8% respondents belong to OBC
category. Rest of the respondents are of SC/ST category. Maximum respondents, i.e., 43.6%
are graduate and 21.8% respondents have studied upto 10+2. 11.4% respondents are matric
passed and 6.8% respondents are illiterate also. 11.8% respondents are post-graduate/above
[image:7.595.70.528.335.743.2]whereas 4.6% respondents have another qualification.
Table 1.Demographic Profile of Respondents
Variable Category Frequency Percent
Age 18-30 years 104 20.8
30-40 years 215 43.0
40-50 years 87 17.4
50-60 years 69 13.8
Above 60 years 25 5.0
Gender Male 370 74.0
Female 130 26.0
Category General 294 58.8
OBC 119 23.8
SC/ST 87 17.4
Education Illiterate 34 6.8
Matric 57 11.4
Upto 10+2 109 21.8
Graduate 218 43.6
Post Graduate/ Above
59 11.8
Others 23 4.6
Monthly Income UptoRs. 10000 107 21.4
Rs. 10000-50000 194 38.8
© Associated Asia Research Foundation (AARF)
A Monthly Double-Blind Peer Reviewed Refereed Open Access International e-Journal - Included in the International Serial Directories.
Page | 327
Above Rs. 100000 59 11.8
Locality Rural 137 27.4
Urban 363 72.6
Employment Self-employed 201 40.2
Government Job 134 26.8
Private Service 97 19.4
Unemployed 48 9.6
NGO Worker 20 4.0
Others 0 0.0
Locality-wise, 27.4% respondents account for rural residents and 72.6% respondents account
for urban residents. Among all respondents, 21.4% and 38.8% respondents are earning upto
Rs. 10,000 and upto Rs. 50,000 respectively in a month. 28% respondents have monthly
income between Rs. 50,000 and Rs. 1,00,000 and 11.8% respondents have above Rs.
1,00,000. 40.2% respondents do their own business and 26.8% are Government employees.
19.4% respondents work in private companies and 4% respondents are NGO workers. All the
respondents belong to different demographic profile which has implications on what they
expect from electric utility and how they perceive the services of electric utility.
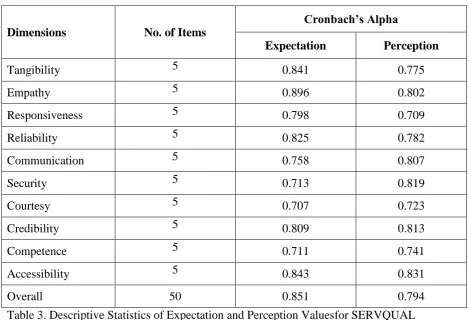
5.2.Reliability Analysis
Prior to empirical analysis of the collected data, reliability of the survey instrument
has been checked by calculating the Cronbach coefficient alpha (Cronbach, 1951). This
coefficient also gives the internal reliability of the collected data of different dimensions. For
the instrument and the collected data to be considered valid for survey, Cronbach alpha
should be more than 0.70 (Nunally, 1978). To perform the reliability analysis, Cronbach
alpha’s value has been computed for all ten dimensions of SERVQUAL model in case of
customer expectations. Same coefficient is calculated for all dimensions of customer
perceptions. The reliability of all dimensions of expectations and perceptions is shown in
Table 2. As, it is observed from Table 2, that all dimensions of expectation and perception
have value of alpha above than 0.70. Overall reliability coefficient in case of expectation
and perception is also high. Thus, the designed instrument is considered valid for doing the
survey and collecting reliable data for analysis. Consequently, collected data is also reliable
[image:8.595.63.522.41.210.2]© Associated Asia Research Foundation (AARF)
A Monthly Double-Blind Peer Reviewed Refereed Open Access International e-Journal - Included in the International Serial Directories.
Page | 328 5.3. Descriptive analysis
For descriptive analysis of the collected data, mean of customers’ expectations and
perceptions towards each statementis computed in SPSS (version 20.0) software. The
descriptive statistics of the
Table 2. Reliability Analysis
Dimensions No. of Items
Cronbach’s Alpha
Expectation Perception
Tangibility 5 0.841 0.775
Empathy 5 0.896 0.802
Responsiveness 5 0.798 0.709
Reliability 5 0.825 0.782
Communication 5 0.758 0.807
Security 5 0.713 0.819
Courtesy 5 0.707 0.723
Credibility 5 0.809 0.813
Competence 5 0.711 0.741
Accessibility 5 0.843 0.831
[image:9.595.65.535.144.464.2]Overall 50 0.851 0.794
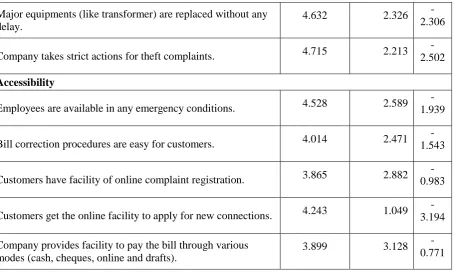
Table 3. Descriptive Statistics of Expectation and Perception Valuesfor SERVQUAL
Dimensions
Statements Expectation Perception Gap
Tangibility
The company has modern tools and technology. 4.325 3.324 -1.001
The company has well managed offices. 4.985 4.280
-0.705 Forms (for new connections, load change etc.) are simply
written in regional languages.
4.564 4.393
-0.171 The records (of electricity connection, bills and meter, etc.) are
maintained properly.
4.680 3.453
-1.227
© Associated Asia Research Foundation (AARF)
A Monthly Double-Blind Peer Reviewed Refereed Open Access International e-Journal - Included in the International Serial Directories.
Page | 329 Employees personally attend the customers for their queries
and complaints.
4.521 4.612 0.091 Company staff has operating hours suitable to customer’s
needs.
4.073 4.112 0.039 Rural customers get subsidies in electricity bill. 4.335 4.452 0.117 Company motivates the customers to use energy saving bulbs,
fans and other products.
4.200 4.269 0.069 The bill collection centers are near to the customer’s residence. 4.238 4.507 0.269 Responsiveness
There are not long queues at bill collection centers. 4.377 4.187 -0.190
Employees quickly respond to customers’ complaints.
4.520 3.607
-0.913
Every electricity office has helpdesk for enquiry.
4.235 3.260
-0.975
Company gives information in advance for power cuts.
4.078 2.673
-1.405 Customers get the satisfactory service in the first visit to the
company office.
4.632 3.900
-0.732 Reliability
Employees give reliable answers to customers’ enquiries. 4.560 3.453 1.107
-The company provides correct electricity bills. 4.613 4.004 -0.609
Customers get full voltage all the time. 4.875 2.927
-1.948
Company gives 24 hours supply. 4.407 2.589
-1.818
Meter reader honestly notes correct reading from the meter. 4.860 3.642 -1.218 Communication
Prior information about due date of bill is given to customers through phone.
4.523 4.627 0.104 Company provides toll-free numbers for enquiries. 4.658 4.786 0.128 Employees communicate with customers in regional language. 4.501 4.512 0.011 Company runs awareness programs through advertisement,
social media and newspapers.
4.774 4.881 0.107 Company gives notice before disconnection of meter. 4.652 4.742 0.090 Security
-© Associated Asia Research Foundation (AARF)
A Monthly Double-Blind Peer Reviewed Refereed Open Access International e-Journal - Included in the International Serial Directories.
Page | 330 0.910 Employees show ID proof while visiting to customer premises
(for meter reading etc.).
4.617 2.632
-1.985
Company does timely maintenance of transformers. 4.864 3.024 -1.840 Supply lines are far from the reach of customers. 4.895 2.019
-2.876
Company properly seals the electricity meters. 4.760 3.685 -1.075 Courtesy
Employees behave respectfully with the customers. 4.523 2.981 -1.542
Behavior of the employees is same with all the customers. 4.401 3.662 -0.739 At the entrance of electricity office, ramps are available for the
physically challenged customers.
4.345 3.814
-0.531 Expertise staff is available to properly deal with physically
challenged (deaf, dumb, blind) customers.
4.285 1.467
-2.818
Customers get new connection with less formalities. 4.766 2.741 -2.025 Credibility
Company does repairing of equipments without charging money from customers.
4.261 3.587
-0.674
The supply is restored within the minimum time. 4.753 2.074 -2.679 Electricity bills are provided by the company at the time of
meter reading.
3.562 1.045
-2.517 Customers have secured toll free number/online facility to
report against employees.
4.027 1.872
-2.155
Electricity meter runs at normal speed. 4.886 4.321
-0.565 Competence
Billing is done on monthly basis. 3.654 1.493
-2.161 Employees ensure the safety of customers after repairing and
maintenance work.
4.627 2.247
-2.380 Customers get the electricity bill at least 7 days before due
date.
4.812 4.269
© Associated Asia Research Foundation (AARF)
A Monthly Double-Blind Peer Reviewed Refereed Open Access International e-Journal - Included in the International Serial Directories.
Page | 331 Major equipments (like transformer) are replaced without any
delay.
4.632 2.326
-2.306
Company takes strict actions for theft complaints. 4.715 2.213 -2.502 Accessibility
Employees are available in any emergency conditions. 4.528 2.589 -1.939
Bill correction procedures are easy for customers. 4.014 2.471 -1.543
Customers have facility of online complaint registration. 3.865 2.882 -0.983
Customers get the online facility to apply for new connections. 4.243 1.049 -3.194 Company provides facility to pay the bill through various
modes (cash, cheques, online and drafts).
3.899 3.128
-0.771
[image:12.595.76.530.34.306.2]responses collected from respondents using SERVQUAL based questionnaire, is shown in
Table 3. Almost all the statements of every dimension have mean value of expectation higher
than 4. This shows that customers belonging to different demographic profile have high
expectations from the company with respect to every dimension. But the customers’ perceptions are not that much high for every dimension. Company’s services meet the
customer expectations about communication and empathy dimension of the services. In other
words, customer perceptions are higher than their expectations on communication and
empathy dimension. These observations show that company’s performance is not remarkably
good with regard to other eight dimensions of SERVQUAL model.
Table 4 shows the average gap between mean value of customer expectations and
perceptions on different dimensions. Gap between expectations and perceptions reflects the
level of service quality of the company. As gap is calculated using equation (1) and listed in
Table 4, all dimensions except communication and empathy have negative gap. This shows
that overall customers’ expectations are very high as compared to their perceptions towards company’s performance. They do not get the services as expected from the company on eight
dimensions, i.e., tangibility, reliability, responsiveness, security, competence, credibility,
courtesy and accessibility. Among all these eight dimensions, there is lowest gap (-0.751)
with regard to tangibility services. Different dimensions, arranged sequentially according to
© Associated Asia Research Foundation (AARF)
A Monthly Double-Blind Peer Reviewed Refereed Open Access International e-Journal - Included in the International Serial Directories.
Page | 332 accessibility (-1.685), courtesy (-1.531), reliability (-1.34), responsiveness (-0.843) and
tangibility (-0.751). This sequence has lowest performing dimension first, followed by highly
performing dimensions. Thus, competence is the weakest dimension of the company’s
services and communication is the strongest dimension.
5.4. Hypothesis Testing
For testing the hypotheses, expectancy-disconfirmation paradigm is used. According
to disconfirmation theory, if the mean value of perceptions exceeds the mean value of
expectations, customer is satisfied. Customers are dissatisfied if their expectations exceed the
[image:13.595.66.531.262.470.2]perceptions. In other
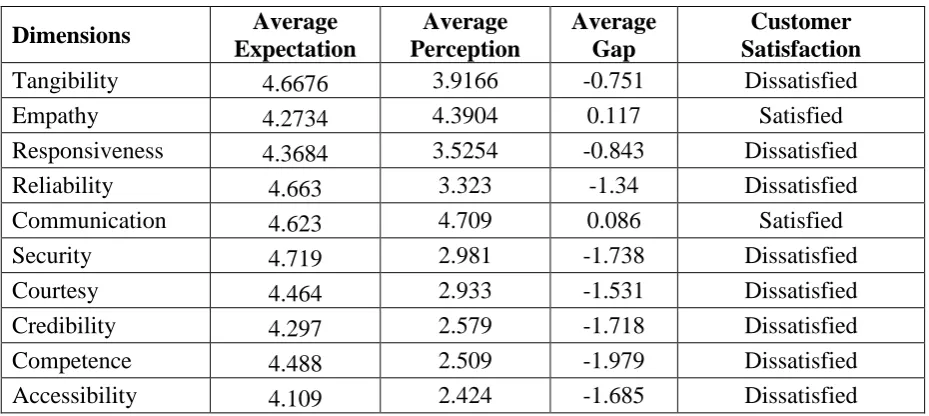
Table 4.Paired T-Test for SERVQUAL Dimensions
Dimensions Average
Expectation
Average Perception
Average Gap
Customer Satisfaction
Tangibility 4.6676 3.9166 -0.751 Dissatisfied
Empathy 4.2734 4.3904 0.117 Satisfied
Responsiveness 4.3684 3.5254 -0.843 Dissatisfied
Reliability 4.663 3.323 -1.34 Dissatisfied
Communication 4.623 4.709 0.086 Satisfied
Security 4.719 2.981 -1.738 Dissatisfied
Courtesy 4.464 2.933 -1.531 Dissatisfied
Credibility 4.297 2.579 -1.718 Dissatisfied
Competence 4.488 2.509 -1.979 Dissatisfied
Accessibility 4.109 2.424 -1.685 Dissatisfied
words, negative gap shows disconfirmation of expectations with expectations and positive
gap reflects confirmation of expectations with perceptions. Table 4 showsthe average value
of customer expectations and perceptions and the gap between them for all ten dimensions of
SERVQUAL model. Gap for tangibility is negative showing customer dissatisfaction. This
rejects the null hypothesis 𝐻01. Gap for empathy is positive which means company
performance higher above the customer expectations. So, 𝐻02 null hypothesis is accepted.
Gaps for responsiveness and reliability are negative. Thus, customers are dissatisfied with
responsiveness and reliability of the company’s services. Therefore, 𝐻03 and 𝐻04 hypotheses
are rejected. 𝐻05hypothesis is accepted because of positive gap value.All other dimensions
(security, courtesy, credibility, competence and accessibility) have negative gap.
Consequently, hypotheses 𝐻06, 𝐻07, 𝐻
08, 𝐻09 and 𝐻010 are rejected on the basis of
© Associated Asia Research Foundation (AARF)
A Monthly Double-Blind Peer Reviewed Refereed Open Access International e-Journal - Included in the International Serial Directories.
Page | 333
6. CONCLUSION
This study concludes that that company’s performance is not meeting the customer
expectations on eight dimensions (tangibility, reliability, responsiveness, security, credibility,
courtesy, accessibility and competence) of SERVQUAL model. There is huge gap between
customers’ expectations and perceptions towards the company’s services. In this work, customers’ satisfaction is assessed using expectancy-disconfirmation paradigm. Using this
approach, customers are found not satisfied with the company’s performance on these eight
dimensions whereas, for communication and empathy dimension, company’s services are
higher than customer expectations leading to positive gap. This results into customer
satisfaction with the company’s communication services and empathy. Findings of this study
point out the eight dimensions on which company need to focus on improving the level of
their services.
7. PRACTICAL IMPLICATIONS
The present study analyses the customer expectations and perceptions towards
UHBVN. As the results suggest that there are only two dimensions of service quality, i.e.,
communication and empathy where the company is performing well. The company managers
can assess their service quality by studying the customer perceptions collected in this work.
With the limited resources, the company needs to prioritize their focus on the niche areas
carved out by this study which are tangibility, reliability, responsiveness, security,
accessibility, credibility, courtesy, and competence. This analysis facilitates the company to
explore about the weakest and the strongest dimension and also gives the clear vision of
estimates about how much the company is lagging on different dimensions. Thus, it would
help in deciding the management strategies to improve their level of services and increase the
customer satisfaction level which will indirectly increase their profitability also.
8. LIMITATIONS OF THE STUDY
This study covers analysis of primary data collected from the customers of one
distribution company, UHBVN. More comprehensive view can be taken by surveying all the
districts served by UHBVN. This study can also be made to give more inclusive results if it is
extended for other distribution companies so that performance of different distribution
companies can be compared with respect to different dimensions. Analysis over the complete
© Associated Asia Research Foundation (AARF)
A Monthly Double-Blind Peer Reviewed Refereed Open Access International e-Journal - Included in the International Serial Directories.
Page | 334 to be worked upon to improve their service quality and raise the customer satisfaction and
customer loyalty.
References
[1] S. Saini, Scenario of Distribution Losses – A Case Study from Haryana, International
Journal of Research in Economics and Social Science, Accepted, 2018a.
[2] S. Saini, Electricity Theft – A Primary Cause of High Distribution Losses in Indian
State, International Research Journal of Management & Commerce, Accepted, 2018b.
[3] S. Saini, Social and behavioral aspects of electricity theft: An explorative review,
International Journal of Research in Economics and Social Sciences, 7(6), 2017, 26-37.
[4] S. Saini,Malpractice of Electricity Theft: A Major Cause of Distribution Losses in
Haryana, International Research Journal of Management & Commerce, Accepted,
2018(c).
[5] R.N. Bolton, J.H. Drew, A longitudinal analysis of the impact of service changes on
customer attitudes. Journal of Marketing, 55(1),1991, 1–9.
[6] R. Singh, Satpal and S. Saini, Power Sector Development in Haryana, International
Journal of Science, Technology and Management, 5, 2016, 278-285.
[7] M.K. Saini and R. Kapoor, Multiwavelet transform based classification of PQ events,
International Transactions on Electrical Energy Systems,22(4), 2012, 518-532.
[8] R. Kapoor and M.K. Saini, A new signal processing technique for power system
disturbance detection and classification, Institution of Engineers India Part-EL,88,
2007, 9-14.
[9] M.K. Saini et al., PQ events classification and detection – a survey, 2nd IEEE
International Conference on Sustainable Energy and Intelligent system, Chennai,2011,
490-495.
[10] M.K. Saini and R. Kapoor, Classification of nonlinear power quality events based on
multiwavelet transform, International Journal of Nonlinear Science,10(3), 2010,
279-286.
[11] M.K. Saini and R. Beniwal, Recognition of Multiple PQ issues using Modified EMD
and Neural Network Classifier, Iranian Journal of Electrical and Electronics
Engineering. 2018, Accepted.
[12] D.D. Gremler, K.P. Gwinner, Customer-employee rapport in service relationships,
© Associated Asia Research Foundation (AARF)
A Monthly Double-Blind Peer Reviewed Refereed Open Access International e-Journal - Included in the International Serial Directories.
Page | 335 [13] S.A. Taylor, T.L. Baker, An Assessment of the relationship between service quality
and customer satisfaction in the formation of consumers’ purchase intentions, Journal
of Retailing, 70(2), 1994, 163-178.
[14] Manfred Bruhn, Internal service barometers", European Journal of Marketing, 37(9),
2003, 1187 – 1204
[15] R.L. Oliver, Measurement and Evaluation of Satisfaction Processes in Retail Settings
Journal of Retailing, 57(3), 1981, 25-48.
[16] J. Cronin, Measuring service quality;a re-examination and extension, The Journal of
Marketing,56(3),1992, 55-68.
[17] N. Johns, What is this thing called service? European journal of marketing,
33(9/10),1999, 958-973.
[18]Oliver, L. Richard, A Cognitive Model of the Antecedents and Consequences of
Satisfaction Decisions, Journal of Marketing Research, 17, 1980, 46-49.
[19] M. Wisniewski, M. Donnelly,Measuring service quality in the public sector: The
potential for SERVQUAL, Total Quality Management and Business Excellence, 7(4),
1996, 357-366.
[20] G. Sureshchandar, C.A. Rajendran, The relationship between service quality and
customer satisfaction: A factor specific approach, Journal of Service Marketing, 16(4),
2002, 363-379.
[21] A. Parasuraman, V.A.Zeithaml, L.L. Berry, A conceptual model of service quality and
its implications for future research. Journal ofMarketing, 49, 1985, 41–50.
[22] A. Parasuraman, V.A. Zeithaml, L.L. Berry, SERVQUAL: a multiple item scale for
measuring customer perceptions of service quality, Journal of Retailing, 64, 1988, 2–
40.
[23]S. Saini, R. Singh,Satpal, Service quality assessment of utility company in Haryana
using SERVQUAL model, Asian Journal of Management, Accepted, 2018.
[24]J.C. Nunnally, Psychometric Theory(McGraw-Hill, New York,1978).
[25]L.J. Cronbach, Coefficient Alpha and the Internal Structures of Tests, Psychometrika,