A STUDY ON PROFITABILITY ANALYSIS OF SELECTED IT COMPANIES IN INDIA
Dr.T.AMBIKA
Assistant Professor in Commerce,
Kaamadhenu Arts & Science college, Sathyamangalam.
Abstract
Financial Performance in broader sense refers to the degree to which financial
objectives being or has been accomplished and is an important aspect of finance risk
management. It is the process of measuring the results of a firm's policies and operations in
monetary terms. It is used to measure firm's overall financial health over a given period of
time and can also be used to compare similar firms across the same industry or to compare
industries or sectors in aggregation.
Keywords: Financial, management, monetary, industry, firms.
AN INTRODUCTION OF INFORMATION TECHNOLOGY
The Information Technology (IT) industry has become of the most robust industries in
the world. IT more than any other industry or economic factor, has an increased productivity,
particularly in the developed world, and therefore is a key driver of global economic growth.
Economies of scale and insatiable demand from both consumers and enterprises characterize
this rapidly growing sector.
The Indian Information Technology (IT) industry has played a major role in placing
India on the International map. The industry mainly governed by IT software and facilities
for instance system integration, software experiments, Custom Application Development and
Maintenance (CADM), network services and IT solutions
The Information Technology Association of America (ITAA) explains‟ information technologies‟ as encompassing all possible aspects of information systems based on
computers.Both software development and the hardware involved in the IT industry include
everything from computer systems to the design, implementation, study and development of
IT and management system.
Owing to its easy accessibility and the wide range of IT products available, the
demand of IT services has increased substantially over the year. The IT sector has emerged as
a major global source of both growth and development.
The IT industry has also created significant demand in the Indian education sector,
especially for engineering and computer science. The Indian IT and ITS industry is divided
into four major segments – IT services, Business Process Management (BPM), software
products and engineering services, and hardware.
OVERVIEW OF IT INDUSTRY
The last decade in the global arena has witness a tremendous growth in the area of
information technology. Rapid advances in the technologies for communication media like
television, computer, internet, printing and publishing has enabled us to get prompt access to
required information. Information technology (IT) has become one of the most robust
industries in the world. It, more than any other industry or economic facet, has increased
productivity, particularly in the developed world, and therefore is a key driver of global
economic growth. The IT sector has emerged as a major global source of both growth and
employment.
Information Technology (IT) is an important emerging sector of the Indian Economy. This paper examines the India‟s IT industry and also studied the impact of IT on the Indian
Economy. The IT sector has served as a fertile ground for the growth of a new
entrepreneurial class with innovative corporate practices and has been instrumental in reversing the brain drain, raising India‟s brand equity and attracting foreign direct investment
(FDI) leading to other associated benefits.
OBJECTIVES OF THE STUDY
The major objectives of this study are to examine and evaluates the financial
performance and financial position of the selected IT companies. The specific objectives are
as follows:
To analysis the Profitability position of selected IT companies in India. To analysis the liquidity position of selected IT companies in India.
To offer valuable suggestions for a better and improve the performance of the selected
METHODOLOGY
The study is explorative in nature and based on secondary data. The data for the study
consists of various financial statements of selected companies listed in the Bombay Stock
Exchange (BSE). The selected IT companies has been purposively selected and used as a
sample for the study. Initially, it was decided to keep in the sample of all the companies
under IT industry. However, on the further scrutiny it was found that only some companies
have the data for the entire study period, while the others not available for research. The
inclusions of companies, which possess data for heterogeneous period of time undoubtedly,
will disort the method of study. Hence, they have been excluded. In total, five companies are
finally selected for research namely Tech Mahindra Ltd, Infosys Ltd, HCL Technologies Ltd,
Tata Consultancy Services Ltd and WIPRO Ltd. The data has been collected from the official
websites of selected IT companies.
Tools used for analysis
The tools used for the present study are as follows: Ratio Analysis
Mean
Standard Deviation
LIMITATIONS OF THE STUDY
1. The sample size was limited to 5 Companies.
2. The study has been conducted for a limited period of time.
3. The financial performance is not compared with similar companies in the same
industry.
4. The figures taken from the financial statements for the analysis were historic in nature,
the time value of money is not being used.
Ratio Analysis
Ratio analysis is an accounting tool, which can be used to measure the solvency, the
profitability, and the overall financial strength of a business, by analyzing its financial
accounts (specifically the balance sheet and the profit and loss account).
PROFITABILITY RATIO
Profitability ratio is an indication of the efficiency with which the operations of the
profits. A lower profitability may arise due to the lack of control over the expenses. Bankers
and financial institutions look at the profitability ratios is an indicator whether or not the firm
earns substantially more than it pays interest for the use of borrowed funds and whether the
ultimate, repayment on their debt appears reasonably certain. Owners are interested to know
the profitability as it indicates the return which they can get on their investment.
GROSS PROFIT RATIO
Gross profit ratio measures the relationship of gross profit to net sales and is usually
represented as a percentage is usually represented as a percentage. Thus, it is calculated by
dividing the gross profit by sales. The Table 4.12 shows the gross profit ratio for selected IT
companies during the financial years from 2011-2012 to 2015-2016.
𝑮𝑹𝑶𝑺𝑺 𝑷𝑹𝑶𝑭𝑰𝑻 𝑹𝑨𝑻𝑰𝑶 =𝑮𝒓𝒐𝒔𝒔 𝑷𝒓𝒐𝒇𝒊𝒕
[image:4.595.76.523.355.567.2]𝑵𝒆𝒕 𝑺𝒂𝒍𝒆𝒔 𝒙 𝟏𝟎𝟎 Table 1.1
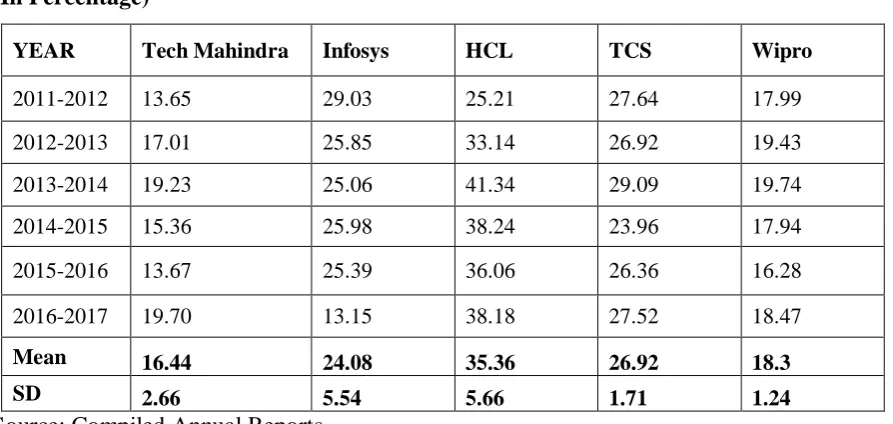
GROSS PROFIT RATIO OF SELECTED IT COMPANIES (In Percentage)
YEAR Tech Mahindra Infosys HCL TCS Wipro
2011-2012 13.65 29.03 25.21 27.64 17.99
2012-2013 17.01 25.85 33.14 26.92 19.43
2013-2014 19.23 25.06 41.34 29.09 19.74
2014-2015 15.36 25.98 38.24 23.96 17.94
2015-2016 13.67 25.39 36.06 26.36 16.28
2016-2017 19.70 13.15 38.18 27.52 18.47
Mean 16.44 24.08 35.36 26.92 18.3
SD 2.66 5.54 5.66 1.71 1.24
Source: Compiled Annual Reports
Table 1.1 shows that, the average gross profit ratio is highest for 41.34 percentage of
HCL followed by, 29.09 percentages for TCS, 29.03 percentages of Infosys, Wipro at 19.74
percentages, and 19.23 percentage of Tech Mahindra are minimum. Hence, it is conveys that
HCL is in better position in comparison to remaining four companies.
During the financial years from 2011-2012 to 2016-2017 the standard deviation is
highest for 5.66 percentage of HCL followed by, Infosys at 5.54 percentage, 2.66 percentage
Tech Mahindra, 1.71 percentage of TCS, and 1.24 percentage of Wipro minimum. It indicates
NET PROFIT RATIO
Net profit ratio establishes a relationship between net profit (after take) and sales, and
indicates the efficiency of the management in manufacturing, selling, administrative and other activities of the firm. This ratio is the overall measures of firm‟s profitability. The Table
4.13 shows the net profit ratio for selected IT companies during the financial years from
2011-2012 to 2016-2017.
𝑵𝑬𝑻 𝑷𝑹𝑶𝑭𝑰𝑻 𝑹𝑨𝑻𝑰𝑶 = 𝑵𝒆𝒕 𝑷𝒓𝒐𝒇𝒊𝒕
[image:5.595.74.523.304.529.2]𝑵𝒆𝒕 𝑺𝒂𝒍𝒆𝒔 𝒙 𝟏𝟎𝟎 Table 1.2
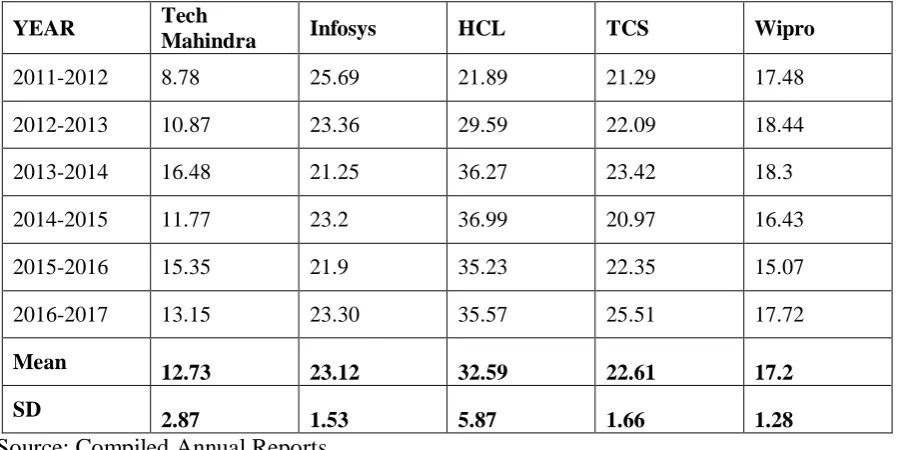
NET PROFIT RATIO OF SELECTED IT COMPANIES (In Percentage)
YEAR Tech
Mahindra Infosys HCL TCS Wipro
2011-2012 8.78 25.69 21.89 21.29 17.48
2012-2013 10.87 23.36 29.59 22.09 18.44
2013-2014 16.48 21.25 36.27 23.42 18.3
2014-2015 11.77 23.2 36.99 20.97 16.43
2015-2016 15.35 21.9 35.23 22.35 15.07
2016-2017 13.15 23.30 35.57 25.51 17.72
Mean 12.73 23.12 32.59 22.61 17.2
SD 2.87 1.53 5.87 1.66 1.28
Source: Compiled Annual Reports
Table 1.2 shows that, the average net profit ratio is highest for, 36.99percentage of
HCL followed by, 25.69 percentages of Infosys, at 25.51percentage of TCS, 18.44 percentage
Wipro, and 8.78 percentage of Tech Mahindra are minimum. Hence, it is conveys that HCL
is in better position in comparison to remaining four companies.
During the financial years from 2011-2012 to 2016-2017 the standard deviation is
highest for 5.87 percentage of HCL followed by 2.87 percentage of Tech Mahindra, 1.66
percentage of TCS, Infosys at 1.53 percentage ,and minimum Wipro at 1.28 percentage. It
indicates that better and consistent performance by HCL it among four companies
LIQUIDITY RATIO
Liquidity refers to the ability of a concern to meet its current as and when these
become due. The short-term obligations are met by realizing amounts from current, floating
on circulating assets. The current assets should either be liquid or near liquid. These should
be convertible into cash for paying obligations of short-term nature. The sufficiency or in
sufficiency of current assets should be assessed by comparing them with short-term
liabilities.
CURRENT RATIO
Current ratio is an indicator of the company commitment to meet its short term
liabilities. An ideal current ratio is 2:1. The ratio is considered as a safe margin of solvency.
Current ratio is an index of the concerns financial stability.
The Table 1.3 shows the current ratio for selected IT companies during the financial
years from 2011-2012 to 2016-2017.
[image:6.595.98.501.434.654.2]𝑪𝑼𝑹𝑹𝑬𝑵𝑻 𝑹𝑨𝑻𝑰𝑶 = 𝑪𝑼𝑹𝑹𝑬𝑵𝑻 𝑨𝑺𝑺𝑬𝑻𝑺 𝑪𝑼𝑹𝑹𝑬𝑵𝑻 𝑳𝑰𝑨𝑩𝑰𝑳𝑰𝑻𝑰𝑬𝑺 Table 1.3
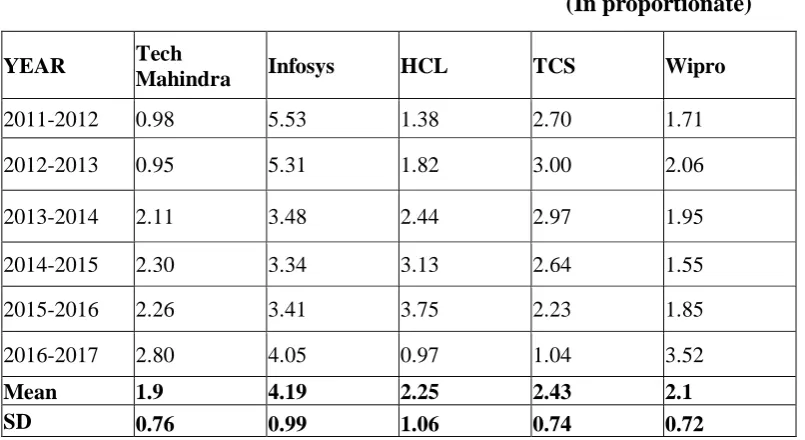
CURRENT RATIO OF SELECTED IT COMPANIES
(In proportionate)
YEAR Tech
Mahindra Infosys HCL TCS Wipro
2011-2012 0.98 5.53 1.38 2.70 1.71
2012-2013 0.95 5.31 1.82 3.00 2.06
2013-2014 2.11 3.48 2.44 2.97 1.95
2014-2015 2.30 3.34 3.13 2.64 1.55
2015-2016 2.26 3.41 3.75 2.23 1.85
2016-2017 2.80 4.05 0.97 1.04 3.52
Mean 1.9 4.19 2.25 2.43 2.1
SD 0.76 0.99 1.06 0.74 0.72
Source: Compiled Annual Reports
Table 1.3 shows that, the current ratio is highest for Infosys at 5.53 proportionate
Mahindra and 2.06 proportionate of Wipro are minimum. Hence, it is conveys that Infosys in
better position in comparison to remaining four companies.
During the financial years from 2011-2012 to 2016-2017 the standard deviation is
highest for 1.06 proportionate of HCL followed by Infosys at 0.99 proportionate, 0.76
proportionate of Tech Mahindra, 0.74 proportionate of TCS and 0.72 proportionate of Wipro.
It indicates that better and consistent performance by HCL among four companies
comparatively.
QUICK RATIO
Liquidity ratio is more rigorous test of liquidity then current ratio. This ratio measures
the company capacity to pay off current obligations immediately. This ratio is calculated as
follows, the rule of thumb is 1:1. Liquid assets are combination of all current assets other than
prepaid and stock. The Table 4.2 shows the quick ratio for selected IT companies during the
financial years from 2011-2012 to 2015-2016.
[image:7.595.72.514.470.619.2]𝑸𝑼𝑰𝑪𝑲 𝑹𝑨𝑻𝑰𝑶 = 𝑳𝑰𝑸𝑼𝑰𝑫 𝑨𝑺𝑺𝑬𝑻𝑺 𝑪𝑼𝑹𝑹𝑬𝑵𝑻 𝑳𝑰𝑨𝑩𝑰𝑳𝑰𝑻𝑰𝑬𝑺 Table 1.4
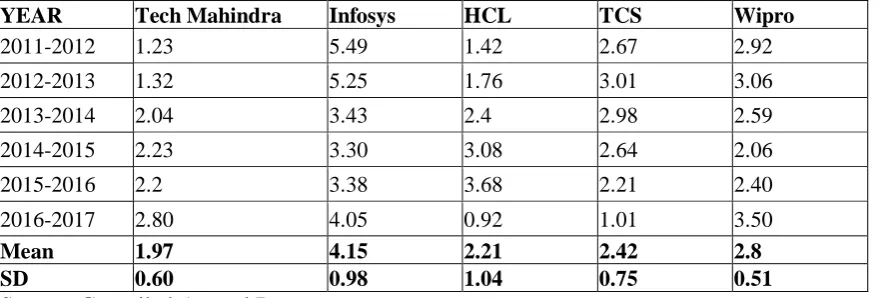
QUICK RATIO OF SELECTED IT COMPANIES (In Proportionate)
YEAR Tech Mahindra Infosys HCL TCS Wipro
2011-2012 1.23 5.49 1.42 2.67 2.92
2012-2013 1.32 5.25 1.76 3.01 3.06
2013-2014 2.04 3.43 2.4 2.98 2.59
2014-2015 2.23 3.30 3.08 2.64 2.06
2015-2016 2.2 3.38 3.68 2.21 2.40
2016-2017 2.80 4.05 0.92 1.01 3.50
Mean 1.97 4.15 2.21 2.42 2.8
SD 0.60 0.98 1.04 0.75 0.51
Source: Compiled Annual Reports
Table 1.4 shows that, the average quick ratio is highest for 5.49 proportionate of
Infosys followed by 3.06 proportionate of Wipro, 2.23 proportionate of Tech Mahindra, TCS
at 3.01 proportionate and 0.35 proportionate for HCL are minimum. Hence, it is conveys that
During the financial years from 2011-2012 to 2015-2016 the standard deviation is
highest for Infosys at 3.30 proportionate followed by 2.21 proportionate of TCS, 2.06
proportionate of Wipro, 1.42 proportionate of HCL. and minimum 1.23 proportionate of Tech
Mahindra It indicates that better and consistent performance by Infosys among four
companies comparatively.
FINDINGS
The average current ratio is highest for Infosys at 5.53 proportionate
The average quick ratio is highest for 5.49 proportionate
The average gross profit ratio is highest for 41.34 times of HCL
The average net profit ratio is highest for 23.42 times of TCS
SUGGESTIONS
In the present study, it is found that the Tech Mahindra Limited has been able to
achieve high scores on the various profitability ratios and this has positive impact on
its liquidity ratios. Hence, it is suggested that this company may be referred as the „hidden champion‟ and it could be used as a best practice by the other companies also.
Furthermore it is suggested that the IT companies can improve its profitability by
managing its working capital more efficiently and aggressively.
CONCLUSION
The IT industry in India is dominated by around 20 companies, which account for
almost 70% of the total IT production in India. The IT industry in India is currently growing
at an enviable pace. More growth in the Indian IT industry is expected in the coming years. It
is currently going through a technological change as a lot of up gradation and assimilation is
taking place. Hence, this attempt is made to know the financial performance of selected IT
companies in India and their overall performance is good. Some differences were found from
the study and suggestions were made from it. It is expected that the selected IT companies
may increase their performance if they consider the suggestions made from the findings of
Reference
1. Gupta S.P.,“Statistical Methods”, New Delhi: Sultan Chands & Sons, 2010.
2. Kothari C.R., “Research Methodology”, methods and techniques, wishwa
prakasham new age international publications (p) Ltd. New Delhi , 2000.Nand
Kishore Sharma, Financial Analysis , RBSA publishers ,1998.
3. Rajashekhara K. S., “Application of IT in Banking”, Yojana, July 04
Vij Madhu, “The New World of Banking: A Paradigm shift”, Journal of
Management Research, Vol.3, December 2003.
4. Gulati V. P.,” Information Technology Application in Indian Banking: Better Late than Never!”, “NewsLetter”, Volume 6, No. 3, July 1996.
5. Ananthakrishnan, G” Customer Service in Banks”, Vinimaya, Vol. XXV, No.3,
(2004-05)