3534
CENTROID K-MEANS CLUSTERING OPTIMIZATION
USING EIGENVECTOR PRINCIPAL
COMPONENT ANALYSIS
MUSTAKIM
Data Mining Laboratory Department of Information System
Faculty of Science and Technology of Universitas Islam Negeri Sultan Syarif Kasim Riau 28293, Pekanbaru, Riau, Indonesia
E-mail: [email protected]
ABSTRACT
K-Means is a very popular algorithm for clustering, it is reliable in computation, simple and flexible. However, K-Means also has a weakness in the process of determining the initial centroid, the change in value causes the change in resulting cluster. Principal Component Analysis (PCA) Algorithm is a dimension reduction method which can solve the main problem in K-Means by applying PCA eigenvector of covariance matrix as the initial centroid value on K-Means. From the results of conducted experiments with a combination of 4, 5 and 6 of attributes and the number of clusters, Davies Bouldin Index (DBI), Silhouette Index (SI) and Dunn Index (DI) cluster validity of PCA K-Means are better than the usual K-Means. It is implemented by testing 1,737 and 100,000 data, the result is the patterns formed by PCA K-Means can lower the value of DBI constantly, but for SI and DI, the formed pattern is likely to change. This study concluded that the cluster validity used as reference for comparing the algorithms is DBI.
Keywords: Covariance, Davis Bouldin Index, K-Means, PCA K-Means, Principal Component Analysis.
1. INTRODUCTION
In Data Mining technology, clustering is a process to solve the computational problems which can be applied in diverse data. Clustering data based on the features and characteristics is an important part of this technique [1]. But in general, clustering which is frequently used experiences various problems such as the algorithm used is prone to computational problems [2]. Data Mining has many algorithm models to cluster data based on certain feature and characteristic which refer to the attribute used, one of which is K-Means Clustering.
K-Means Algorithm is a very popular clustering technique in data mining [3] has the advantage that the clustering process can be done quickly because it has a relatively lighter computational load [4], easy to implement because of its simplicity [5] and flexible to the dataset used [6]. The performance of K-Means clustering is greatly affected when the dataset used has a high dimension. This greatly affects the accuracy and complexity of time spent [5].
K-Means clustering is widely used in a variety of model development and modification as in the case of image segmentation with subtractive clustering [3], adaptive K-Means [7] and optimizing K-Means for scalability [8]. Some of the above cases are generally used to improve the reliability of K-Means Algorithm. Basically the problem that often occurs when using K-Means algorithm is granting the initial centroid value which has a high sensitivity value for the final cluster result. The result of final cluster can be different if we use the different initial value for cluster centroid [9]. Another disadvantage of the K-Means is the number of clusters that tend to be determined personally so the clustering depends upon the selection of initial centroid which enables system to optimally group in local [10].
3535 IWOKM can be applied to determine the cluster center point in K-Means but requires a longer process to form the cluster [11]. It is similar in previous research conducted by M. Sakthi and Antony in 2011, using Principal Component Analysis (PCA) as a determinant of centroid initial value. PCA and K-Means have a high degree of accuracy and low complexity compared to K-Means [5]. If explored more deeply, the relationship between clustering method and dimension reduction methods like PCA has a very close relationship in Data Mining process with diverse data [12]. PCA is one of the variable reduction features widely used in multivariate statistics. The purpose of PCA is to reduce the variables without losing the information [13]. PCA has eigenvalue to look for the value of eigenvector matrix. It should be noted that the covariance matrix and eigenvector matrix are parts of PCA which can be used as an initial value for centroid of K-Means algorithm. Research conducted by Qin Xu stated that of the six algorithms which are applied to hybrid with K-Means, PCA is the best algorithm to search the initial centroid value [14].
Related to the use of eigenvector value, PCA will form a matrix of the same size or square, the resulting covariance value will replace the initial centroid value in K-Means. While cluster is formed based on the number of eigenvector matrix just like Fuzzy C Means (FCM). In FCM, clusters are formed as many as attributes used for clustering the data [15]. The term of validity is used to determine the best result of a clustering algorithm. To measure the validity of the algorithm, several studies related to K-Means mostly use Davis Bouldin Index (DBI) with parameter the smaller the value, the better the DBI [16], Silhouette Index (SI) with SI parameter value closer to 1 indicates the right to be in the cluster [17] and Dunn Index (DI) with greater DI parameter value indicates better value for clustering result [18].
This research will compare Means and PCA K-Means based on the validity of algorithm with simulation of diverse data and also with different attributes. The results of this research becomes a reference on how effective the PCA against K-Means in determining the initial value of centroid. If the used dataset has a large size, then the performance of K-Means will be reduced and the time complexity will be increased [5]. To overcome this problem, PCA as a dimension reduction model is used for centroid optimization in K-Means. The case studies which will be used as experiment is the data of registrant from diktis research by Ministry of Religious Affairs of Indonesian Republic which
consists of six attributes by the combination of 595 experimental data of females, 1,193 data of males and the overall data of 1,737. Besides that, experiment which is related to the used attributes consists of 4, 5 and 6 attributes. For comparison this study will use 100,000 data from a random data generator.
2. LITERATUR REVIEW
2.1. K-Means Clustering
Cluster analysis is the task of grouping data (objects) based solely on the information found in the data that describes these objects and the relationship between them [1]. Clustering is the process of making a group so that all members of each partition has a similarity based on certain matrix and a number of k in the data [19]. Data
objects located in one cluster must have similarities while those who are not in the same cluster have no resemblance. K-means algorithm consists of two separate phases, first is to calculate the k centroid
while the second requires the cluster point which has the nearest neighbor to the centroid of each data [3]. There are many ways that can be used to determine the distance from the nearest centroid, one of the most frequently used method is Euclidean Distance [20].
The purpose of clustering is to minimize the objective function that is set in the process of clustering, generally it tries to minimize the variation within a cluster and maximize the inter-cluster variation[21]. The distance between two points of x1 and x2 in manhattan / city block distance space is calculated by using the following formula [22]:
, ‖ ‖ (1)
As for the Euclidean distance space, the distance between two points is calculated by using the following formula [22]:
, ‖ ‖
∑
(2)
2.2. Principal Component Analysis (PCA)
3536 Karl Pearson in 1901 with the development of computer technology and advances in mathematics. The advantages of using PCA compared to other statistical methods are [12]:
1. Can be used for all data conditions/for research with many variables..
2. Can be used without reducing the original number of variables.
3. It has the phase of variable data standardization which consists of various units of value.
4. The information obtained is more dense and meaningful.
2.3. Validitas Cluster
This test is conducted to see if an algorithm produces a better clustering data compared to other clustering methods. The test is conducted as follows:
1. Davis-Bouldin Index
Davis-Bouldin Index (DBI) Matrix was
introduced by David L. Davis dan Donald W. Internal validity conducted is to show how well the cluster which has been done by calculating the quantity and derivative feature from the data set [16]. DBI value obtained by the equation of:
DBI=
∑
max
, Sy1 (3)2. Silhouette Index
If DBI is used to measure the validation of the entire cluster in a data set, Silhouette Index (SI) can be used to validate either a data, the single cluster (a cluster from a number of clusters) or even an entire cluster[17]. To get the Silhouette Index (SI) value of ith data is
by using the following equation:
bi =
, (4)
SI global value can be obtained by calculating the average SI values from all clusters in the following equoation:
bi =
∑
(5)3. Dunn Index
Dunn Index (DI) is used to calculate the validity of the cluster by using diameter of cluster (cohesion) and the distance between two clusters (separation) [18]. Dunn Index
(DI) can be obtained by using the following equation:
DI = ,∆ (6)
where k is the number of clusters, the greater
the DI value indicates the better clustering result [18].
3. RESEARCH METHODOLOGY
The data used in this study comes from a web database http://diktis.kemenag.go.id of registrant data which is related to diktis research in 2016. The dataset contains 1,786 data of registrant from all PTN and PTS under the Ministry of Religious Affairs. This research also uses random data generator to prove the algorithm for better result in cluster validity.
3537
Cluster (k) from all of eigen vector matrix
Eigenvector instead of the random index
Calculate Centroid Value
Allocate Each Data to
Nearby Centroid Changes in value and Cluster Determine the New Centroid Value
Finish Identification of Data
Transformation from Original Variable to Standard Variable
Calculate Covariance value
Calculate the Characteristic of Vextor (eigen vector and eigen value)
[image:4.612.94.514.69.376.2]Principal Component Start
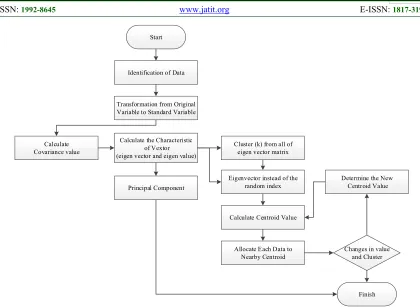
Figure 1: Ilustration of Research Methodology
Determining the number of clusters in the K-Means clustering is by using covariance matrix on PCA, this concept is similar to FCM. The clusters which will be formed are as many as existing attributes, it is raised from the amount of matrix covariance PCA. In this simulation, 6 clusters, 5 clusters and 4 clusters will be formed
4. RESULT AND ANALYSIS
4.1. Algorithm Simuation
The results of this research is a simulation of clustering using means algorithm and PCA K-Means. According to the original purpose on how to find the best algorithm for grouping data based on the result of cluster validity. 6 attributes used for grouping are Cluster Research (A1), Serial Number (A2), Type of Research (A3), Educational Level of Researcher (A4), Topic (A5) and Institution (A6).
[image:4.612.318.525.486.583.2]To perform the grouping we do some process of Knowledge Discovery in Databases (KDD) from the research data of diktis by using some phases such as cleaning, transformation and data mining. The preliminary data used after KDD process with six attributes is shown in the following Table 1:
Table 1: Data Transformation of Diktis Research 2016
Data A1 A2 A3 A4 A5 A6
1 20 176 2 2 2 1
2 3 21 1 2 2 1
3 20 172 2 1 1 1
4 9 160 2 1 1 1
5 19 36 2 2 1 1
… … … …
1.737 9 14 2 1 1 11
While the random data generator of 100,000 data can be shown in table 2 below:
Table 2: Random Data
Data A1 A2 A3 A4 A5 A6
1 0.7143 0.7056 0.9812 0.7812 0.0092 0.1198
2 0.1071 0.0806 0.7567 0.1101 0.5987 0.2093
3 0.7143 0.6895 0.1298 0.4901 0.8709 0.7690
4 0.3214 0.6411 0.3209 0.2362 0.6617 0.5159
5 0.6786 0.1411 0.8781 0.3078 0.9194 0.8177
… … … …
3538
4.2. The result of K-Means Clustering
Based on K-Means rules, to determine the initial point or centroid is by using random value generator by taking several points of data attributes with values as follows:
0.3697 0.2118 0.0000 0.1193 0.4460 0.3443 0.5147 0.2811 1.0000 0.1471 0.0000 0.1000 0.5155 0.1862 1.0000 0.1269 0.8358 0.7642 0.4863 0.2706 1.0000 0.1474 0.0000 0.8103 0.5031 0.2247 1.0000 0.0000 0.6828 0.1226 0.5628 0.1985 1.0000 0.6048 0.5968 0.1935
The random values generated by K-Means above become a problem when the results of the random are different. Therefore, one way to overcome the weakness above is by using PCA as initial centroid determinant models in K-Means. From the experiment, based on the normalization result, the greatest value is shown in cluster 4. This value cannot be used as a reference for anything in clustering process, but the value can be used as a minimum standard of clusters to be formed on the K-Means which is 4 clusters. In this experiment the number of iterations performed by the algorithm K-Means are 372 iterations. To determine the result of simulation validity the cluster is by using DBI, CI and SI values, which can be seen in Table 3 below:
Table 3: The comparison of the cluster validity of each attribute and clusters using K-Means
Number of Cluster
Attributes
DBI SI DI
4 5 6 4 5 6 4 5 6
6 1.9509 1.9398 2.0018 0.0332 0.1298 0.2123 0.5532 0.4380 0.3270
5 1.6849 1.5051 1.9961 0.5354 0.6711 0.6789 0.6164 0.6100 0.6262
4 1.7023 1.6704 1.9094 0.3130 0.4250 0.5301 0.3290 0.4933 0.3971
From Table 3 above we can see that K-Means is capable of generating the smallest DBI value of 1.5051 with the number of cluster is 5 and 5 attributes, SI value close to 1 is where the number of cluster is 5 with 6 attributes, while the highest value of DI is where the number of cluster is 5 with 6 attributes. From the above experiment it can be seen that the more attributes for grouping the better the result of cluster validity. Likewise in this experiment, the number of clusters 5 is the best value for validity.
4.3. The Result of PCA Algorithm
The process on PCA will be conducted by using multiple simulation attributes, such as 4, 5 and 6 attributes. The covariance value generated will follow how much the number of attributes which is used in PCA. The covariance value will also be used as a reference to determine the number of clusters and the initial value of centroid in K-Means. The absolute value of covariance formed by PCA is as follows:
1.0000 0.0863 0.2940 0.1323 0.0229 0.0366 0.0863 1.0000 0.0466 0.0535 0.0480 0.0006 0.2940 0.0466 1.0000 0.1137 0.0240 0.0643 0.1323 0.0535 0.1137 1.0000 0.0262 0.0302 0.0229 0.0480 0.0240 0.0262 1.0000 0.0385 0.0366 0.0006 0.0643 0.0302 0.0385 1.0000
The above covariance value as the centroid value is the best combination from PCA, so the value is absolute and can’t be changed like in the random value in K-Means. The resulting eigenvector of Principal Component are 1.388824, 1.102471, 0.998244, 0.952272, 0.881483 and 0.676706. Thus obtained the Eigenvalue Decomposition as follows:
0.6473 -0.0197 0.0447 -0.0519 -0.3379 -0.6795 -0.1194 0.5609 -0.6410 0.3864 0.1701 -0.2863 0.6187 0.2172 -0.1639 0.2020 -0.2291 0.6708 0.4037 -0.3519 -0.2487 -0.1327 0.7960 -0.0073 -0.0479 -0.5647 0.0059 0.8178 -0.0876 -0.0477 0.1368 0.4416 0.7060 0.3475 0.4038 -0.0634
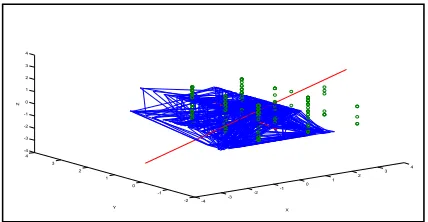
[image:5.612.313.527.581.692.2]Plotting Principal Component generated from PCA is shown in the following Figure 4.6:
Figure 2. Plotting Principal Component
-4 -3
-2 -1
0 1
2 3
4
-2 -1 0 1 2 3 4 -4 -3 -2 -1 0 1 2 3 4
X Y
3539
4.4. The result of PCA K-Means Clustering
[image:6.612.94.504.162.263.2]The result of grouping in first iteration of K-Means uses the value of PCA eigenvector centroid is shown in table 4 below:
Table 4. Grouping of 1st iteration PCA K-Means with 6 attributes
No C1 C2 C3 C4 C5 C6 Cluster value Min SSE
1 1.1524 1.3393 0.9955 1.4230 1.5294 1.8071 3 0.9955 0.9910
2 1.1171 1.1187 1.1900 0.6998 0.6962 1.2039 5 0.6962 0.4847
3 0.9815 1.1853 0.7795 1.5907 1.6865 1.6769 3 0.7795 0.6077
4 1.1341 1.0480 0.6098 1.4725 1.5478 1.5393 3 0.6098 0.3719
5 0.8613 1.4830 0.5575 1.1590 1.6178 1.5905 3 0.5575 0.3108
… … … .. … … … …
1.737 1.3807 1.6930 0.9433 1.6621 1.7225 0.9807 3 0.9433 0.8898
In the first iteration, the total values of Sum Square Error (SSE) obtained is: 583.5678 with average SSE 1.0727, the last iteration formed by PCA K-Means is 214 faster than K-Means. Based on
[image:6.612.94.517.343.413.2]the experiment result using eigenvector matrix as the value of K-Means centroid with some simulations, the cluster validity is obtained as follows:
Table 5. The comparison of cluster validity of each attribute and the cluster using PCA K-Means
Jumlah Cluster
Atribut
DBI SI DI
4 5 6 4 5 6 4 5 6
6 1.8229 1.7933 2.0003 0.2023 0.1322 0.2123 0.6712 0.5552 0.6235
5 1.6740 1.6321 1.8770 0.6169 0.6846 0.6801 0.7721 0.7705 0.7290
4 1.7121 1.6019 1.8195 0.3277 0.5258 0.5478 0.3406 0.5052 0.5158
In this experiment, the lowest DBI value of 1.6019 is obtained in 5 attributes and 4 clusters, SI value of 0.6846 or closer to 1 is in 5 clusters and 5 attributes while the best DI value of 0.7721 is in 4 attributes and 5 clusters. This test did not significantly affect how much the attributes and the number of clusters. However it can be inferred that PCA K-Means can produce the best IDB value with fewer number of clusters, and DI value with fewer attributes can also be applied to the PCA K-Means Algorithm.
4.5. Analysis of Random Data Generator
The experiment using 100,000 data is done by generating random data. As in the experiments using diktis research data, the simulation experiments conducted with a combination of attributes and cluster, PCA K-Means is also the best algorithm in this simulation. From the experiments conducted there are some things that can be stated in this study such as (1) the use of random data does not affect the result of generated cluster validity, (2) no specific pattern resulting from cluster attribute, (3) The result of trend cluster does not have a distinct tendency or different from the previous data experiment. Visualization validity of PCA K-Means cluster can
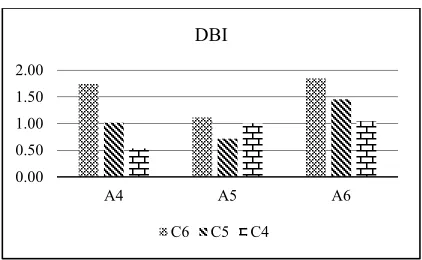
be shown in figure 3 (DBI), Figure 4 (SI) and Figure 5 (DI) below:
Figure 3. DBI values of PCA K-Means with 100,000 Data
0.00 0.50 1.00 1.50 2.00
A4 A5 A6
DBI
[image:6.612.312.523.450.580.2]3540
Figure 4. SI value of PCA K-Means with 100.000 data
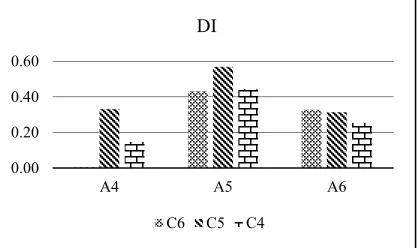
Figure 5. DI value of PCA K-Means with 100.000 data
From the three charts above it can be seen that the IRA has a similar pattern with the experiment using the smaller data of Diktis Research Ministry of Religious, while for SI and DI the pattern is always changing, but not too significant. Therefore, as the reference for PCA K-Means reliability compared with the K-Means is on the DBI value of cluster validity.
The main reference of this study was a research by Sakthi and Antony about Initial Centroids on K-Means Clustering using PCA. However, in the study to determine the initial centroid in K-Means, PCA kernel was used, the results of this research stated that K-Means PCA has an accuracy of 90.95%, higher than K-Means which has only 81.25% accuracy. Similarly, related to the time complexity using K-Means, PCA has a smaller complexity of 0.19 seconds compared to K-Means of 0.31 seconds [5]. The advantage of the research done by Sakthi and Antony is that in addition of calculating the accuracy they also calculate the value of complexity, but the study did not measure the cluster validity and did not experiment in several datasets, attributes or number of clusters. Therefore, in this study determining the initial value of centroid was done using eigenvector of PCA which has the same concept with kernel on PCA. The result in both kernel and eigen vector, PCA is able to improve the
accuracy and validity of the cluster on K-Means algorithm.
According to the results obtained from several experiments, this study has several disadvantage, such as the number of clusters formed were influenced by the number of attributes, because attriibute is a form of eigenvector value in PCA. If in K-Means the number of clusters can be formed as many as desired (number of clusters < number of data) then in PCA K-Means they can only form a maximum number of clusters as many as the number of attributes. To be able to form a large number of clusters it requires a lot of attributes, just like in FCM.
5. CONCLUSION
From the results and analysis conducted and according to the objectives of this research, it can be concluded that between Means and PCA K-Means the comparison of the best cluster validity value is PCA K-Means, all the experiments conducted is by applying 4, 5 and 6 clusters and attributes, PCA K-Means has the advantage on every experiment. In the case of using generated data random of 100,000 data, the result of DBI value is 0.5343 with SI value is 0.6264 and DI value is 0.5689. So it can be inferred that the more datasets used, then PCA K-Means is capable on lowering the value of DBI. However, regarding to SI and DI values, they do not have a specific pattern on the experimental result for both data small and large, no matter how much clusters and attributes is used. Therefore, PCA K-Means is an optimal algorithm for above cases, if the validity of the cluster used is DBI. However, eigen vector PCA affects the formation of clusters in K-Means, so PCA K-Means can only form clusters as many as attributes used in the clustering process, just like FCM.
ACKNOWLEDGEMENT
A biggest thanks to Faculty of Science and Technology UIN Sultan Syarif Kasim Riau on the financial support for this research, the facilities and mental support from the leaders. And also thanks to Puzzle Reseach Data Technology (Predatech) Team Faculty of Science and Technology UIN Sultan Syarif Kasim Riau for their feedbacks, corrections and their assistance in implementing these activities so that research can be done well.
0.00 0.20 0.40 0.60 0.80
A4 A5 A6
SI
C6 C5 C4
0.00 0.20 0.40 0.60
A4 A5 A6
DI
[image:7.612.91.300.249.373.2]3541 REFRENCES:
[1]. Rao, S.G. 2015. “Performance Validation of the Modified KMeans Clustering Algorithm Clusters Data”. International Journal of Scientific & Engineering Research. 6(10). pp. 726-730.
[2]. Baarsch, J. and Celebi, M.E. 2012. “Investigation of Internal Validity Measures for K-Means Clustering”. Proceedings of the International Multi Conference of Engineers and Computer Scientiss 2012. 1 March. pp. 14-16.
[3]. Dhanachandra, N., Manglem, K., and Chanu, Y.J. 2015. “Image Segmentation using K-means Clustering Algorithm and Subtractive Clustering Algorithm”. Eleventh International Multi-Conference on Information Processing-2015 (IMCIP-Processing-2015). pp.764 – 771
[4]. Patel, V.R., and Rupa, G.M. 2011. “Impact of Outlier Removal and Normalization Approach in Modified K-Means Clustering Algorithm”. IJCSI International Journal of Computer Science Issues. 8(5). pp. 111-121.
[5]. Sakthi, M, and Thanamani, A.S. 2011. “An Effective Determination of Initial Centroids in K-Means Clustering Using Kernel PCA”. International Journal of Computer Science and Information Technologies (IJCSIT). 2(3). pp. 955-959.
[6]. Napoleon, D., and Pavalakod, S. 2011. “A New Method for Dimensionality Reduction using K-Means Clustering Algorithm for High Dimensional Data Set”. International Journal of Computer Applications. 13(7). pp. 41-46. [7]. Jambhulkar, S.M., Borkar, N.M., and Sorte, S.
2011. “Comparison Of K-means and Adaptive K-means With VHDL Implementation”. International Journal of Engineering Science and Technology (IJEST). pp.22-27.
[8]. Agrawal, A., and Sharma, S. 2015. “Optimizing K-Means for Scalability”. International Journal of Computer Applications. 120(17). pp. 20-24.
[9]. Dash, R., Mishra, D., Rath, A.K., and Acharya, M. 2010. “A hybridized K-means clustering approach for high dimensional dataset”. International Journal of Engineering. Science and Technology. 2(2). pp. 59-66.
[10].Sethi, C., Mishra, G. 2013. “A Linear PCA based hybrid K-Means PSO algorithm for clustering large dataset”. International Journal of Scientific & Engineering Research. 4(6). pp. 1559-1565.
[11].Pratama, I.P.A. 2015. “Penerapan Algoritma Invasive Weed Optimnization Untuk Penentuan Titik Pusat Klaster Pada K-Means”. International Journal Computer Science (IJCCS). 9(1). pp. 121-129.
[12].Ding, C., and He, X. 2004. “K-means Clustering via Principal Component Analysis”. Appearing in Proceedings of the 21 st International Conference on Machine Learning. Banff. Canada.
[13].Vijay, K., and Selvakumar, K. 2015. “Brain FMRI Clustering Using Interaction K-MeansAlgorithm with PCA”. International Conference on Communication and Signal Processing (ICCSP). 4(1). pp. 909-913. [14].Xu, Q., Ding, C., Liu, J., and Luo, B. 2015.
“PCA-guided search for K-means”. Pattern
Recognition Letters 54. pp.50–55.
[15].Afrin, F., Al-Amin, M., Tabassum, M. 2015. “Comparative Performance Of Using PCA With KMeans And Fuzzy C Means Clustering For Customer Segmentation”. International Journal of Scientific and Technology Research. 4(10). pp. 70-74.
[16].Bhatia, S.K., Dixit, V.S. 2012. “A Propound Method for the Improvement of Cluster Quality”. International Journal of Computer Science Issues (IJCSI). 9(4). pp. 216-222. [17].Rendón, E.. Abundez, I., Arizmendi, A., and
Quiroz, E.M. 2011. “Internal versus External cluster validation indexes”. International Journal of Computers and Communications. 1(5). pp. 27-34.
[18].Sharma, S., Gupta, P., Parnami, P. 2015. “An Approach for Parallel K-means based on Dunn’s Index”. International Journal of Advanced Research in Computer Science and Software Engineering (IJARCSSE). 5(5). pp. 1665-1668.
[19].Khan, S.S., and Ahmad, A. 2004. “Cluster Centre Initialization Algorithm for K-means Cluster”. International Conferences In Pattern Recognition Letters. pp. 1293–1302.
3542 [22].Celebi and Emre, M. 2012. “Deterministic
Initialization of The K-Means Algorithm Using Hierarchical Clustering”. International Journal of Pattern Recognition and Artifcial Intelligence. 26(7). pp. 55-61.
[23].Patel, V.R., and Mehta, R.G. 2011. “Impact of Outlier Removal and Normalization Approach in Modified K-Means Clustering Algorithm”. International Journal of Computer Science Issues (IJCSI). 8(5).
[24].Jain, Y.K., and Bhandare, S.K. 2011. “Min Max Normalization Based Data Perturbation Method for Privacy Protection”. International Journal of Computer and Communication Technology. 2(8).