7124
A PREDICTIVE MODEL FOR STUDENT OUTCOMES
USING SPARSE CODING – HYBRID FEATURES SELECTION
1 MARYAM ZAFFAR, 2 MANZOOR AHMED HASHMANI, 2 K.S. SAVITA,3ABDUL QAYYUM
1,2
Department of Computer and Information Sciences
3
Department of Electrical and Electronic Engineering
Universiti Teknologi PETRONAS, 32610 Bandar Seri Iskandar, Tronoh, Perak, Malaysia.
Email : *[email protected], [email protected], [email protected], [email protected]
ABSTRACT
Educational data mining is a new research area and is used to predict student performance and provides insight that allows educators to plan accordingly. Its results now play an important role in improving educational standards. Specific algorithms for ‘Features Selection’ optimize the classification accuracy of a prediction model. This work introduces a new method based on sparse representation for features selection and reduction that assesses predictive model's accuracy, precision and recall. Different existing features selection methods are fused and passed to a classifier to measure performance using educational datasets. Experimental results are compared to existent features selection techniques and demonstrate that the proposed approach provides superior solution for data fusion and individual (single) predictive outcomes
Keywords: Educational Data Mining, Feature Selection, Feature, Feature Reduction, Classification, Predictive Model.
1. INTRODUCTION
Data mining (DM) is a powerful tool that discovers useful information from diverse fields stored in large data banks with diverse formats. Several data mining algorithms extract useful patterns from raw data to reveal significant information that assists decision-making processes. Educational Data Mining's (EDM)quick growth owes to various techniques with outcomes that favorably affect decision-making[1, 2].
EDM's unique educational data exploration transforms raw data into useful information in support of student and institutional planning[3]. Major stake holders include students, educators, institutions, government and the corporate business community[2].Students are a precious national resource and quality academic performance is crucial for their future contributions to progress and development [4]. EDM identifies factors that critically affect the quality of academic performance, which, in turn, assists early decision-making and planning for educators; thus effecting a win-win situation for all stake holders[5, 6].
Five current EDM approaches are relationship mining, clustering, text mining, social network Analysis (SNA),regression and prediction [7-10]. EDM 'Prediction' concerns the development of models that deduce independent (single) predictive variables from different numbers of predicator variables. Predictive model types include classification, regression and density estimation[6, 11] with a view to evaluate the unidentified value of a variable that describes student performance, knowledge level and outcomes in terms of grades (score or marks) [2]. Thus, EDM extracts useful information from large educational data repositories that is then used to predict student performance[2]to help educators improve learning outcomes and teaching processes [12].Numerous studies under the umbrella of 'student performance predictions' include student dropout rates [13], grades [14], GPA[15], employability [9] and potential.
7125 fits several EDM capabilities [15] whereby educational organizations predict the future productivity of enrolled students based on prior and current student data banks. 'Learning' and 'Testing' are major steps in computerized EDM classification in which a set of 'training data' is analysed to aid the development of a model containing predetermined set(s) of classifiers. Testing different data sets determines a model's accuracy.
Classification allows the prediction of an attribute's value relative to the value of other attributes[17]. Numerous classification algorithms are used. These include Naïve Bayes[14]; Decision Tree[14, 17, 18]; Neural Network(NN); Support Vector Machine(SVM)[9, 19, 20];Multilayer Perception[7];Random Forest(RF)[18, 21]; Begging[8]; Boosting[8] and Extreme Learning Machine(ELM)[22], etc. Decision Tree' is most frequently used and highly recommended as the most suitable method in educational contexts because of 'If–Then' classification rules that benefit direct decision-making[17]. Nevertheless, it is sensitive to over fitting and furthermore it is limiting because within a domain all data points are classified within one class. Consequently, inconsistent resultsare interpreted as errors. For example, student course performance data can produce such discrepancies. Overcoming Decision Tree problems requires the averaging of decision tree outcomes by using a method called 'ensembling'. The Random Forest algorithm is such an ensemble.
SVM is a supervised learning approach to successful data mining that trains data for pattern recognition and predictions[23]. SVM accuracy does not depend on data dimensionality but is limited to using neural networks that require continuous numerical or quantized data.
Features Selection techniques improve a prediction model's accuracy[22]by selecting relevant features that reduce computational complexity for a data set[24]. Features Selection thus removes noisy and redundant data to reduce dimensionality[25]. Filter and Wrapper techniques are major features selection methods. Statistical measures lie within the core of filtering and are frequently applied to high dimensional data for speedy calculation. Main steps involve features' subset generation, measurement, and testing by learning algorithms[26]. Irrelevant attributes are filtered(removed)by using features evaluation functions for subset classification performance. Nonetheless, filter methods are not developed for certain classifiers and results are not always satisfactory. The Wrapper model measures the integrity of selected feature subsets using a
machine learning algorithm, but has increased computational costs[24].
To superfluous improve classification accuracy through content recognition, sparse coding (SC) has been applied to local image feature representation [27]. SC modeling has been successfully used for imaging and videos to denoise, in paint and demosaicize [28-30]. SC is an effective features selection tool that solves conventional problems based on image noise reduction, segmentation, super-resolution processing and restoration, and performs well in numerous pattern recognition problems based on signal and image processing applications [31]. Image categorization is also obtained by SC image patches [32]. Yang et al.[33]proposed an image classification algorithm SC Spatial-Pyramid-Matching (SCSPM), that formed sparse vectors based on the SIFT descriptor. SCSPM is also used by them to generate a visual vocabulary using SVM and SPM algorithms to represent an image for classification purposes. Wang proposed a multi-label SC algorithm for integrated features extraction, which can automatically afford image annotations. Gao et al. [34] proposed an extension of SCSPM algorithm, that is Laplacian SCSPM algorithm to discriminate associations between local features.
The existing algorithms although increase the classification accuracy, but they are limited on two main points: (a) how to use SC to provide sparse vectors; and (b) how to generate an efficient visual vocabulary that adequately expresses global image representations for purposes of image classification. Responding to these limitations, the authors propose an innovative SC algorithm that uses pre-specified dictionaries for image classification. Sparse Coding bargains the following practical advantages: (a) a large storage capacity for coded signals; (b) memory associative capacity; (c) calculation affluence; (d) easily structured natural signals; (e) minimum energy utilization as a general economic principle incorporated by biologic evolution; (f) meets requirements to accomplish electrophysiological experiments [35].
7126 of Visual Words’ application of one or several ‘nearest’ visual vocab selections.
The foremost disadvantage of SC is in what way to design a dictionary that competently captures singular points within a well-defined structure, for which an effective dictionary design provides a feasible solution. According to recent literature, after successful features extraction with a combination of SC and local visual features, different classification algorithms have been used to classify objects for aerial imagery. Researchers have applied SVM, Extreme Machine Learning (ELM) and Artificial Neural Network (ANN) machine learning algorithms to classify aerial images. Artificial neural network (ANN) methods deliver a feasibly direct solution for multi-category classification problems[36]. ANN directly utilizes one network to map input belonging to various classes and produces a continuum of variables instead of discrete class labels. Nevertheless, conventional neural networks provide lower classification accuracy compared to SVM [37]. ANN models are usually implemented with gradient-based learning methods that have extended training periods and are thus susceptible to local minima[38]. To minimize such limitations, ELM was introduced with many successful applications in signal and image processing. According to literature reports, ELM improves the capability to generalize and/or classify compared to binary-classifier and regression-based algorithms. ELM also grants higher generalization performance for multiclass classification problems and provides a quicker learning rate with better scalability. In addition, its ease of implementation obtains robust solutions for multiclassclassification problems.
2. RELATED WORK 2.2 Features Selection for EDM
One study proposed a hybrid classification model to predict factors describing detrimental behavioral characteristics of vocational students using a dataset for 1,081 students with 19 attributions from a private vocational institute in Thailand[39]. They used a genetic search method for attribute selection. Attributes were assessed by correlation-based features selection, consistency-based features selection, and wrapper subset evaluation. The authors applied simple classifiers to the same dataset for all comparisons. C4.5 and CFS evaluators provided superior results compared to Naïve Bayes, the Bayesian Belief Network and RIPPER algorithms. Results showed that classifiers yield higher accuracy rates when using feature selection techniques. Another study by Malviya analyzed rural
and urban student data to investigate suitable course selections according to student category[40]. The study proposed a Genetic–SVM fusion to optimize results for the educational organization's goal of improving quality
3. METHODOLOGY: 3.1 Dataset:
Because many educational systems presently use offline instruction, further research in offline education is needed. We utilized the UCI repository's dataset to check the performance of students taking offline courses. Data regarding grades, demographics, socioeconomic conditions, personal characteristics and school related features, all highly impact student performance .P. Cortez and A. Silva compiled the UCI data set specifically for students taking offline courses in Mathematics(mat) and the Portuguese language(por)[1]. The UCI dataset marshals 33 attributes and 649 instances. These attributes include: Sex, Age, School, Home Address, Pstatus(parent’s cohabitation status),Medu(mother’s education), Mjob(mother’s job), Fedu (father's education),Fjob(father’s job), Guardian(student’s guardian), Famsize(family size),famrel(quality of family relationship), reason(reason for choosing this school), traveltime(home to school travel time), studytime, failures (# of past class failures), schoolsup (extra educational school support), famsup (family educational support), activities (extra-curricular activities), paid class (extra paid classes), Internet (internet access at home), nursery (attended nursery school ?), Higher(desire for higher education), romantic(in romantic relationship ?), freetime (free time after school), gout (going out with friends), Walc (weekend alcohol consumption),Dalc (workday alcohol consumption), health (current health status), absences(# of school absences), G1 (first period grade), G2 (second period grade), and G3 (final grade).
2.3 Features Selection/Reduction Techniques
7127 on the basis of occurrence, after which a classification algorithm was applied to select attributes to determine features that highly influenced student dropout rates. Figuiera performed a principal component analysis on a dataset of 332 students enrolled in a BS computer science program[42]. He combined PCA with Decision Tree (DT)-extracted relevant features to predict grades. Rodriguez employed an RTF ensemble based on DT and PCA[43]. Here, attribute set 'F' was divided into 'K' subsets. To obtain a training set, PCA was applied to each set independently by using K-axis rotation of a subset. The DT was used as the base classifier for the rotation tree.
3.2 Proposed Approach
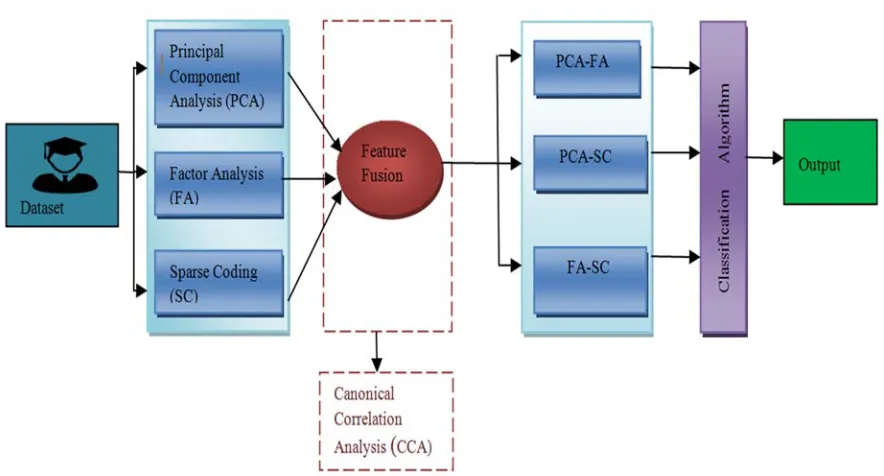
After data acquisition, PCA and FA features selection/reduction techniques were applied to select appropriate features from the dataset using sparse coding. These techniques were fused using CCA (Canonical Correlation Analysis) and DCA (Discriminative Correlation Analysis. The CCA approach provided superior features fusion fort he proposed method. After features fusion, SVM, RF and ELM supported classifiers were used to mine the data set. Classifier limitations were explained above and details for each step are provided in following sections.
[image:4.612.92.534.302.540.2]
Figure 1: Proposed Framework for features selection and classification of the UCI data set.
Sparse representation is widely used for machine learning, signal processing, neuroscience and numerous applicationsin signal and image processing fields[44]. Sparse modeling represents signals as linear combinations of typical patterns called atoms that are extracted from a dictionary. For a given image or signal,𝑦 ∈ 𝑅 , and a dictionary matrix,𝐷 ∈ 𝑅 , containing K atoms as column vectors, 𝑑 ∈ 𝑅 , j=1, ….K), the sparsest vector is determined in such a way that 𝑥 ∈ 𝑅 and𝑦 ≅ 𝐷𝑥 .The problem is optimally solved by Eq.(1):
𝑚𝑖𝑛‖𝑥‖ subject to 𝑚𝑖𝑛‖𝑦 𝐷𝑥‖ ∈ (1) where∈= reconstruction error of signal 𝑦 using
dictionary 𝐷 and the sparse code 𝑥.
Alternatively, one can use Eq. (2):
𝑚𝑖𝑛‖𝑦 𝐷𝑥‖ subject to ‖𝑥‖ 𝜌 (2) where𝜌= specified sparsity level.
The vector 𝑥 ∈ 𝑅 represents coefficients for signal y with respect to dictionary 𝐷. Compared to PCA and other methods, SC computes vectors with the least number of nonzero coefficients. The sparse-coefficient formulation usually employs the
7128
Table 1. Orthogonal Matching Pursuit (OMP) Algorithm
Algorithm. Orthogonal Matching Pursuit.
Task: Approximate constraint problem:
𝛼 𝑎𝑟𝑔𝑚𝚤𝑛 ‖𝛼 ‖ s.t 𝐵 D𝛼
Input: Input sample 𝐵 , Dictionary matrix 𝐷, sparse coefficients vector,𝛼 .
Initialization: 𝑡 1,𝑟 𝐵 , 𝛼 0, 𝐷 𝐷, index set ⋀ ∅. Where ∅ denotes empty set;𝜏 is small constant;𝑑are dictionary elements stacked as column vectors.
While‖𝑟 ‖ 𝜏do
Step 1: Find the best matching sample:creates inner product between 𝑟 and 𝑑(𝑗 ∉ ⋀ ), by exploiting
𝜆 𝑎𝑟𝑔𝑚𝑎𝑥∉⋀ 〈𝑟 , 𝑑 〉.
Step 2:Update index set,⋀ ⋀ ∪ 𝜆 , and reconstruct data set
𝐷 𝐷 , 𝑑 .
Step 3: Compute sparse coefficients by using least square algorithm
𝛼 𝑎𝑟𝑔𝑚𝚤𝑛‖𝐵 𝐷 𝛼 ‖
Step 4: Update the representation residual using 𝑟 𝐵 𝐷 𝛼
Step 5: 𝑡 𝑡 1
End
[image:5.612.139.532.369.670.2]Output: 𝐷
7129 nonzero entries of a given vector. As an NP hard problem [45], the formulation is solved by using optimization greedy algorithms such as Matching Pursuit (MP) [45] or Orthogonal Matching Pursuit (OMP)[46]. A second class of algorithms is based on relaxation, an approach that replaces the 𝑙 -norm with an 𝑙 -norm, which converts the optimization problem to a convex form that is more efficiently solved. Such methods are called Basis Pursuit (BP)[47].
The overall goal is to efficiently obtain the sparsest coefficient by using dictionary elements. The most important step, therefore, is dictionary construction after selecting terms that provide optimal solutions for sparse coefficients. Predetermined dictionaries already provide quick solutions for sparse representation in image classification systems. These dictionaries have bases functions utilizing discrete cosine (DCT), discrete wavelet (DWT), discrete ridgelet (DRT) and discrete tschebchief transforms (DTT). All provide attractive learning dictionaries derived from given sets of training data.
Figure 5 presents the construction of sparse coefficients based on different fixed dictionaries. A Matching Pursuit (MP) algorithm selects best matching atoms from an over-complete dictionary to construct sparse approximation during each iteration. This approach computes a signal representation residual that selects the best matching atom until' stop' criterion for the iteration is satisfied. Greedier algorithms such as OMP have been proposed as an improvement on MP. OMP employs a process of orthogonalization for each iteration that generates orthogonal projections to determine their direction. It has been verified that OMP can converge limited iterations. Thus, OMP is an excellent choice that employs a greedy strategy to approximate solutions for sparse representation with lo-norm minimization. The authors utilized OPM optimization to compute sparse representation (See:
Table 1).
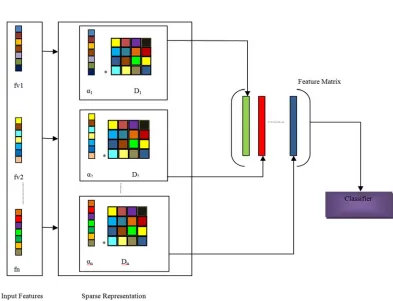
After feature fusion, fused features are fed into the OPM for the determination of sparse coefficients. The concatenation of sparse coefficients provides a features matrix that is commonly used in classifier algorithms to characterize EDM. Figure 2 outlines features extraction with sparse representation based on our proposed dictionaries.
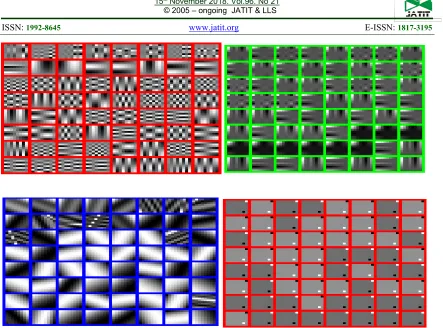
We used fixed dictionaries because they are extremely fast and reliable (accurate). Pre-defined dictionaries derive from discrete cosine-, wavelet-,ridgelet- and Tcehbichef transform basis functions. Discrete wavelet basis dictionary elements (atoms) mostly capture singular image points (Figure 3a). These values are then scattered over different rows
and columns compared to the initial dictionary. The dictionary stores image points in well-ordered forms that capture structural patterns. Moreover, they perform well with smooth and regular patterns. The DCT-based dictionary captures multiple irregular patterns concurrently (Figure 3b). Our DRT dictionary demonstrated good capturing structure compared to other fixed dictionaries such as DCT, DWT, and DTT. It also provided excellent storage of image structures with regular patterns for all dictionary elements (Figure 3c). The DTT dictionary has the same cell pattern structure and also captures good edge points for regular forms (Figure 3d). The patch size used for all dictionaries was 8×8, which is optimal for the capture of well-structured image patterns. NB: when dictionary size increases, computational complexity also increases[44].
3.2.3 Feature Fusion Methods
For EDM, the integration of data is a major issue when developing predictive models because diverse student data from different perspectives is utilized. To predict student performance, redundant data is removed through features selection. However, simultaneous attention is given to the interdependency of data sets. Hence, a prime concern of features fusion is the generation and selection of a single set of features for a set of objects to which several feature sets are connected. Moreover, the purpose of features fusion is to acquire representations that permit enhanced analysis[48]. A fused-features vector size can be changed by using different features selection techniques and also by increasing the performance of the prediction model[49].Current fusion methods are based on CCA (Canonical Correlation Analysis) and DCA (Discriminative Correlation Analysis). The CCA algorithm developed by H.Hotelling performed well for a multivariate analysis field and features fusion[50]. Its statistical method analyzes the relevance of two groups of variables and has been applied to different educational data sets[51, 52].CCA fusion also reduces data dimensionality while maintaining the integrity of original features as much as possible[53].
3.2.4 Machine Learning Approach
i. Random Forest Algorithm
7130
Figure 3: Basis functions used: a: DCT; b: DWT; c: RT; d: KSVD, using 8x8 image patch.
classifiers[54]. In 2015,Feng[55] proposed RF based on ensemble learning. It required less number of parameters compared to other machine learning classifiers such as SVM and ANN. RF is based on an ensemble of highly independent individual classifiers and utilizes a regression tree (CART). It is defined as follows:
𝑔 𝑢, 𝜃 , 𝑡 1,2, … … . , 𝑗, … . (3) Where 𝑔= RF classifier;𝑢= input feature vector; and 𝜃 = predictor variable, used as an independently identically distributed (i.i.d.) random process producing each CART tree. The RF algorithm's final responsivities to calculate outputs for all decision trees. Thus, there is less concern forever-fitting due to individual decision trees in RF. Because of its abundant advantages, RF has immense potential for the classification of UAV images in the field of remote sensing.
ii. Extreme Learning Machine (ELM)
The extreme learning machine (ELM) is a new learning algorithm that uses single-hidden-layer, feed-forward neural networks (SLFN) [56]. It is extremely time consuming to adjust input weights and hidden layer bases for feed-forward neural networks. To minimize and overcome these problems, Huang et al. proposed an SLFN using
traditional gradient-based learning algorithms by randomly choosing input weights and hidden layer biases for an infinite activation function within the hidden layer[56]. The SLFN is thus considered a linear system that determines and updates output weights analytically. Huang further established deep details for ELM based on inputting𝑁 data samples 𝑥 , 𝑡 where 𝑥
𝑥 , 𝑥 , … … . , 𝑥 is the 𝑗𝑡ℎ sample withn dimensional features; and where 𝑡
𝑡 , 𝑡 , … … . , 𝑡 characterizes actual labels for𝑥 standard SLFN, with number 𝑀 hidden neurons defined as follows:
Where𝑤 𝑤 , 𝑤 , … … . , 𝑤 is the weight vector with an𝑖𝑡ℎ hidden neuron connection to input nodes;𝛽 𝛽 , 𝛽 , … … . , 𝛽 represents the weight vector with connections to the𝑖𝑡ℎ
hidden neuron and output nodes; and 𝑐 is the threshold of the 𝑖𝑡ℎ hidden neuron;𝛼
𝛼 , 𝛼 , … … . , 𝛼 is the 𝑗𝑡ℎ output neuron;ℎ . represents the activation function; Thus, SLFN uses M hidden neurons and activation function ℎ . to approach 𝑁 training
7131 samples with zero error.Tekin applied the ELM algorithm to educational data and developed a prediction model for student GPA outcomes[22].
4. SIMULATION RESULTS AND DISCUSSION
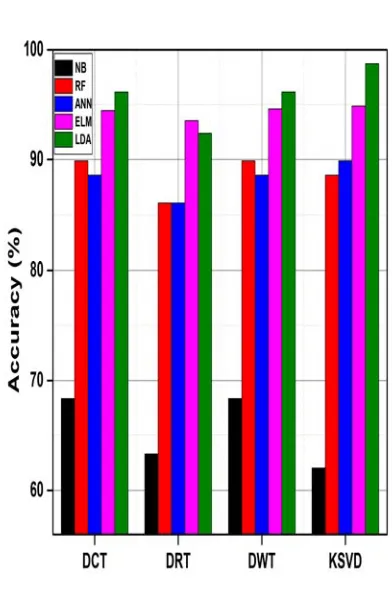
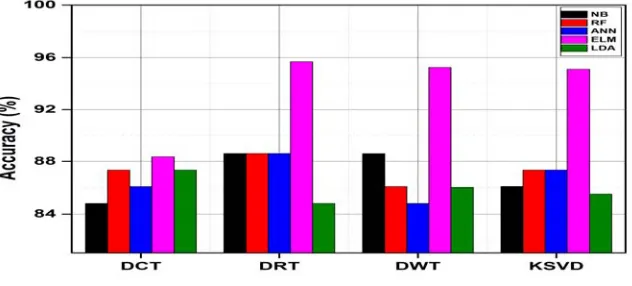
We developed a predictive model based on features extraction and classification algorithms using the EDM dataset. Various features selection/reduction techniques were compared for use with the proposed SC method, along with different classifiers. Extracted features based on SC were selected according the dimension of elements in proposed dictionaries. Pre-specified dictionaries (DCT, DWT and DRT) and an adaptive dictionary based on the KSVD algorithm were used for the extraction of prominent features from a' features pool'. Based on over-complete dictionary dimensions, thirty (30) prominent features were selected and applied to classifiers. The ratio of training to testing data samples was 80:20 for all classifiers (SVM, RF, and ELM). Moreover, for SVM we used a linear kernel with twenty (20) nodes to optimize the classifier. Various classifiers were employed based on different dictionaries using different features extraction techniques. We computed and compared accuracy rates for single features extraction (SC, PCA, and FA) and fused features extraction (SC–FA), SC–PCA, and FA–PCA). Fused features extraction provided higher accuracy rates. The classification accuracy of single feature extraction techniques using directories are shown through Figure 4, 5 and 6.The color scheme used to present the accuracy for five classifiers is described as follows Black represents(Naïve Bayes) NB classifier, Red represents(Random Forest) RF classifier, and Blue represents (Artificial Neural Network) ANN classifier, Pink shows (Extreme Machine Learning)ELM classifier, whereas Green shows the (Liner Discriminative Analysis) LDA classifier accuracy. Figure 4 shows FA-based features extraction accuracy rates based on various dictionaries, the results shows in Figure 4 that the length of green and pink bars are comparatively high than other bars, so that LDA and ELM classifiers shows better results with FA feature extraction technique. Similarly, Figure 5
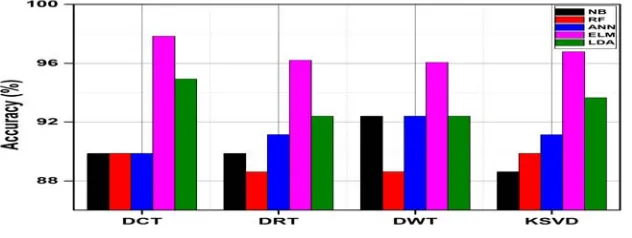
[image:8.612.341.537.108.406.2]shows PCA single features extraction accuracy, the results shows that the performance of LDA and ELM is better than other classifiers, however NB also shows better results with PCA feature extraction technique. Figure 6 shows rates for SC single features extraction technique.
Figure 4: Classification accuracy for FA-based feature technique using various dictionaries.
Figure 6 show that classification accuracy of SC-based feature extraction shows better results in DCT, DRT, DWT directories than DCT directory, however performance of ELM classifier is better than other classifiers for SC-based feature extraction using various dictionaries.
7132
[image:9.612.127.443.317.460.2]Figure 5: Classification accuracy for PCA-based feature technique using various dictionaries.
[image:9.612.127.442.515.638.2]Figure 6: Classification accuracy for SC-based features extraction using various dictionaries.
7133
[image:10.612.119.444.70.241.2][image:10.612.125.441.309.428.2]
Figure 8: Classification accuracy rates for SC-FA fused features extraction using different dictionaries.
Figure 9: Classification accuracy rates for PCA-FA fused features using different dictionaries.
At the end it is concluded that ELM and LDA show better performance than other classifiers while using with single feature extraction techniques and fused feature extraction techniques. However the results of PCA-FA fused feature extraction technique shows better results with LDA and ELM using different dictionaries having accuracy ranging from 92 to 98 percentage
i. ROC Curves
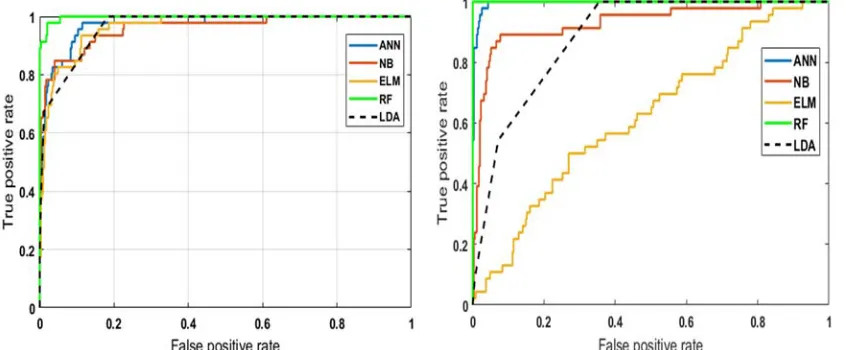
The receiver operating characteristic curve (ROC) is a fundamental tool used for test evaluation. It plots statistical results to illustrate the diagnostic ability of a binary classifier system even as its discrimination threshold is varied. A true positive rate (precision/sensitivity) is plotted as a function of the false positive rate (100-specificity) for different cut-off points of a given parameter. For purposes of machine learning, the true-positive rate is also known as 'recall' or 'probability of detection'. The false-positive rate is also known as
7134 method, as the green curve in the Figure 10. I sat highest position, which shows that performance of Random forest is better than other classifiers.
[image:11.612.92.515.152.327.2] [image:11.612.92.446.378.539.2]Figure 11 show performance curves of proposed features extraction technique for PCA feature extraction methods.
Figure 10: ROC curve based on FA feature extraction. Figure 11: ROC curve based on PCA feature extraction
Figure 12: ROC curves for different classifiers using SC features extraction
Figure 12shows that the RF classifier obtained the most accurate precision recall values followed by ANN and Naive Bayes, respectively, with the LDA classifier, using proposed SC features extraction, yielding the lowest accuracy rate.
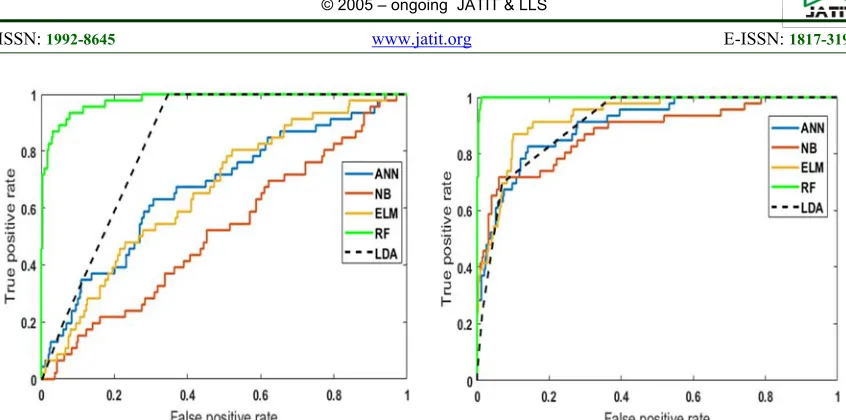
Similarly, ROC accuracy curves for fused features extraction based on select classifiers are shown in
Figure 13,14and 15. Again, RF accuracy rates were superior to all other classifiers
7135
Figure 13: ROC curves for different classifiers using Figure 14: ROC curve for different classifiers using
SC–PCA FA-PCA
Figure 15: ROC curves for different classifiers using SC-FA
The performance curves of Random Forest is comparatively better than other classifiers in all techniques, however NB shows somehow better results along with RF in Figure 15. So that for SC-FA fused feature extraction technique the performance curves of all the classifiers shows that, all the classifiers performed better for SC-FA technique.
5. CONCLUSION
This study developed and assesses the predictive model using different features selection and
7136
REFERENCES
[1] P. Cortez And A. M. G. Silva, "Using Data Mining To Predict Secondary School Student Performance," 2008.
[2] C. Romero And S. Ventura, "Educational Data Mining: A Review Of The State Of The Art," Ieee Transactions On Systems, Man, And Cybernetics, Part C (Applications And Reviews), Vol. 40, Pp. 601-618, 2010. [3] C. Silva And J. Fonseca, "Educational Data
Mining: A Literature Review," In Europe And Mena Cooperation Advances In Information And Communication Technologies, Ed: Springer, 2017, Pp. 87-94. [4] M. I. Karim, A. Hamid, And H. Shah, "Factor Structure Of The Student Engagement
Instrument Among Malaysian
Undergraduates," 2015.
[5] P. Thakar, "Performance Analysis And Prediction In Educational Data Mining: A Research Travelogue," Arxiv Preprint Arxiv:1509.05176, 2015.
[6] M. Anoopkumar And A. M. Z. Rahman, "A Comprehensive Survey On Educational Data Mining And Use Of Data Mining Techniques For Improving Teaching And Predicting Student Performance."
[7] V. Ramesh, P. Parkavi, And P. Yasodha, "Performance Analysis Of Data Mining Techniques For Placement Chance Prediction," International Journal Of Scientific & Engineering Research, Vol. 2, P. 1, 2011.
[8] M. Pandey And S. Taruna, "A Comparative Study Of Ensemble Methods For Students' Performance Modeling," International Journal Of Computer Applications, Vol. 103, 2014.
[9] T. Mishra, D. Kumar, And S. Gupta, "Students’ Employability Prediction Model Through Data Mining," International Journal Of Applied Engineering Research, Vol. 11, Pp. 2275-2282, 2016.
[10] A. A. Aziz, N. H. Ismail, And F. Ahmad, "First Semester Computer Science Students’ Academic Performances Analysis By Using Data Mining Classification Algorithms," In International Conference On Artificial Intelligence And Computer Science (Aics 2014), 2014.
[11] R. B. Sachin And M. S. Vijay, "A Survey And Future Vision Of Data Mining In Educational Field," In Advanced Computing & Communication Technologies (Acct), 2012
Second International Conference On, 2012,
Pp. 96-100.
[12] A. M. Shahiri And W. Husain, "A Review On Predicting Student's Performance Using Data Mining Techniques," Procedia Computer Science, Vol. 72, Pp. 414-422, 2015.
[13] A. Pradeep And J. Thomas, "Predicting College Students Dropout Using Edm Techniques," International Journal Of Computer Applications, Vol. 123, 2015. [14] M. A. Al-Barrak And M. S. Al-Razgan,
"Predicting Students'performance Through Classification: A Case Study," Journal Of Theoretical & Applied Information Technology, Vol. 75, 2015.
[15] M. A. Al-Barrak And M. Al-Razgan, "Predicting Students Final Gpa Using Decision Trees: A Case Study," International Journal Of Information And Education Technology, Vol. 6, P. 528, 2016.
[16] G. Kashyap And E. Chauhan, "Review On Educational Data Mining Techniques," International Journal Of Advanced Technology In Engineering And Science, 3 (11), Pp. 308-316, 2015.
[17] C. Romero, S. Ventura, P. G. Espejo, And C. Hervás, "Data Mining Algorithms To Classify Students," In Educational Data Mining 2008, 2008.
[18] B. Kapur, N. Ahluwalia, And R. Sathyaraj, "Comparative Study On Marks Prediction Using Data Mining And Classification Algorithms," International Journal Of Advanced Research In Computer Science, Vol. 8, 2017.
[19] N. Mayasari, "Comparison Of Support Vector Machine And Decision Tree In Predicting On-Time Graduation (Case Study: Universitas Pembangunan Panca Budi)." [20] W.-X. Liu And C.-H. Cheng, "A Hybrid
Method Based On Mlfs Approach To Analyze Students' Academic Achievement,"
In Natural Computation, Fuzzy Systems And
Knowledge Discovery (Icnc-Fskd), 2016 12th
International Conference On, 2016, Pp.
1625-1630.
[21] S. P. Algur, P. Bhat, And N. H. Ayachit, "Educational Data Mining: Rt And Rf Classification Models For Higher Education Professional Courses," International Journal Of Information Engineering And Electronic Business, Vol. 8, P. 59, 2016.
7137 Mining Approach," Eurasian Journal Of Educational Research, Vol. 54, Pp. 207-226, 2014.
[23] S. Agarwal, G. Pandey, And M. Tiwari, "Data Mining In Education: Data Classification And Decision Tree Approach," International Journal Of Education, E-Business, E-Management And E-Learning, Vol. 2, P. 140, 2012.
[24] H. Van Sang, N. H. Nam, And N. D. Nhan, "A Novel Credit Scoring Prediction Model Based On Feature Selection Approach And Parallel Random Forest," Indian Journal Of Science And Technology, Vol. 9, 2016. [25] C. Huertas And R. Juárez-Ramírez, "Filter
Feature Selection Performance Comparison In High-Dimensional Data: A Theoretical And Empirical Analysis Of Most Popular Algorithms," In Information Fusion (Fusion), 2014 17th International Conference On, 2014, Pp. 1-8.
[26] H.-H. Hsu, C.-W. Hsieh, And M.-D. Lu, "Hybrid Feature Selection By Combining Filters And Wrappers," Expert Systems With Applications, Vol. 38, Pp. 8144-8150, 2011. [27] B. A. Olshausen And D. J. Field, "Sparse
Coding With An Overcomplete Basis Set: A Strategy Employed By V1?," Vision Research, Vol. 37, Pp. 3311-3325, 1997. [28] J. Mairal, M. Elad, And G. Sapiro, "Sparse
Representation For Color Image Restoration," Ieee Transactions On Image Processing, Vol. 17, Pp. 53-69, 2008. [29] J. Yang, J. Wright, T. Huang, And Y. Ma,
"Image Super-Resolution As Sparse Representation Of Raw Image Patches," In Computer Vision And Pattern Recognition,
2008. Cvpr 2008. Ieee Conference On, 2008,
Pp. 1-8.
[30] J. Mairal, F. Bach, J. Ponce, G. Sapiro, And A. Zisserman, "Discriminative Learned Dictionaries For Local Image Analysis," In Computer Vision And Pattern Recognition,
2008. Cvpr 2008. Ieee Conference On, 2008,
Pp. 1-8.
[31] S. Zeng, J. Gou, And X. Yang, "Improving Sparsity Of Coefficients For Robust Sparse And Collaborative Representation-Based Image Classification," Neural Computing And Applications, Pp. 1-14, 2017.
[32] F. J. Huang, Y.-L. Boureau, And Y. Lecun, "Unsupervised Learning Of Invariant Feature Hierarchies With Applications To Object Recognition," In Computer Vision And
Pattern Recognition, 2007. Cvpr'07. Ieee Conference On, 2007, Pp. 1-8.
[33] J. Yang, K. Yu, Y. Gong, And T. Huang, "Linear Spatial Pyramid Matching Using Sparse Coding For Image Classification," In Computer Vision And Pattern Recognition,
2009. Cvpr 2009. Ieee Conference On, 2009,
Pp. 1794-1801.
[34] S. Gao, I. W.-H. Tsang, L.-T. Chia, And P. Zhao, "Local Features Are Not Lonely– Laplacian Sparse Coding For Image Classification," In Computer Vision And Pattern Recognition (Cvpr), 2010 Ieee
Conference On, 2010, Pp. 3555-3561.
[35] A. Qayyum, A. S. Malik, N. M. Saad, M. Iqbal, M. F. Abdullah, W. Rasheed, Et Al., "Image Classification Based On Sparse-Coded Features Using Sparse Coding Technique For Aerial Imagery: A Hybrid Dictionary Approach," Neural Computing And Applications, Pp. 1-21.
[36] V. Agarwal And S. Bhanot, "Radial Basis Function Neural Network-Based Face Recognition Using Firefly Algorithm,"
Neural Computing And Applications, Pp.
1-18.
[37] J. W. Lee, J. B. Lee, M. Park, And S. H. Song, "An Extensive Comparison Of Recent Classification Tools Applied To Microarray Data," Computational Statistics & Data Analysis, Vol. 48, Pp. 869-885, 2005.
[38] A. Statnikov, C. F. Aliferis, I. Tsamardinos, D. Hardin, And S. Levy, "A Comprehensive Evaluation Of Multicategory Classification Methods For Microarray Gene Expression Cancer Diagnosis," Bioinformatics, Vol. 21, Pp. 631-643, 2005.
[39] S. Wongpun And A. Srivihok, "Comparison Of Attribute Selection Techniques And Algorithms In Classifying Bad Behaviors Of Vocational Education Students," In Digital Ecosystems And Technologies, 2008. Dest 2008. 2nd Ieee International Conference On, 2008, Pp. 526-531.
[40] P. Kamiya Malviya And A. Jain, "A Hybrid Approach For Integrating Genetic Algorithms With Svm For Classification And Modelling Higher Education Data."
[41] H. Gulati, "Predictive Analytics Using Data Mining Technique," In Computing For Sustainable Global Development (Indiacom),
2015 2nd International Conference On,
2015, Pp. 713-716.
7138 Approach To Learning Analyics," In Advanced Learning Technologies (Icalt), 2016 Ieee 16th International Conference On, 2016, Pp. 465-467.
[43] J. J. Rodriguez, L. I. Kuncheva, And C. J. Alonso, "Rotation Forest: A New Classifier Ensemble Method," Ieee Transactions On Pattern Analysis And Machine Intelligence, Vol. 28, Pp. 1619-1630, 2006.
[44] A. Qayyum, A. S. Malik, N. M. Saad, M. Iqbal, M. Faris Abdullah, W. Rasheed, Et Al., "Scene Classification For Aerial Images Based On Cnn Using Sparse Coding Technique," International Journal Of Remote Sensing, Vol. 38, Pp. 2662-2685, 2017. [45] S. G. Mallat And Z. Zhang, "Matching
Pursuits With Time-Frequency Dictionaries," Ieee Transactions On Signal Processing, Vol. 41, Pp. 3397-3415, 1993.
[46] G. M. Davis, S. G. Mallat, And Z. Zhang,
"Adaptive Time-Frequency
Decompositions," Optical Engineering, Vol. 33, Pp. 2183-2191, 1994.
[47] S. S. Chen, D. L. Donoho, And M. A. Saunders, "Atomic Decomposition By Basis Pursuit," Siam Review, Vol. 43, Pp. 129-159, 2001.
[48] H. Bostrom, "Feature Vs. Classifier Fusion For Predictive Data Mining A Case Study In Pesticide Classification," In Information Fusion, 2007 10th International Conference On, 2007, Pp. 1-7.
[49] J. Xu, Y. Han, D. Marcu, And M. Van Der Schaar, "Progressive Prediction Of Student Performance In College Programs," In Aaai, 2017, Pp. 1604-1610.
[50] H. Hotelling, "Relations Between Two Sets Of Variates," Biometrika, Vol. 28, Pp. 321-377, 1936.
[51] D. Iseppon, A. S. Gomes, R. Rodrigues, J. L. C. Ramos, And J. Silva, "Impact Of Teaching Action On Student Interaction In Virtual Learning Environments: Canonical Correlation Analysis," In Brazilian Symposium On Computers In Education (Simpósio Brasileiro De Informática Na Educação-Sbie), 2016, P. 1016.
[52] M. Joshi, P. Bhalchandra, A. Muley, And P. Wasnik, "Analyzing Students Performance Using Academic Analytics," In Ict In Business Industry & Government (Ictbig), International Conference On, 2016, Pp. 1-4. [53] P. Li, M. Xu, J. Wu, And L. Shang, "Using
Canonical Correlation Analysis For Parallelized Attribute Reduction," In Pacific
Rim International Conference On Artificial Intelligence, 2016, Pp. 433-445.
[54] P. O. Gislason, J. A. Benediktsson, And J. R. Sveinsson, "Random Forests For Land Cover Classification," Pattern Recognition Letters, Vol. 27, Pp. 294-300, 2006.
[55] Q. Feng, J. Liu, And J. Gong, "Uav Remote Sensing For Urban Vegetation Mapping Using Random Forest And Texture Analysis," Remote Sensing, Vol. 7, Pp. 1074-1094, 2015.