International Journal of Emerging Technology and Advanced Engineering
Website: www.ijetae.com (ISSN 2250-2459,ISO 9001:2008 Certified Journal, Volume 4, Issue 8, August 2014)
Medical Diagnosis System Using Ripplet Transform
Hagote Kiran Kedarnath
1, Prof. Borkar B. S.
21,2Information Technology, AVCOE Sangamner, India
Abstarct -- Content-based image retrieval (CBIR) approach permits the user to extract a picture from an enormous database based mostly upon a question .An efficient and effective retrieval performance is achieved by selecting the simplest transform and classification techniques. However, the current transform techniques like Fourier Transform, cosine transform, wavelet transform suffer from discontinuities like edges in pictures. To overcome this disadvantage use Ripplet Transform (RT) has been implemented along with the neural network based mostly classifier referred to as Multilayered perceptron (MLP) for locating a good retrieval of image. Medical image fusion using PCNN and modified spatial frequency based on the ripplet transform type I. the source medical picture are divide by discrete RT(DRT), the low frequency sub bands (LFSs) are fused using the max selection rule. For the fusion of high frequency subbands (HFSs) a PCNN model is utilized. In the proposed medical diagnosis system use different technique like Mutual Information (MI), Spatial Frequency (SF) and Entropy (EN).
Keywords-- content-based image retrieval(CBIR), Image Fusion, Ripplet Transform, PCNN.
I. INTRODUCTION
Advances in data storage and image acquisition technologies have large databases. so as to deal with these datas and to with efficiency manage these collections, it's necessary to develop an economical image retrieval system. In Content based Image Retrieval (CBIR) system the pictures may be retrieved from outsized information supported the visual content information. The visual content of a picture is analyzed in terms of low-level features extracted from the image. These low level features embrace color, shape and texture fea. There are many transform techniques implemented for the feature extraction process. However the transforms techniques like Fourier Transform (FT) and wavelet Transform (WT)[2] suffer from discontinuities like edges and contours in images. In order to remove that conventional transforms an efficient technique known as Ripplet transform(RT) has been implemented for feature extraction. It is the next dimensional of the curvelet transform, create to show pictures at different scales and different directions partitioning 2 dimensional (2D) singularities on at random shaped curves.
Inorder to enhance the retrieval performance and to decrease the procedure complexities a neural network based mostly classification tool known as Multilayer perceptron (MLP) has been applied.
There are several MGA tools were proposed like Ridgelet, Curvelet and Contourlet etc. These MGA tools do not suffer from the problems of wavelet. for improve the fusion result used MGA tools [1], [3], [4]. For proposed technique used RT in the proposed method, because RT is capable of resolving two dimensional (2D) singularities and representing picture edges more efficiently. To handle this inequality regarding the importance/contribution of each of the source images in the fused image, different activity level measurements (ALMs) have been applied in the IF paradigm. PCNN is a visual cortex-inspired neural network and characterized by the global coupling and pulse synchronization of neurons [5], [6]. PCNN and it‟s modified versions have been used in the IF paradigm by various researchers [7], [8], [9], [10]. The results of various research works show that PCNN outperforms the other conventional image fusion methods. However, in most of the existing IF methods based on PCNN, the value of single pixel (coefficient) in spatial or transform domain is used to motivate one neuron. The LFSs are fused using the „max selection‟ rule, and the HFSs are fused using the PCNN and MSF.
Comparisons of the proposed method with some of the existing MIF schemes, show that . The paper is organized as. RT is described in Section 2. In Section 3, the standard PCNN model is briefly reviewed. Section 4, presents the proposed MIF algorithm. in section 5 shows the Results and other technique comparisons , and we draw conclusion in Section 6.
II. RIPPLET TRANSFORM(RT)
International Journal of Emerging Technology and Advanced Engineering
Website: www.ijetae.com (ISSN 2250-2459,ISO 9001:2008 Certified Journal, Volume 4, Issue 8, August 2014)
Ripplet Transform used to create a new tight frame with sparse representation for picture with discontinuities along
Cd curves [12].
A. Continuous Ripplet Transform (CRT)
For a two Dimensional integrable
f x
( )
, the CRT isdefined because the real number of
f x
( )
and rippletsas
ab( )
x
given inWhere
R a b
( , , )
are the coefficients as ripplet and(.)
denote operator as conjugate. The ripplet function of the equivalent. l is defmed as
(2) Where
a0 is that the ripplet part perform given by theshape
(3) The equation(3) shows the rotation matrix ,where
x
andb
are 2D vectors ; b & θ denotes the position parameter and rotation parameter severally.The ripplet part perform is defined in frequency domain as 1(4)
Where
a( , )
r
is that the Fourier remodel of
a0 [image:2.612.386.501.183.294.2]in coordinate system, and a is that the scale parameter. W(r) is that the "radial-window" and V(
) is the "angular window". There are 2 side have supports at point [1/2 ,2] and [-1 , 1] severally. They satisfy the subsequent acceptableness conditions:Figure. The application of polar frequency domain. (The shaded 'wedge' corresponds to the frequency remodel of the part function).
Figure 1.the tiling of polar frequency
The ripplet functions decay in no time outside the elliptical effective region, that has the subsequent property for its length and width: . Length and dimension is that the major and axis of the conic section severally. The region tuned by c as a support and d as degree be speaks the foremost distinctive property of ripplets (i.e) the final scaling.
The CRT will capture solely the characteristics of high frequency elements of j the size parameter 'a' cannot take the worth of infmity. So the 'full' CRT consists of fme scale RT and coarse scale isotropic WT[6]. The input perform may be reconstructed supported its ripplet coefficients.
B. Discrete Ripplet Transform (DRT)
As digital image process wants distinct transform rather than continuous remodel, here we describe the discretization of R T [6]. The discretization of CRT(Continuous ripplet remodel is based on the discretization of the parameters of ripplet functions
,
j k
a b and
l substitutea
,b
,
respectively , andsatisfy that
and , where
[k ,k ]
1 2T
k
,and1 2
, , ,
j k k l
.(.)
T denotes the transpose of a vectord
, since any real number may be approximated by rational numbers ,so we will represent d with d=n/m and,
0
.
International Journal of Emerging Technology and Advanced Engineering
Website: www.ijetae.com (ISSN 2250-2459,ISO 9001:2008 Certified Journal, Volume 4, Issue 8, August 2014)
Where W and V satisfy the subsequent acceptableness conditions:
given c, d and j. The 'wedge' comparable to the ripplet perform within the frequency domain is
The DRT of an M x N image
f n n
( ,
1 2)
are within theform of
Where
R
j k l, , square measure the ripplet co-efficients.The image may be reconstructed through Inverse Discrete Ripplet Transform (IDRT)
As a generalized version of the present curvelet transform, RT is not only capable of resolution second Dimensional singularities, but it additionally has few smart properties [7]:
1.It forms a brand new tight enclose a perform house. And is capable of localizing in spatial and frequency domain providing a additional economical and effective representation for images or 2D signals. 2.It has general scaling with impulsive degree and
[image:3.612.335.553.129.271.2]support that will capture second singularities on Different curves in any directions. Jun XU et al. have showed that RT will give a more practical representation for pictures with singularities on smooth curves [6].
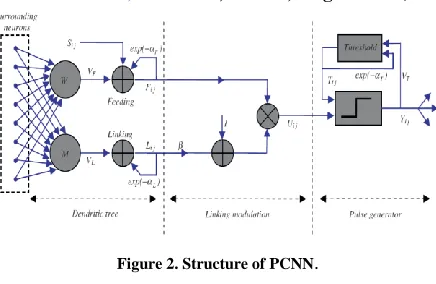
Figure 2. Structure of PCNN.
III. PULSE COUPLED NEURAL NETWORK
PCNN may be a single stratified, two-dimensional, and laterally connected neural network of pulse coupled neurons. The PCNN neurons structure is shown in Fig. 2. The nerve cell consists of Associate in Nursing input half (dendritic tree), linking half and a generator. The nerve cell receives the input signals from feeding and linking inputs. Feeding input is that the primary input from the neurons receptive space.. the quality PCNN model is delineate as iteration by the subsequent equations [10],[11],[13] .
In the Eq.(12) to Eq.(16), the indexes i and j seek advice from the pixel location within the image, k and l seek advice from the dislocation in an exceedingly symmetric neighborhood around one pixel, and n denotes the current iteration (discrete time step). Here n varies from one to N (total variety of iterations). The dendritic tree is given by Eqs.(12)-(13).The 2 main elements F and L area unit known as feeding and linking, severally.
w
i j k l, , , and, ,k,l
i j
International Journal of Emerging Technology and Advanced Engineering
Website: www.ijetae.com (ISSN 2250-2459,ISO 9001:2008 Certified Journal, Volume 4, Issue 8, August 2014)
VF And VL area unit normalizing constants.
F AndL
area unit the time constants; usually,
F
L. Thelinking modulation is given in equivalent weight Eq.(16), wherever
U
i j,[ ]
n
is that the internal state of the neuronand
is that the linking parameter. The heart beat generator determines the firing events within the model in equivalent weight.Eq.(15).Y [ ]
i j,n
Depends on the innerstate and threshold. The dynamic threshold of the nerve cell is equivalent Eq.(16), where
V
T and
T area unitnormalized constant and time constant, severally.
IV. PROPOSED METHOD
The notations used in this section as follows: A, B, R represents the 2 source pictures and therefore the resultant image, severally. C = (A,B,R).
L
CGIndicates the LFS of theimage C at the coarsest scale G. ,
C g h
D
represents the HFS of the image C at scale g, (g = 1,….,G) and direction h. (i; j) denotes the spatial location of every coefficient . The method is simply extended to more than two pictures.A. Fusing Low Frequency Subbands
The LFSs coefficients area fused using „max selection‟ rule. According to this fusion rule, choose the frequency coefficients from
L
GAorB G
L
with larger definite quantity because the fused coefficients:B. Fusing High Frequency Sub Bands
The HFSs of the supply pictures are fused PCNN. As humans area unit sensitive to options like edges, contours etc., so rather than PCNN in DRT domain directly (i.e., using individual coefficients), changed spatial frequency (MSF) in DRT domain is taken into account because the image feature to inspire the PCNN.
1) Modified Spatial Frequency (MSF): spatial frequency (SF) projected by Eskicioglu et al. is calculated by row and column frequency [14]. It reflects the entire activity level of an image, which implies the larger the SF, the upper the image resolution. We have used a changed version of SF within the proposed MIF technique. The MSF consists of row (RF), column (CF) and diagonal frequency (DF). For a M×N pixels image f the MSF is outlined as
2) Fusion Using DRT-MSF-PCNN:
Let, be the changed spatial
frequency similar to a coefficient ,( , ) C g hi j
International Journal of Emerging Technology and Advanced Engineering
Website: www.ijetae.com (ISSN 2250-2459,ISO 9001:2008 Certified Journal, Volume 4, Issue 8, August 2014)
Where, the feeding input
, ,C
,
[ ]
g h i j
n
F
up to the normalized modified spatial frequency . Thelinking input
L
i jg h c,, , is up to the total of neurons firingtimes in linking range.
W
i j k l, , , Is that the conjunction gainstrength and subscripts k and l area unit the dimensions of linking range the PCNN.
a
L is the decay constants.
Isthat the linking strength,
V
L andV
area unit theamplitude gains. ,, ,C
g h i j
U
is that the total internal activity and, ,C ,
g h i j
is that the threshold. If ,, ,Cg h i j
U
is larger than ,, ,Cg h i j
,then the nerve cell can generate a pulse
, ,C ,
g h i j
Y
=1, is known as one firing time. The total of, ,C ,
g h i j
Y
=1 in niteration (namely the firing times), is employed to represent
the image info. Here, instead of
, ,C
,
[ ]
g h i j
n
Y
, we'veanalyzed
, ,C
,
[ ]
g h i j
n
T
, since neighboring coefficients with similar options represent similar firing times in an exceedingly given iteration times.C. Algorithm
The medical pictures to be coalesced at pixels area unit aligned. Here we tend to outlines the salient steps of the projected MIF method:
1)Decompose the registered supply medical pictures A and B by DRT to get the LFSs and HFSs.
2)Fused the coefficients of LFSs using the „max selection‟ rule delineate in Section IV-A, to get the fused LFS.
3)Compute the MSF as delineate in Section IV-B1, using overlapping window on the coefficients in HFSs.
4)Input MSF of every HFSs to inspire the PCNN and generate pulse of neurons with Eqs.(24)–(29). and
cypher the firing times
, ,C
,
[ ]
g h i j
n
T
by equivalent weight.(31).5)If n = N, then iteration stops. Then fuse the coefficients in the HFSs by the subsequent fusion rule:
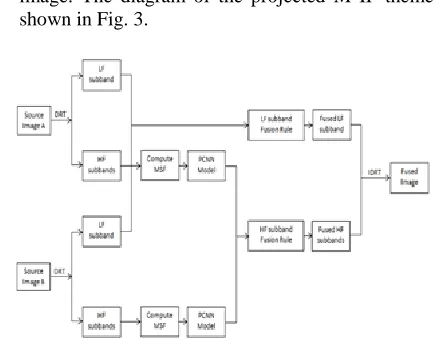
[image:5.612.336.557.209.382.2]6)Apply inverse ripplet remodel (IDRT) on the fused LFS and HFSs to get the ultimate fused medical image. The diagram of the projected M IF theme is shown in Fig. 3.
Figure 3. Diagram of the projected MIF technique.
V. RESULTS AND OTHER TECHNIQUE COMPARISON
The projected MIF technique, extensive experiments were carried out on numerous modalities of medical pictures. Fig. 4(a)-(b) and Fig. 4(c)-(d) shows 2 different sets of supply pictures used in the analysis , and are show by IS1 and IS2, severally. The CT image in Fig. 4(a) shows the bones and therefore the MRI image in Fig. 4(b) displays the soft tissues info. The T1- weighted man image in Fig. 4(c) of IS2 contains the soft tissues however no illness info, and therefore the MRA image in Fig. 4(d) shows the illness info (shown by the marked ellipse) however no soft tissues info. The decomposition parameter of DRT was levels = [1, 2, 4, 4]. Parameters of PCNN was set as k × l = 3×3 ,
a
0.2
,
0.2
,V
L
1.0
,V
20
,International Journal of Emerging Technology and Advanced Engineering
[image:6.612.328.558.254.336.2]Website: www.ijetae.com (ISSN 2250-2459,ISO 9001:2008 Certified Journal, Volume 4, Issue 8, August 2014)
Figure. 4. supply Images: (a) CT image (SF= 4.43, EN= 1.71, STD= 44.75); (b) MRI image (SF= 6:26, EN= 5:66, STD= 58:84); (c) T1-weighted man image (SF= 7:70, EN= 4:15, STD= 69:20); (d) MRA image (SF= 6:49, EN= 4:33, STD= 25:58). ((a)-(b)) primary set IS1
and ((c)-(d)) second set IS2 of images.
To show the effectiveness of the projected technique, visual as well as quantitative chemical analysis were administrated. The chosen quantitative criterions employed in the experiments area unit as follows:
A. Standard Deviation (STD)
It measures the distinction within the fused image. a picture with high distinction would have a high variance.
Where M × N denotes the image dimension and the gray-value of the pixel element of image F at position (m, n) indicates F (m, n) and
B. Entropy (EN)
The entropy of a picture may be a live of knowledge content. It‟s the common variety of bits required to quantize the intensities within the image. It‟s outlined as
Where
p g
( )
is that the likelihood of grey-level g, and therefore the vary of g is [0,..., L-1]. A picture with high info as high entropy. Suppose entropy of fused image is over parent pictures then it indicates that the coalescedC. Spatial Frequency (SF)
Spatial frequency is accustomed live the general activity and clarity level of a picture. Larger SF worth denotes higher fusion result:
(33)
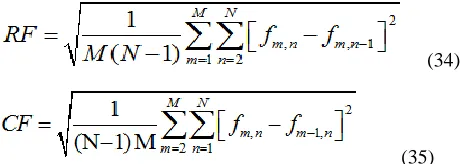
Where RF is that the row frequency and CF is that the column frequency:
(34)
(35)
Where M × N denotes the dimensions of image and the gray-value of the picture element of image F at position (m, n) as indicates F(m, n).
D. MI
A larger measure implies higher quality. Given 2 pictures
x
F andx
R MI is outlined as [15].Where
Where
h
R,h
F area unit the normalized grey levelhistograms of
x
F andx
R , severally.h
R F, is that the jointgrey level bar graph of
x
F andx
R , and L is that thevariety of bins.
x
F andx
Rcorrespond to the reference andfused pictures, severally.
I(x ;x )
R F indicates whatproportion info the fused image
x
F conveys regarding thereference
x
R . Thus, the upper the mutual info betweenx
F andx
R, the a lot of possiblex
Fresembles the bestInternational Journal of Emerging Technology and Advanced Engineering
[image:7.612.69.270.156.228.2]Website: www.ijetae.com (ISSN 2250-2459,ISO 9001:2008 Certified Journal, Volume 4, Issue 8, August 2014)
TABLE I
PERFORMANCE COMPARISONS USING IS1
Scheme MI SF EN STD
Scheme[7] - 6.56 6.39 53.82 Scheme[5] 2.71 - 6.73 57.98 Scheme[6] 2.06 - 4.98 - Our theme 3.12 7.07 6.81 64.13
[image:7.612.58.281.285.418.2]He found that the coalesced pictures obtained by the projected MIF theme, were a lot of clear, informative and have higher distinction that is useful in image as well as interpretation.
Figure. 5. Results of the projected MIF theme (a) fused image of IS1; (b) fused image of IS2
Fig. 5, shows the resultant fused pictures obtained by our proposed MIF technique for the two check sets of pictures IS1 and IS2. It is simply seen from the Figure. 5, that the fused pictures have way more salient options and elaborate information than the supply pictures of Figure. 4. The Table. I, shows the performance comparisons of our method against a number of the prevailing schemes IS1 MI= 4.19, SF= 8.12, EN= 6.46 and STD= 68.99. The „bold‟ values indicate the very best values in the Table. I. the upper worth of SF indicates that the fused pictures obtained by our projected technique, equally the higher values of nut and STD for the coalesced pictures show that the coalesced pictures obtained by the projected theme, have more info, moreover as higher distinction than the supply images. So, it's clear from Table.
VI. CONCLUSION
Propose a Medical diagnosis system based on ripplet transform using modified spatial frequency motivated PCNN. The DRT is capable of resolving two dimensional singularities and representing image edges more efficiently, which makes the fused images clearer and more informative.
To integrate as much information as possible into the fusedimages the low frequency source subbands are fused using „max selection‟ rule, and PCNN is used to select the „better‟ coefficients from the decomposed source high frequency subbands. To improve the result, instead of using single coefficient to motivate the PCNN, modified spatial frequency is used as the image feature to motivate the PCNN. The proposed MIF method is analyzed both visually and quantitatively, and is compared with several existing IF techniques, and the superiority of the proposed scheme is established.
Acknowledgment
We would like to thank to my college AVCOE sangmner and my guide Prof. Borkar B.S for helping us in the implementation of medical Diagnosis system using Ripplet Transform.
REFERENCES
[1] Li H, B. S. Manjunath, and S. K. Mitra, “Multi-sensor image fusion using the wavelet transform,” in Proc. of CVGIP: Graphical Model and Image Processing, vol. 57, no. 3, 1995, pp. 235–245.
[2] Yang Y., D. S. Park, S. Huang, and N. Rao, “Medical image fusion via an effective wavelet-based approach,” EURASIP Journal on Advances in Signal Processing, vol. 2010, pp. 44:1–44:13, 2010. [3] Tian H., Y.-N. Fu, and P.-G. Wang, “Image fusion algorithm based
on regional variance and multi-wavelet bases,” in Proc. of 2nd Int. Conf Future Computer and Communication, vol. 2, 2010, pp. 792– 795.
[4] Yang L, Guo B. L., and W. Ni, “Multimodality medical image fusion based on multiscale geometric analysis of contourlet transform,” Neurocomputing, vol. 72, no. 1-3, pp. 203–211, 2008. [5] Das S., Chowdhury M., and Kundu M. K., “Medical image fusion
based on ripplet transform type-I,” Progress In Electromagnetics Research B, vol. 30, pp. 355–370, 2011.
[6] Eckhorn R, Reitboec H.J., Arndt M., and Dicke P., “Feature linking via synchronization among distributed assemblies: Simulations of results from cat visual cortex,” Neural Computation, vol. 2, pp. 293– 307, 1990.
[7] Wang Z., Ma Y., Cheng F., and Yang L., “Review of pulse-coupled neural networks,” Image Vision Comput., vol. 28, no. 1, pp. 5–13, 2010.
[8] Liu Q., ping Xu L., Wang Y., Ma Y. de, and Xie Q., “A novel algorithm of image fusion based on adaptive ULPCNN time matrix,” in Information Engineering (ICIE), 2010 WASE International Conference on, vol. 1, aug. 2010, pp. 198 –202.
[9] Xiao-Bo Q., Jing-Wen Y., Hong-Zhi X., and Zi-Qian Z., “Image fusion algorithm based on spatial frequency-motivated pulse coupled neural networks in nonsubsampled contourlet transform domain,” Acta Automatica Sinica, vol. 34, no. 12, pp. 1508–1514, 2008. [10] Wang Z, Ma Y., and Gu J., “Multi-focus image fusion using
PCNN,” Pattern Recognition, vol. 43, no. 6, pp. 2003–2016, June 2010.
International Journal of Emerging Technology and Advanced Engineering
Website: www.ijetae.com (ISSN 2250-2459,ISO 9001:2008 Certified Journal, Volume 4, Issue 8, August 2014)
[12] J. Xu, L. Yang, and. Wu D, “Ripplet: A new transform for image processing,” Journal of Visual Communication and Image Representation, vol. 21, no. 7, pp. 627–639, 2010.
[13] Johnson J. and Padgett M., “PCNN models and applications,” Neural Networks, IEEE Transactions on, vol. 10, no. 3, pp. 480 – 498, may 1999.
[14] Eskicioglu A. and Fisher P., “Image quality measures and their performance,” Communications, IEEE Transactions on, vol. 43, no. 12, pp. 2959 –2965, Dec 1995.