3739
THE EFFECTS OF INFORMATION QUALITY, SERVICE
QUALITY, AND COMPATIBILITY ON CONTINUE USE OF
M-LEARNING AMONG STUDENTS IN THE PUBLIC
UNIVERSITIES OF IRAQI
1SALIH HAJEM GLOOD, 2RAED MOHAMMED HUSSEIN, 3WISAM ABDULADHEEM
KAMIL
1Computer and Mathematics Dept., University of Al-Muthanna, Iraq 2Directorate of Education in Dhi-Qar, Iraq
3Computer Science Dept., University of Dhi-Qar, Iraq
E-mail: 1[email protected], 2 [email protected],3[email protected]
ABSTRACT
The success of information system could be determined based on continuously using the technology for future benefits. In today’s era of technology, M-Learning (ML) system has become an important component of Information and Communication Technology provided by educational institutions such as universities to facilitate all the transactions between institutions and their students or lecturers. This system has gained the popularity in developed and developing countries alike. Despite the known benefits of ML to the education community, usage of ML services among students in the developing countries, especially in Iraq, is still low. Additionally, there has not been empirical study on the continuous usage of ML services in developing countries such as Iraq. The primary objective of this study is to determine the contributing factors for continuous usage of ML services among students in a higher education of Iraq. Moreover, the study used quantitative approach by distributing 600 questionnaires to respondents in the public universities of Iraq. Besides that, the collected data was analysed using a Structural Equation Model. The findings showed that information quality construct has a large effect on user satisfaction than service quality and compatibility constructs.
Keywords: Mobile Learning, Continuous Usage, Evaluation IS Success, Higher Education.
1. INTRODUCTION
The rapid evolution of information and communication technology (ICT), especially mobile technology, made social changes in several fields such as tourism, financial institutions, and entertainments [1]. Also these developments have integrated into education institutions [2].
In last decade, educational institutions such as public universities around the globe utilize the ICT to improve services’ delivery to their students and staff by introducing e-learning. E-learning delivers education to students in distant locations or to people face difficulty in attending classes through limitations of time or mobility [3]. Despite the fact that e-learning is highly crucial as it is the electronic learning format using ICT, it is unlikely to replace the conventional learning but merely functions it as an alternative facility.
Must of the education institutions (universities) have noticed the rapid evolution of wireless technologies and the widespread of internet-enabled mobile devices in many countries [4]. This encouraged these institutions to move naturally towards Mobile-Learning (M-Learning) as a next step to enhance the quality and delivery of their services [5].
3740 teachers and learners the opportunity to interact and gain access to educational material using mobile devices independent of time and space.
The main forces that influence the move to ML are mobile device penetration, emergence of mobile internet and mobile net applications and services [8]. Mobile services considered a highly appropriate option for countries where Internet access rates are low; however, mobile phone penetration is growing rapidly, particularly in developing countries [9]. Ramayah et al. [3] stated that the utilization of ML services derives more benefits in terms of in-time information delivery, ease of use, and mobility. Most of these benefits are eventually handled by researchers and are called IT opportunities. ML facilitates the accessibility of information 24/7 and also limits bureaucracy to improve the quality of services, whether in terms of time, price, or convenience. These possible benefits are not achieved if the use of these services is not optimal [10]. Thus, using ML services is deemed crucial to the success of ML projects.
Furthermore, Previous studies have shown that many of the existing research in Information System (IS) have concentrated on adoption of IS, while less focus has been given to the post-adoption usage [11]–[13]; Teo, Srivastava and Jiang [14] argued that most of times, the initial usage of IS by some users is followed by reverting to the traditional ways due to the failure to get expected benefits, satisfaction and service quality. Therefore, researchers have stressed that IS continuous is paramount in research due to its viability and the benefits of frequent usage it brings in the IS domain rather than first-time use [15]. However, studies have stressed that the success of IS cannot be guaranteed until the confirmation of its continuous usage by the users is established [16].
The continuous usage of technology becomes an important issue since it is the determinant of IS success. Thus, continuous usage of information technology is mainly dependent on its content value that users’ belief would derive more benefit for the future purposes [17].
In the recent years, M-Learning is interesting and very recent addition as a new vital platform for the education environment. However, use of m-learning is growing rapidly and many universities and colleges are going to support m-learning solutions. The occasional and sustained usage of such services in the higher education environment could encourage students to keep in touch with their education environment. Although the benefit of
mobile technology is enormous and it enables learning services to be used anywhere and anytime, the usage and adoption of the m-learning services is still need to tackle the obstacles that are preventing students’ motivation to use such technology and the university to utilize such technology widely. Furthermore, insufficient research on m-learning adoption results into a lack of a complete view [7].
This explains that there is need to address the factors that see to the continuous usage of ML among the students in different domains such as the higher education of developing countries like Iraq.
2. PROBLEMSTATEMENT
In this modern era of globalization and information technology, many a higher education institutions in developed and developing countries have embraced new technologies in an effort to improve the way they offer education’s services to their students and staff. Especially, in developing countries, most the higher education institutions are seriously seeking the application and use of ML services for their students [3], [11], [18]. But, Surprisingly, the utilization of ML services among students in developing countries is less than satisfactory when compared to alternative forms of learning [19]–[21]. Therefore, although ML is still a problem in developing countries, few studies have researched on ML in developing countries [3], [5], [7], [11], [19]–[21].
Moreover, despite M-learning has a success stories in the western countries utilization, it needs more investigation in Iraq and Middle East. The adoption among students in the higher institutions has been considered by researchers [19], [22]. Moreover, [23] state that m-learning has not reached its maximum potential and the gap between what is offered and what is used is apparent.
3741 technology. Therefore, there is a need to study the factors that lead to the adoption of success and diffusion of this technology and platform in the higher education environment. Therefore, this paper investigates the influencing factors on continue to use of ML services among students in developing countries such as Iraq.
In line with the problem statement, the main research question that this paper trying to answer it is: What are the factors that influence on the continuous usage of ML services among students in a higher education of developing countries such as Iraq?
The rest of this article is organized as follows: Section 3 introduces related studies. Section 4 provides research model and hypotheses. Data collection method is introduced in section 5. Section 6 introduces the results of study, while section 7 discusses the results. Finally, Section 8 concludes the study.
3. LITERATURE REVIEW
M-Learning (ML) is the latest technique for education institutions to deliver services and information accessibility at the universal level for students, teachers, and other staff by wireless and mobile technologies [11]. Mobile technologies provide access in areas (compos) where the infrastructure required for Internet is not a viable option or low. Therefore, ML not only enhances education institutions performance by delivering information and services to students and staff efficiently and economically, but also permits and facilitates students and staff to interact with learning services [3], [11], [26].
Recently, most universities in developing countries are now offering advanced mobile services to their students and staff. These universities are seriously seeking the application and use of ML services for their students [6].
In Iraq, The mobile network infrastructure has been strong recently. According to International Telecommunication Union report in 2014, Iraq is the highest mobile penetration rate amongst 34 countries. Various Internet service providers deliver services through satellites in Iraq, such as Telecom Masarat Company, Earth Link, and Dejlah Internet Services. Companies, such as Korek Telecom, Asia Cell, Zain, Aumnia, and Itisaluna, provide mobile cellular services [27]. International
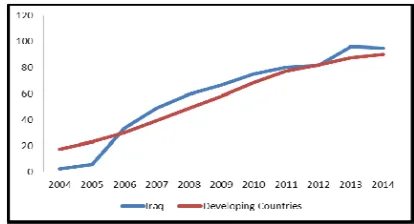
[image:3.612.310.517.213.325.2]Telecommunication Union in 2014, reported that in Iraq, there are 33 million mobile phone users, with the penetration rate for every 100 individuals there are 95 mobile phone subscribers, as shown in Fig. 1 below. This indicates that the mobile penetration is very high, and the mobile networks cover most regions in Iraq. A 2012 report by UNESCO shows that 40 percent of mobile subscribers use the Internet through mobile cellular devices.
Figure 1: Mobile-Cellular penetration rates in developing countries and Iraq from 2004-2014
The Iraqi universities are exploiting wireless and mobile technologies to provide services and information to its students and staff. The most of Iraqi universities has announced the application of an ML initiative to provide e-learning services via wireless communication networks and mobile devices. Although the Iraqi universities invest heavily to implement this project, the utilization and adoption of ML services remain low. Younus [18], who conducted a survey among students in Iraqi universities, revealed that most participants do not use ML services. This finding is in agreement with [5], [19], [28], who found that many universities of developing countries sought to implement ML projects to meet their students’ and staff requirements; however, these countries suffer from low use of ML services by their students. Therefore, this paper investigates the influencing factors on continue to use of ML services among students in developing countries such as Iraq.
4. RESEARCHMODELANDHYPOTHESES
4.1 Information Quality (IQ)
3742 useful if the users view the provided information as accurate, complete, current, and formatted [30].
Searching for information and acknowledge is the most common reason that students to visit ML services. Thus, in many cases, students use ML services for their information needs, where they expect information to be easy to understand, clear, and well formatted. Furthermore, they expected to acquire relevant information anytime and anywhere when using ML services. Students will be dissatisfied and not avail such services again if information is inaccurate, unclear, not current or out of date. Ho [31], argued that users (students) who use ML services can either feel satisfied or dissatisfied with the service or its information products. The use of service and its information products influence the performance of users. Therefore, high-quality information is an important factor for user satisfaction that leads to reuse or continues ML services. In this study, IQ is the degree to which students believe that the quality of the information that ML service produced is accurate, complete, current, and well formatted. Thus, the following hypothesis is proposed:
H1: Information quality has a significance influence on the students’ satisfaction of ML services.
4.2 Service Quality
Researchers have emphasised that service quality is attributed to the feelings of users of technology towards provision of outcome after the initial use [32]. This is as a result of its dimensions that were identified by [33] as positive action of technology in use towards its success, such as reliability, responsiveness, assurance, tangible and empathy.
Dwivedi, Papazafeiropoulou, Brinkman and Lal [34]argued that service quality plays a paramount role in determining consumer readiness or satisfaction to remain with the technology under use. Pursuing this further, researchers have revealed that there is positive relationship between service quality and satisfaction of users of technological devices [3], [29], [32], [35].
Conclusively, information relating to experience derived by the users of product or technology impacts the outcome after usage [17]. Therefore, researchers have established that there is relationship between service quality and the user satisfaction, such that the effect is stronger in
highly experienced users than the low experience users [32]. Moreover, previous studies have emphasised that service quality is a determinant factor of user satisfaction which thereafter affect continuous usage of technology or devices [36], [37]. Therefore, we believe that this relationship is likely to exist in the context of ML services in Iraq as well. The researcher postulates that when there is a high-quality of service, users (students) will have positive feelings toward using ML services. Thus, the following hypothesis is proposed:
H2: Service quality has a significance influence on the user satisfaction of ML services among students in Iraqi universities.
4.3 Compatibility
Rogers [38]defined compatibility as the degree to which an innovation is perceived to be consistent with the current values, past experiences and needs of the potential adopters. Based on the mobile commerce perspective, [39] defined compatibility as the degree by which individual that participated in online transactions via mobile commerce is perceived as being consistent with the potential user’s existing values, beliefs, initial knowledge and current needs. Therefore, compatibility of new technology or innovation is bound to affect user satisfaction due to the retention of content of the technology [15], [38], which is not different from the usage of ML services among students, especially in universities of developing countries.
3743 H3: Compatibility has a significance influence on User satisfaction among students in Iraqi universities.
4.4 User Satisfaction
User Satisfaction (US) is defined as the net perception of pleasure or displeasure, caused by the students’ level of belief that the ML services have fulfilled his or her needs or expectations. Examining US is prevalent in IS success research. A vast majority of literature focusing on US construct as a crucial factor of IS success within different fields (such as, e-commerce, e-banking services, banking services, e-Health services, m-healthcare services and eG services) within a number of countries [35], [43]–[46]. Furthermore, DeLone and McLean [35] emphasized that the US has a significant influence on IS success. However, the empirical studies that examined US from the perspective of ML services and applications among students in a developing country, such as Iraq, are lacking. Furthermore, Bailey and Pearson [47] confirmed that additional validation efforts for the US of using IS on different user environments are necessary. Therefore, the examination on US of using IS on different user environments (such as a higher Education in developing countries) is critical.
The users are viewed as the central part of information system, thus they are the determinant of both satisfaction and dissatisfaction of technology which could suggest the onward usage [17], [48]. Researchers have cleared the distinction between use and satisfaction that use is voluntary in the case of enforcing policy or rules, but satisfaction is the substitute of efficiency and success [35], [40], [49]. Thus, user satisfaction can be described as means of measuring information system success [17]. Hence, In the light of this, [50]stressed that user satisfaction is the prime motivator that determines continue usage of technology. Therefore, the following hypothesis is proposed:
H4: User Satisfaction has a significance influence on Continuous Usage of ML services among students in Iraqi universities.
Figure 2: Research model and hypotheses
5. METHODOLOGY
5.1 Data collection
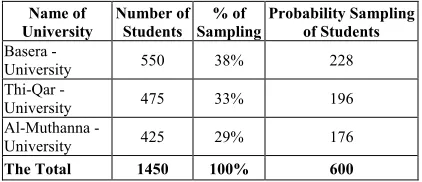
This study applies quantitative research method due to the large number of respondents and wide geographical coverage. The Study was conducted in three public universities of the southern region of Iraq. The main reason to select the southern region rather than middle and northern regions of Iraq due to the southern region is more stability than other regions that suffering Political and civil conflicts. These universities are Basera University, Thi-Qar University and Al-Muthanna University. In addition, the fourth and third stages (second semester of academy year 2016-2017) of the science college of each university were been selected to conduct this study because the students in these stages have more experience of using ML services than other stages. Therefore, According to [51] "a population refers to the entire group of people; events or topics of interest that the researcher wishes to investigate" (p.265); The target population in this study would be the students of fourth and third stages (second semester of academy year 2016-2017) of the science college of each of these three universities (1450 students). Sample size based on the guideline reported by [52] who reports that sample size of 302 would be enough if the study population is between 1400 to1500 elements. The sample for this study comprised 302 students who use ML services. To ensure reduced margin error and potential of non-responses, the base sample size was increased [53]. Six hundred questionnaires were distributed to students of these universities of the southern region of Iraq. Before distributing the 600 questionnaires to students in the universities located in the southern region of Iraq, probability sampling of students for each university in the three universities was conducted as shown in Table 1. Probability sampling was calculated by using formula:
H4 H2
H3 H1
CU
US
IQ
SQ
3744
Table 1: The Probability Sampling of Students for Each University
Additionally, this study employs simple random sampling as sampling technique in the selection of participants due to its cost-effectiveness and simplicity [54], [55] for data collection. As well as, in line with the argument of Sekaran [56], this study also used a self-administered questionnaire as an appropriate mode for data collection due to its ability to stimulate respondents and achieve high rate of response. Six hundred questionnaires were distributed to students of universities of the southern region of Iraq. The total participants was 340, and 300 responses were valid for further analysis, which resulted in a final valid response rate of 88.2%.
5.2 Instruments
The survey questionnaire was developed based on previous studies that reflect the constructs as identified in the research model. The research model includes five factors. Each factor was measured with multiple items; where each item was measured on a five-point Likert scale, from strongly disagree to strongly agree. All items were adapted from extant research to improve content validity. The survey items are shown in the Appendix A.
The early version of our survey instrument was subsequently refined via pre-testing with professors who have significant expertise in the study of IS. The instrument was then further pilot tested with 40 respondents who use ML system. The multiple phases of instrument development resulted in significant refinement and restructuring
of the survey instrument, as well as the establishment of the initial face validity and internal validity of the measures [57].
In the main survey (see Appendix B), the questionnaires were distributed to 600 students in universities of the southern region of Iraq. The survey was conducted over the course of 4 weeks through visiting these universities from 12 March to 9 April 2015. Among the 600 questionnaires distributed, 340 questionnaires were returned, which indicated an 56.7% response rate, while 240 questionnaires were not returned which indicated an 43.3% non-response rate. Forty responses were dropped because they had too many missing values. Only 300 questionnaires were useful for further analysis, which resulted in a final valid response rate of 88.2%.
In this study, chi-square test of independence is used for test of non-response bias. the samples are divided in to early responses (248) and late responses (52) in order to normalize the process. Those respondents who returned the questionnaire within first weeks from the date of distribution were called early responses whereas those respondents who returned the questionnaire after three weeks from the date of distribution were called late responses (see Appendix C). The result of the non-response bias test is shown that there is no significant difference between late and early respondents in terms of their demographic variables. Furthermore, The variables’ statistical frequency distribution in the questionnaire was categorized and shown in such a way that the originality of the research is reflected. Therefore, the demographic information for respondents of this study can be seen in Appendix D.
6. RESULTSANDDISCUSSION
The research model was tested by using partial least squares (PLS)-based structural equation modeling (SEM) technique. The results of PLS-SEM analysis are reported following the widely accepted two-step approach suggested by Chin [58]. The first step is to assess the measurement model (the outer model) for validity and reliability. The second step is to assess the structural model (the inner model) and evaluate the hypothesized relationships. The following subsections discuss the outer model and inner model in detail.
Name of University
Number of Students
% of Sampling
Probability Sampling of Students
Basera
-University 550 38% 228
ThiQar
-University 475 33% 196
AlMuthanna
-University 425 29% 176
The Total 1450 100% 600
Probability Sampling of Students = NP*NS/T Where;
3745 6.1 Measurement Model
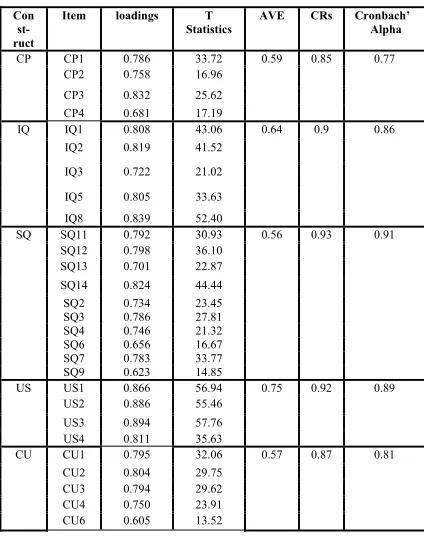
[image:7.612.89.301.267.535.2]After drawing our model, we ran Smart-PLS 2.0 for assessing reliability and validity of the model. Reliability is evaluated by composite reliability (CR) and Cronbach’s alpha [59]. The general acceptable threshold values are 0.60 for Cronbach’s alpha [60]; and 0.70 for CR [59]. As shown in Table 2, all constructs had Cronbach’s alpha values that exceeded 0.60, and CRs were above the threshold values of 0.70. Results indicated the reliability of all constructs in this study.
Table 2: Measurement Properties of Constructs
Con st-ruct
Item loadings T
Statistics AVE CRs Cronbach’ Alpha
CP CP1 0.786 33.72 0.59 0.85 0.77 CP2 0.758 16.96
CP3 0.832 25.62 CP4 0.681 17.19
IQ IQ1 0.808 43.06 0.64 0.9 0.86 IQ2 0.819 41.52
IQ3 0.722 21.02
IQ5 0.805 33.63 IQ8 0.839 52.40
SQ SQ11 0.792 30.93 0.56 0.93 0.91 SQ12 0.798 36.10
SQ13 0.701 22.87 SQ14 0.824 44.44 SQ2 0.734 23.45 SQ3 0.786 27.81 SQ4 0.746 21.32 SQ6 0.656 16.67 SQ7 0.783 33.77 SQ9 0.623 14.85
US US1 0.866 56.94 0.75 0.92 0.89 US2 0.886 55.46
US3 0.894 57.76 US4 0.811 35.63
CU CU1 0.795 32.06 0.57 0.87 0.81 CU2 0.804 29.75
CU3 0.794 29.62 CU4 0.750 23.91 CU6 0.605 13.52
The validity of constructs is evaluated by convergent validity and discriminant validity. To assess convergent validity, the average variance extracted (AVE) of constructs and factor loadings were used. Convergent validity is established when all constructs have an AVE value greater than 0.50 [61]. As shown in Table 2, all AVE values are above 0.50, thereby confirming the convergent validity of constructs. The absolute standardized outer loadings of items ranged from 0.62 to 0.87. as well as, Chin [62] claims that loadings of more than 0.5 could still be acceptable if other indicators exist in the block for comparison. All items are significant at 0.001. Therefore, the convergent validity of the constructs is confirmed.
Discriminant validity reflects the extent to which constructs are significantly different from each other. The first step in assessing discriminant validity is to examine the indicator loadings with respect to all construct correlations. SmartPLS algorithm function was used to produce cross-loadings of all items. As shown in Table 2, all items loaded on their constructs were higher than cross-loadings on other constructs. Therefore, the first assessment of the measurement model’s discriminant validity was satisfied.
[image:7.612.312.508.330.435.2]In the second step, the square root of the AVE of each construct was compared with the correlation between that construct and the other constructs. As shown in Table 3, the square root of the AVE exceeded the highest correlation between that construct and the other constructs, thereby further proving discriminant validity [61], [62].
Table 3: Discriminant Validity Values
CP CU IQ SQ US
CP 0.77
CU 0.26 0.75
IQ 0.37 0.53 0.80
SQ 0.39 0.40 0.62 0.75
US 0.48 0.55 0.62 0.60 0.86
6.2 Structure Model
3746 We assessed the predictive power of the model. The value of R2 is the main criterion by which model fit is assessed in PLS analysis [62]. The value of R2 is normalized between 0 and 1, where a higher value represents better path model estimations. R2 of endogenous constructs are 0.30 and 0.50 for CU and US, respectively.
To test the proposed main hypotheses, the path coefficient between latent variables and their significance was assessed. After running a PLS model, estimates were provided for the path coefficients, which represented hypothesized relationships linking latent constructs. To test the main hypothesis, the bootstrap approach was used to assess the significance of hypothesized relationships in the path model. In the current study, 1,000 resamples were used to perform the bootstrap [62]. The number of bootstrap cases equaled the original number of observations to generate standard errors and obtain t-statistics. As shown in Table 4, the t-statistics indicated that all path coefficients are significant (T statistic > 1.96).
7. DISCUSSION
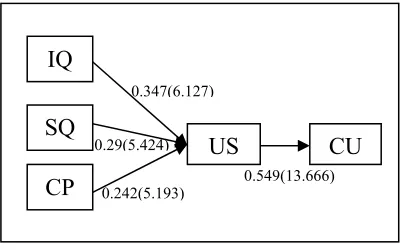
[image:8.612.316.523.365.438.2]This section discusses the results obtained from the analysis of our model in the last section. As shown in Fig. 3, all hypotheses are supported. Information, service qualities and compatibility affected user satisfaction, while user satisfaction has a significant effect on continue to use.
Figure 3: revised model
Among the factors that affect user satisfaction, information quality has the largest effect (0.347). This result implies that students expect to acquire relevant information and knowledge anytime and anywhere. Students expect these services to meet their needs, and they would be satisfied with ML services that meet their needs. Students requirements and needs must meet service
requirements, and if students needs are not met, then students cannot be satisfied. Thus, IQ is act as a strong satisfaction signal. This result in hypothesis H1 is consistent with [65], who determined the effect of information quality on user satisfaction with mobile TV.
[image:8.612.92.294.484.609.2]Service quality and compatibility have direct effects on user satisfaction towards continuous usage of ML services (0.290, 0.242, respectively). Results indicated that SQ has a significant effect (0.290) on US. The results indicated that students found the use of ML services useful and reliable for all of their operations and transactions in their education environment. Furthermore, the results show that the student will be satisfied when the quality of service is high towards continuous usage. Hence, the supported result in hypothesis H2 is compatible with previous studies that the SQ influences the US [17], [66]–[68].
Table 4: Results of Hypotheses Testing
*p < 0.10, **p < 0.05, ***p<0.01
Moreover, the results of this study indicated that compatibility (CP) has a significant effect (0.242) on user satisfaction. This result suggests that students in universities are using ML services for their daily activities is capable of retaining the values and needs of future users; the satisfaction of the students in universities would increase. Results also indicated that satisfaction of users of ML services towards its continuous usage relies on the compatibility of that technology to retain the values and their needs. Hence, compatibility of ML services is necessary for the students to determine its continuous usage. moreover, the result of hypothesis H3 confirming the effect of CP on US is in accordance with several previous studies [69], [70]. Hence, our result for H3 is better than some previous works with β=0.242, comparing with [69] who has β=0.24.
The relationship between user satisfaction (US) and continuous usage (CU) of ML services among students in Iraqi universities which is hypothesis
HYP No. Hypothesis Coefficient Path- T-Value P-Value
H1 IQ -> US 0.347 6.127*** <0.01
H2 SQ -> US 0.290 5.424*** <0.01
H3 CP -> US 0.242 5.193*** <0.01
H4 US -> CU 0.549 13.666*** <0.01
0.549(13.666) 0.29(5.424)
0.242(5.193) 0.347(6.127)
CU
US
IQ
SQ
3747 H4 is statistically supported. The results indicated that students of ML shared good experiences with the use of services either in their activities, works, classroom or campus. Moreover, the respondents during the data collection showed enthusiasm in the usage of the ML services as they have confident that the use of ML services would give them prompt output to their request. Besides, the result shows that user satisfaction in the context of this study is the most direct contributing factor for continuous usage of ML services among students in Iraqi universities with β = 0.549. This result in hypothesis H4 is compatible with previous studies that US influences the CU [13], [32], [50], [66], [71]. Consequently, the result of H4 outweighs some of the related study‘s results on the effect of US on the CU, such as [13], [40], [66], [71] with 0.212, 0.234, 0.311and 0.373 respectively.
8. CONCLUSION
Retaining users and facilitating continuance usage are critical to the success of any IS. This study conducted and tests the proposed model of exploring the contributing factors for continuous usage of ML services among students in developing countries, such as Iraq. Therefore, the results of the study suggest that the continuous usage of ML services among students in Iraqi universities can be achieved by considering IQ, SQ, CP, and US. Results indicated that IQ, SQ, and CP affect CU through US; and US affected the CU. Results imply that service providers need to deliver high-quality information, service, and more compatibility to facilitate post-adoption usage of ML services. Indeed, user use of ML services can be increased when the quality of information and service is improved. The implication of this is that information, system, and compatibility which are high quality can greatly encourage the students to continuance usage of ML services.
This study has some limitations. First, this study was conducted in the southern region of Iraq. Whether these results could be generalized to other regions of Iraq, such as the middle and northern regions, needs further research. In addition, ML in Iraq is developing rapidly but is still in its early stage. Thus, results need to be generalized to other countries that have developed ML system. Second, aside from US construct, other factors could affect continuous usage, such as Use, trust, security, and environment of usage. Future research can examine the effects of these factors. Third, this study is
cross-sectional, and user behavior is dynamic. A longitudinal research may provide more insights into user behavior development. This phenomenon is considered new in Iraqi society. Therefore, more studies, whether empirical or theoretical, are needed for comprehensive understanding of factors that impede the continuous usage of ML in the education sector.
REFERENCE:
[1] N. Cavus, “Investigating mobile devices and LMS integration in higher education: Student perspectives,” Procedia Comput. Sci., vol. 3, pp. 1469–1474, 2011.
[2] H. S. Ebrahim, K. Ezzadeen, and A. Alhazmi, “Acquiring Knowledge through Mobile Applications,” Int. J. Interact. Mob. Technol., vol. 9, no. 3, p. 71, 2015.
[3] T. Ramayah, N. H. Ahmad, and M.-C. Lo, “The role of quality factors in intention to continue using an e-learning system in Malaysia,” Procedia - Soc. Behav. Sci., vol. 2, no. 2, pp. 5422–5426, Jan. 2010.
[4] S. Kinash, J. Brand, and T. Mathew, “Challenging mobile learning discourse through research: Student perceptions of Blackboard Mobile Learn and ipads,” Australas. J. Educ. Technol., vol. 28, no. 4, pp. 639–655, 2012.
[5] A. Mekki and Y. Hashim, “Survey Paper: M-Learning A new form for Distance M-Learning,” Int. Res. J. Comput. Sci., vol. 2, no. 3, pp. 2393–9842, 2016.
[6] E. Baran, “A review of research on mobile learning in teacher education,” J. Educ. Technol. Soc., vol. 17, no. 4, pp. 17–32, 2014. [7] N. Vyas and V. Nirban, “Students’ Perception
on the Effectiveness of Mobile Learning in an Institutional Context,” ELT Res. J., vol. 3, no. 1, pp. 26–36, 2014.
[8] M. Hassan, T. Jaber, and Z. Hamdan, “International Conference on Administrative Development: Towards Excellence in Public Sector Performance,” in Adaptive Mobile-
Government Framework, 2009.
[9] M. Faaeq, N. A. Ismail, W. R. S. Osman, A. K. Al-Swidi, and A. K. Faieq, “A meta-analysis of the unified theory of acceptance and use of technology studies among several countries,” Electron. Gov. An Int. J., vol. 10, no. 3/4, pp. 343–360, 2013.
3748 [11] S. Iqbal and I. A. Qureshi, “M-learning
adoption: A perspective from a developing country,” Int. Rev. Res. Open Distrib. Learn., vol. 13, no. 3, 2012.
[12] T. Santhanamery and T. Ramayah, “Continued Usage Intention of E-Filing System in Malaysia: The Role of Optimism Bias,” Procedia - Soc. Behav. Sci., vol. 65, no. ICIBSoS, pp. 397–403, 2012.
[13] S. Hong, J. Y. L. Thong, and K. Y. Tam, “Understanding continued information technology usage behavior: A comparison of three models in the context of mobile internet,” Decis. Support Syst., vol. 42, no. 3, pp. 1819–1834, Dec. 2006.
[14] T. S. H. Teo, S. C. Srivastava, and L. Jiang, “Trust and Electronic Government Success: An Empirical Study,” J. Manag. Inf. Syst., vol. 25, no. 3, pp. 99–132, 2008.
[15] A. Bhattacherjee, “U NDERSTANDING I
NFORMATION S YSTEMS C
ONTINUANCE : A N E XPECTATION -,” MIS Q., vol. 25, no. 3, pp. 351–370, 2001. [16] T.-P. Liang and Y.-H. Yeh, “Effect of use
contexts on the continuous use of mobile services: the case of mobile games,” Pers. Ubiquitous Comput., vol. 15, no. 2, pp. 187– 196, 2011.
[17] S. H. Glood, W. R. S. Osman, and M. M. Nadzir, “The effect of civil conflicts and net benefits on m-government success of developing countries: A case study of Iraq,” J. Theor. Appl. Inf. Technol., vol. 88, no. 3, pp. 541–552, 2016.
[18] A. D. Younus, “Investigation of a Mobile Government a Case Study in Iraq,” Near East University, 2014.
[19] N. S. Alzaza, “MOBILE LEARNING
SERVICES ACCEPTANCE MODEL
AMONG MALAYSIAN HIGHER
EDUCATION STUDENTS,” University Utara Malaysia, 2012.
[20] A. Hunaiyyan, R. A. Alhajri, and S. Al-Sharhan, “Perceptions and challenges of mobile learning in Kuwait,” J. King Saud Univ. - Comput. Inf. Sci., 2016.
[21] M. Z. Alksasbeh, “Integrating Mobile Technology Quality Servive, Trust and Cultural Factors into Technology Acceptance of Mobile Learning: A case of the Jordan Higher Education Institution,” University Utara Malaysia, 2012.
[22] M. Rosli, I. Ismail, M. R. Idrus, and A. Abu Ziden, “Adoption of Mobile Learning Among Distance Education Students in Universiti
Sains Malaysia,” Int. J. Interact. Mob. Technol., vol. 4, no. 2, pp. 24–28, 2010. [23] R. Kaliisa and M. Picard, “A systematic
review on mobile learning in higher education: The African perspective,” Turkish Online J. Educ. Technol., vol. 16, no. 1, pp. 1–18, 2017.
[24] A. G. Hameed, B. S. Shukur, N. J. Al-Khafaji, and H. A. Al-Farhan, “Utilizing mobile applications as a channel of interaction between the citizens and the government: Design M-police in Iraq,” 2014 3rd Int. Conf.
e-Technologies Networks Dev. ICeND 2014,
pp. 1–7, 2014.
[25] A. Laith and S. Nidhal, “personal interview/Interviewer: Salih H. Glood,” Baghdad,Iraq.
[26] N. A. Fadhil, R. W. A. N. S. Osman, I. T. Nather, T. A. L. I. saadi, and N. J. Al-khafaji, “Mobile Technology in the Iraq Context : Design Mobile Application Prototype for the Election of Directors for Departments in the Ministry of Science and,”
in proceeding of 5th SARC-IRF International
Conference, 2014, pp. 97–103.
[27] S. Shareef, J. Arreymbi, H. Jahankhani, and
E. Pimenidis, “MULTI-CHANNEL
DELIVERY OF SERVICES – INITIAL PACE TOWARDS M-GOVERNMENT : THE CASE OF KURDISTAN REGION OF IRAQ,” in Proceeding of Advances in Computing and Technology, (AC&T) The School of Computing and Technology 5th Annual Conference, University of East London, 2010, pp. 54–63.
[28] A. Al Thunibat, N. Zin, and N. Sahari, “Identifying User Requirements of Mobile Government Services in Malaysia Using Focus Group Methodch,” J. E-Government Stud. Best Pract., vol. 2011, pp. 1–14, 2011. [29] W. H. DeLone and E. R. McLean,
“Information Systems Success: The Quest for the Dependent Variable,” Inf. Syst. Res., vol. 3, no. 1, pp. 60–95, Mar. 1992.
[30] R. R. Nelson, P. a Todd, and B. H. Wixom, “Antecedents of Information and System Quality: An Empirical Examination Within the Context of Data Warehousing.,” J. Manag. Inf. Syst., vol. 21, no. 4, pp. 199–235, 2005.
3749 continuous usage intention in web analytics services,” Elsevier- Electron. Commer. Res. Appl., vol. 9, no. 1, pp. 61–72, 2010.
[33] A. Parasuraman, V. Zeithaml, and L. Berry, “Servqual,” J. Retail., vol. 64, no. 1, pp. 12– 40, 1988.
[34] Y. K. Dwivedi, A. Papazafeiropoulou, W.-P. Brinkman, and B. Lal, “Examining the influence of service quality and secondary influence on the behavioural intention to change internet service provider,” Inf. Syst. Front., vol. 12, no. 2, pp. 207–217, Apr. 2010. [35] W. H. DeLone and E. McLean, “The DeLone and McLean model of information systems success: A ten-year updated,” J. Manag. Inf. Syst., vol. 19, no. 4, pp. 9–30, 2003.
[36] W. Cho, S. Kim, B. Han, and W. Son, “Comparison of gene expression profiles in mice liver following intravenous injection of 4 and 100 nm-sized PEG-coated gold nanoparticles,” Elsevier, 2009.
[37] V. McKinney, K. Yoon, and F. “Mariam” Zahedi, “The Measurement of Web-Customer Satisfaction: An Expectation and Disconfirmation Approach,” Inf. Syst. Res., vol. 13, no. 3, pp. 296–315, Sep. 2002. [38] E. Rogers, “Diffusion of Innovations:
Modifications of a Model for Telecommunications,” in Die Diffusion von
Innovationen in der Telekommunikation,
Berlin, Heidelberg: Springer Berlin Heidelberg, 1995, pp. 25–38.
[39] E. Rogers, Diffusion of innovations. New York,551, 2003.
[40] I. Muraina, W. Rozaini, and A. Ahmad, “Investigating the Readiness of Broadband Continuous Usage among Rural Dwellers in the Northern Region of Malaysia,” Int. J. Comput. Commun. Eng., vol. 2, no. 6, pp. 679–683, 2013.
[41] L. L. Hsu, R. S. Q. Lai, and Y. Te Weng, “Understanding the critical factors effect user satisfaction and impact of ERP through innovation of diffusion theory,” Int. J. Technol. Manag., vol. 43, no. 1/2/3, p. 30, 2008.
[42] F. Calisir and F. Calisir, “The relation of interface usability characteristics, perceived usefulness, and perceived ease of use to end-user satisfaction with enterprise resource planning (ERP),” Elsevier-Computers Hum., 2004.
[43] S. Chatterjee, S. Chakraborty, S. S. Sarker, and F. Y. Lau, “Examining the success factors for mobile work in healthcare: A deductive
study,” Decis. Support Syst., vol. 46, no. 3, pp. 620–633, Feb. 2009.
[44] H.-F. Lin, “Determining the relative importance of mobile banking quality factors,” Comput. Stand. Interfaces, vol. 35, no. 2, pp. 195–204, Feb. 2013.
[45] T. Zhou, “An empirical examination of continuance intention of mobile payment services,” Decis. Support Syst., vol. 54, no. 2, pp. 1085–1091, 2013.
[46] N. M. Suki and T. Ramayah, “User Acceptance of the E-Government Services in Malaysia : Structural Equation Modelling Approach,” Interdiscip. J. Information, Knowledge, Manag., vol. 5, 2010.
[47] J. E. Bailey and S. W. Pearson, “Development of a tool for measuring and analyzing computer user satisfaction,” Management science, vol. 29. pp. 530–545, 1983.
[48] C. Lee, H. Cheng, and H. Cheng, “An empirical study of mobile commerce in insurance industry: Task–technology fit and individual differences,” Decis. Support Syst., vol. 43, no. 1, pp. 95–110, Feb. 2007.
[49] M. Igbaria and M. Tan, “The consequences of information technology acceptance on subsequent individual performance,” Inf. Manag., vol. 32, no. 3, pp. 113–121, 1997. [50] I. Muraina, “THE FACTORS THAT
CONTRIBUTE TO THE CONTINUOUS
USAGE OF BROADBAND
TECHNOLOGIES AMONG YOUTH IN RURAL AREAS : A CASE OF NORTHERN REGION OF MALAYSIA ISHOLA DADA MURAINA DOCTOR OF PHILOSOPHY Permission to Use,” UNIVERSITI UTARA MALAYSIA, 2015.
[51] S. Sekaran et al.,
“2-Aminoethoxydiphenylborane is an acute inhibitor of directly photosensitive retinal ganglion cell activity in vitro and in vivo,” J. Neurosci., vol. 27, no. 15, pp. 3981–3986, 2007.
[52] Sekaran and Bougie, RESEARCH METHODS
FOR BUSINESS: A Skill-Building Approach,
Fifth. Cornwall, Great: A John Wiley and Sons, Ltd, Publication, 2011.
[53] Sekaran and R. Bougie, Research Methods for Business. United Kingdom: John Wiley & Sons, 2013.
[54] K. Ranjit, Research Methodology: A Step-By-Step Guide for Beginners, 3rd Editio. London: Sage Publication Limited ed., 2011.
[55] Creswell, Research design: Qualitative,
3750 Third. SAGE Publications, Incorporated., 2009.
[56] Sekaran, RESEARCH METHODS FOR
BUSINESS:A Skill-Building Approach Fourth Edition Uma, Fourth. John Wiley & Sons, Inc., 2003.
[57] J. Nunnally and I. Bernstein, “Psychometric theory,” 1978.
[58] W. W. Chin, “How toWrite Up and Report PLS Analyses,” in Handbook of Partial Least Squares, Springer-Verlag Berlin Heidelberg, 2010, p. 36.
[59] R. R. Bagozzi and Y. Yi, “On the Evaluation of Structural Equation Models I ~ LI,” J. Acad. Mark. Sci., vol. 16, no. 1, pp. 74–75, 1988.
[60] Hair, Black, Babin, Anderson, and Tatham, Multivariate data analysis. Pearson Prentice Hall Upper Saddle River, NJ., 2006.
[61] C. Fornell and D. F. Larcker, “Evaluating Structural Equation Models with Unobservable Variables and Measurement Error,” J. Mark. Res., vol. 18, no. 1, p. 39, Feb. 1981.
[62] Chin, “The partial least squares approach to structural equation modeling,” in MODERN
METHODS FOR BUSINESS RESEARCH,
NEW JERSEY: LEWRNCE ERLBALUM ASSOCIATES, 1998, p. 44.
[63] J. F. Hair, G. T. Hult, C. M. Ringle, and M. Sarstedt, Partial Least Squares Structural
Equation Modeling (PLS-SEM). London:
SAGE Publications, Inc., 2014.
[64] J. Henseler and M. Sarstedt, “Goodness-of-fit indices for partial least squares path modeling,” Comput. Stat., vol. 28, no. 2, pp. 565–580, 2013.
[65] Y. Jung, B. Perez-Mira, and B. Wiley-Patton, “Consumer adoption of mobile TV: Examining psychological flow and media content,” Elsevier-Computers Hum., vol. 25, no. 1, pp. 123–129, 2009.
[66] M. Limayem and C. M. K. Cheung, “Understanding information systems continuance: The case of Internet-based learning technologies,” Inf. Manag., vol. 45, no. 4, pp. 227–232, 2008.
[67] A. M. Aladwani, “Organizational actions, computer attitudes, and end-user satisfaction in public organizations: An empirical study,” J. Organ. End User Comput., vol. 14, no. 1, pp. 42–49, 2002.
[68] A. Leclercq, “The perceptual evaluation of information systems using the construct of user satisfaction: case study of a large French
group,” ACM Sigmis Database, vol. 38, no. 2, pp. 27–60, 2007.
[69] Islam, Hoda, and Hesham, “Assessing call centers’ success: A validation of the DeLone and Mclean model for information system,” Egypt. Informatics J., vol. 14, no. 2, pp. 99– 108, Jul. 2013.
[70] J. Lai and C. Chang, “User attitudes toward dedicated e-book readers for reading: The effects of convenience, compatibility and media richness,” Online Inf. Rev., vol. 35, no. 4, pp. 558–580, 2011.
3751 Appendix A: The Survey Items
1.0 – Information Quality Degree of Agreement Sources
1. Through MLS, I get the information I need in time. 1 2 3 4 5 (Chen & Cheng, 2009; Chen, Jubilado, Capistrano & Yen, 2015; Delone & McLean ,2003; Teo, Srivastava & Lijiang, 2009 )
2. Information provided by MLS meet my needs. 1 2 3 4 5 3. Information provided by MLS are in a useful format. 1 2 3 4 5
4. Information provided by MLS are clear. 1 2 3 4 5
5. Information provided by MLS are easy to understand. 1 2 3 4 5 6. I am satisfied with the accuracy of information by MLS. 1 2 3 4 5
7. MLS provide me accurate information. 1 2 3 4 5 8. MLS provide the most current information. 1 2 3 4 5 9. MLS provide me with up-to-date information. 1 2 3 4 5
10. Overall, the MLS provide me with high-quality information. 1 2 3 4 5 2.0– Service Quality
11. When I have a problem, the MLS show a sincere interest in solving it.
1 2 3 4 5 (Alshibly, 2014; Chen & Cheng, 2009; Chen et al., 2015; Delone & McLean, 2003; Teo et al., 2009; Chien, 2004; Zhou, 2013)
12. MLS provide on-time services it promises. 1 2 3 4 5
13. MLS are dependable. 1 2 3 4 5
14. MLS provide prompt responses 1 2 3 4 5 15. MLS are responsive to farmer’s request. 1 2 3 4 5
16. MLS respond quickly to my needs. 1 2 3 4 5
17. The behaviour of MLS helpdesk instils confidence in me. 1 2 3 4 5 18. MLS provide professional services. 1 2 3 4 5
19. MLS helpdesk have the knowledge to do their job well. 1 2 3 4 5
20. I feel safe when I use the MLS. 1 2 3 4 5 21. MLS helpdesk give me individual attention. 1 2 3 4 5
22. The MLS helpdesk have my best interest at heart. 1 2 3 4 5 23. The MLS helpdesk understands my needs. 1 2 3 4 5 24. Overall, I rate the quality of service provided by MLS highly. 1 2 3 4 5
3.0 – Compatibility
25. Using MLS are compatible with my needs. 1 2 3 4 5 (Bhattacherjee, 2001; Murdina, 2014) 26. My experience with using MLS was better than what I expected. 1 2 3 4 5
27. The service level provided by MLS was better than what I expected.
1 2 3 4 5
28. Overall, most of my expectations from using MLS were confirmed.
1 2 3 4 5
4.0 – User Satisfaction
29. I feel satisfied with using MLS. 1 2 3 4 5 (Alshibly, 2014; Delone & McLean, 2003)
30. I feel contented with using MLS. 1 2 3 4 5 31. I feel pleased with using MLS. 1 2 3 4 5 32. I feel delighted with using MLS. 1 2 3 4 5 33. MLS have met my expectations. 1 2 3 4 5
5.0– Continue to use
34. I intend to continue to use MLS in the future. 1 2 3 4 5 (Bhattacherjee, 2001; Ham et al., 2012; Iqbal & Qureshi, 2012)
35. I am willing to communicate with the MLS’s other members. 1 2 3 4 5
3752 Appendix B: Questionnaire English Version
UNIVERSITY OF AL-MUTHANNA COLLEGE OF SCIENCES
QUESTIONNAIRE
Research Title: " THE EFFECTS OF INFORMATION QUALITY, SERVICE QUALITY, AND COMPATIBILITY ON CONTINUE USE OF M-LEARNING AMONG STUDENTS IN THE PUBLIC UNIVERSITIES OF IRAQI"
Dear Respondents,
I am a lecturer doctor from the College Of Sciences, University of Al-Muthanna. This questionnaire is designed to find out factors for measuring Continue Use of M-Learning services among students in Iraqi Universities.
Part of my work is to conduct a survey on the current state of using mobile learning among students in Iraqi Universities. I hereby would like to invite you to participate in this survey by completing the attached questionnaire.
The success of this study highly depends on your kind cooperation. This study is only for academic purpose and not for other use. All of the answers provided will be kept strictly confidential. The questionnaire is designed to take minimum of your valuable time.
Your participation and contribution are highly appreciated
Best regards, Dr. Salih Hajem Glood
College of Sciences, Al-Muthanna University, Samawa, Iraq Date: ________.
Researcher e-mail address: [email protected] Phone Number: 07811247671
This questionnaire consists of three sections. Section A consists of the questions regarding your demographic profile. Section B consists of some statements about The Factors that Affect M-learning Services in Iraqi Universities. Section C includes Two (2) open ended questions if you like to add some comments.
We would like to collect some information about yourself so that we can understand better your decisions related to the m-learning services (Please tick ()the appropriate box).
1. Your Gender: Male. Female.
2. Your Age: 21-24. 25 -28. ≤ 29.
3. What type of mobile device(s) do you own? Hand Phone. Laptop. Smart phone. Others
Section A: Personal Information
3753 4. Experience using mobile devices: Advance. Normal.
5. How many Time Using m-learning services: Daily Weekly Monthly Others
Section B: The Factors that Affect M-learning Services in Iraqi University
We would like to understand your opinions about the factors that are affecting Utilization, User Satisfaction and Net Benefits of M-leaning services in KSAU (Please circle the appropriate number based on a 5-point scale where 1= Strongly Disagree; 2= Disagree; 3= Neutral; 4= Agree; 5= Strongly Agree).
Please follow the numbers which denote the following answers to circle one answer for each question.
Strongly Disagree Disagree Neutral Agree Strongly Agree
1 2 3 4 5
Please follow the numbers which denote the following answers to circle one answer for each question.
Strongly Disagree Disagree Neutral Agree Strongly Agree
1 2 3 4 5
2.0– Service Quality Degree of Agreement
50. When I have a problem, the MLS show a sincere interest in solving it. 1 2 3 4 5
51. MLS provide on-time services it promises. 1 2 3 4 5
52. MLS are dependable. 1 2 3 4 5
53. MLS provide prompt responses 1 2 3 4 5
54. MLS are responsive to farmer’s request. 1 2 3 4 5 55. MLS respond quickly to my needs. 1 2 3 4 5
56. The behaviour of MLS helpdesk instils confidence in me. 1 2 3 4 5
57. MLS provide professional services. 1 2 3 4 5 58. MLS helpdesk have the knowledge to do their job well. 1 2 3 4 5
59. I feel safe when I use the MLS. 1 2 3 4 5 60. MLS helpdesk give me individual attention. 1 2 3 4 5 61. The MLS helpdesk have my best interest at heart. 1 2 3 4 5
62. The MLS helpdesk understands my needs. 1 2 3 4 5 63. Overall, I rate the quality of service provided by MLS highly. 1 2 3 4 5
Please follow the numbers which denote the following answers to circle one answer for each question.
Strongly Disagree Disagree Neutral Agree Strongly Agree
1 2 3 4 5
3.0 –Compatibility Degree of Agreement
64. Using MLS are compatible with my needs. 1 2 3 4 5 65. My experience with using MLS was better than what I expected. 1 2 3 4 5
1.0 –Information Quality Degree of Agreement
40. Through MLS, I get the information I need in time. 1 2 3 4 5
41. Information provided by MLS meet my needs. 1 2 3 4 5
42. Information provided by MLS are in a useful format. 1 2 3 4 5 43. Information provided by MLS are clear. 1 2 3 4 5
44. Information provided by MLS are easy to understand. 1 2 3 4 5
45. I am satisfied with the accuracy of information by MLS. 1 2 3 4 5 46. MLS provide me accurate information. 1 2 3 4 5
47. MLS provide the most current information. 1 2 3 4 5
3754
66. The service level provided by MLS was better than what I expected. 1 2 3 4 5
67. Overall, most of my expectations from using MLS were confirmed. 1 2 3 4 5
Please follow the numbers which denote the following answers to circle one answer for each question.
Strongly Disagree Disagree Neutral Agree Strongly Agree
1 2 3 4 5
4.0 – User Satisfaction Degree of Agreement
68. I feel satisfied with using MLS. 1 2 3 4 5
69. I feel contented with using MLS. 1 2 3 4 5 70. I feel pleased with using MLS. 1 2 3 4 5 71. I feel delighted with using MLS. 1 2 3 4 5
72. MLS have met my expectations. 1 2 3 4 5
Please follow the numbers which denote the following answers to circle one answer for each question.
Strongly Disagree Disagree Neutral Agree Strongly Agree
1 2 3 4 5
5.0– Continue to use Degree of Agreement
73. I intend to continue to use MLS in the future. 1 2 3 4 5
74. I am willing to communicate with the MLS’s other members. 1 2 3 4 5 75. I expect to obtain needed information by using MLS in the future. 1 2 3 4 5 76. I believe it is worthwhile for me to return to use the MLS. 1 2 3 4 5
77. I intend to use MLS frequently in the future. 78. I will prefer MLS over other mediums of learning.
We would like to seek your general comments and advices regarding the reasons and barriers that affect for reducing to use m-learning among students in Iraqi Universities.
1.0 Why you did not use the m-learning?
……… ……… ………..
2.0 Please, use this space to write any suggestions regarding m-learning.
……… ……… ………
Your time and cooperation are highly valued Thank you.
3755
Appendix C: Test of Non-Response Bias (Chi-Square Test of Independence)
early respondents later respondents Chi-Square (X2) P-value
Gender Male 83 (33.5%) 14 (27%)
1.182 0.277
Female 165 (66.5%) 38 (73%)
Age 21-24 161 (65%) 28 (53.9%)
2.530 0.282
25-28 82 (33%) 22 (42.3%)
>=29 5 (2%) 2 (3.8%)
Mobile_Device hand phone 14 (5.6%) 3 (5.8%)
0.984 0.805
laptop 48 (19.4%) 12 (23.1%)
smart phone 161 (64.9%) 33 (63.4%)
others 25 (10.1%) 4 (7.7%)
Experience advance 163 (65.7%) 37 (71.1%)
0.5 0.480
normal 85 (34.3%) 15 (28.9%)
Times_Of_Using daily 48 (19.4%) 10 (19.2%)
1.752 0.625
weekly 82 (33.1%) 14 (27%)
monthly 44 (17.7%) 9 (17.3%)
others 74 (29.8%) 19 (36.5%)
Appendix D: Participant’s Demographic Information
Demographic Variable Category Frequency (N = 300) Percentage %
Gender Male 97 32.3
Female 203 67.7
Age 21-24 189 63
25 -28 104 34.7
29 or above 7 2.3
Mobile-Device Hand phone 17 5.7
Laptop 60 20
Smart phone 194 64.7
others 29 9.6
Experience Advance 200 66.7
Normal 100 33.3
Time-of-Using Daily 58 19.3
Weekly 96 32
Monthly 53 17.7