http://dx.doi.org/10.4236/epe.2015.78031
Cost Optimization of Hybrid Solar,
Micro-Hydro and Hydrogen Fuel
Cell Using Homer Software
Nader Barsoum, Pearl Dianne Petrus
Department of Electrical and Electronics Engineering, Faculty of Engineering, Universiti Malaysia Sabah, Kota Kinabalu, Malaysia
Email: [email protected], [email protected]
Received 6 July 2015; accepted 4 August 2015; published 7 August 2015
Copyright © 2015 by authors and Scientific Research Publishing Inc.
This work is licensed under the Creative Commons Attribution International License (CC BY). http://creativecommons.org/licenses/by/4.0/
Abstract
The main purpose of this paper is to present the analysis of cost optimization of Hybrid Renewable Energy System in remote area where grid connection is impossible. The analysis of hybrid system is modeled using HOMER software. Homer software is utilized as an assessment with modeling tools that simplifies the task of evaluating designs option for both off-grid and on-grid-connected system that allows load data and parameters to be inputted. In this paper, HOMER is used to find the most cost effective configuration among set of different simulated system to achieve the objec-tive of least possible Levelized Cost of Energy (LCOE) for a given system under a propose load of 75 kW.
Keywords
Cost, Optimization, LCOE, HOMER
1. Introduction
As a contrast to this matter, renewable energy sources that are generally abundance in availability and great technologies can provide sustainable and cost effective alternative source [2]. As a matter of fact, Malaysia has tremendous amount of renewable sources that can be developed [3]. With that, stand-alone renewable energy system is the system that is capable of supplying electricity to isolated area. However, feed in tariff and capital cost for hybrid energy system is high and unrealistic [4]. Therefore, the main purpose of this paper is to perform evaluations to obtain the most optimized cost with given configuration.
There are many factors that contribute to a poor distribution of electricity such as terrains, isolation of an area but the most ultimate reason is the economic investment scheme that is high in cost of installment over a long distance of grid [5]. Therefore, optimal configuration of hybrid renewable energy system is useful to ensure enough power is generated to meet the demand in parallel with reliable and cost effective reason.
The result is an economic optimization which includes capital cost expenditure, maintenance cost and re-placement of components. The cost is not dependent on the system sizing such as the initial cost but also to-wards the control strategy [6]. Both technical and economic analyses are involved in this paper. Technical anal-ysis involved the study of location’s metrology and load characteristics based on design. Whereas, the economic analysis is done using HOMER software (Hybrid Optimization Model for Electric Renewable). This paper focus on simulation of a stand-alone modeled in HOMER to achieve cost optimization of hybrid solar, micro-hydro and hydrogen fuel cell system.
The economic feasibility of an energy generation can be evaluated using various methods but one of it is the measure of using Levelized Cost of Energy that is often used when comparing electricity generation technolo-gies [7] [8]. Measuring the economic cost of electricity helps to discover the overall competiveness of different source of energies. It is represented in cost per kilowatt-hour of an operating system over its life time cost [9]. The key input for measuring the Levelized Cost of Energy (LCOE) includes capital cost, fuel cost, operation and maintenance cost (O & M) as well as financing cost [10].
2. Modelling the Hybrid System in Homer
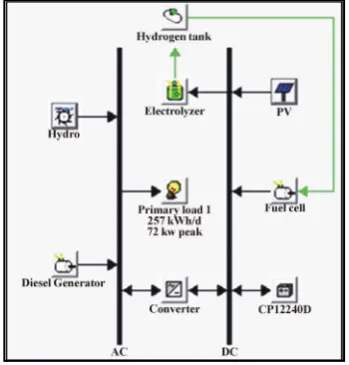
The configuration of the hybrid system is shown in Figure 1. This system is an off-grid that deals with the com-bination of PV, hydro, diesel generator, converter, batteries, fuel cell, electrolyser and hydrogen tank that are modeled in HOMER software. This system is used in rural area and is useful to implement in villages that are sunny and have downstream river.
[image:2.595.226.401.524.707.2]PV, fuel cell, electrolyser and batteries are connected via DC bus. Hydro system and diesel generator are connected via AC bus. Converter is connected in between both AC and DC buses. AC output is connected to the load. Solar PV and hydro system are two sources of renewable energy that are being used in this paper. Solar PV generates electricity during the day while hydro system generates electricity during day and night. Diesel gene-rator, batteries CP12240D and fuel cell act as a back-up power for this hybrid system to ensure continuous power flow during any times of failure or power cut. Any excess energy produced will be stored in fuel cell. Batteries
store energy for the used at night time or in times of solar panels is not producing enough energy that is needed. Diesel generator is an optional back-up generator that provides power to re-charge the batteries during times of high energy demand or any poor weather to be experienced. Diesel generator functioned based on fossil fuel as back up unit whenever solar PV and hydro system is not able to cater the demand and thus providing continuous supply at the same time reducing the fuel consumption.
Converter is included in this model as a device to convert electric power from DC to AC to supply the load. Hydrogen system is a composed of PEM fuel cell, electrolyser and hydrogen tank. Electrolyser produces hydro-gen when the electricity demand is higher than the requested load power. Hydrohydro-gen is stored in hydrohydro-gen tank until it is used and will be utilized in times of needed. Excess energy from hydro system is used for hydrogen production. Electrolyser operates in DC power; thus a rectifier is used to convert AC power produced by hydro system to DC power output. Converter should be of high power to allow any conversion.
3. Flow Chart of Hybrid System
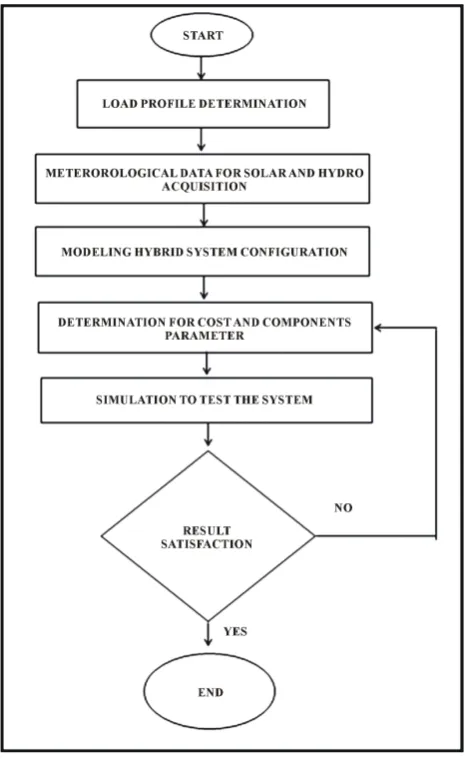
[image:3.595.197.430.329.711.2]Steps of the proposed hybrid system in HOMER software is summarized in Figure 2. The steps start with de-termining load profile of targeted remote area followed by meteorological data acquisition for sola irradiances and hydro flow rates. Thereafter, the formation of components to model the hybrid system configuration can be done. Determination of economic parameters and sizing of each component are inputted respectively. Simula-tion is done to perform the cost optimizaSimula-tion evaluaSimula-tion to the constructed model. Result satisfactory is achieved through evaluation of Levelised Cost of Energy (LCOE) presented over all simulated results to determine
whether the choice of selected result fulfills the objective of this work. HOMER ranked its result based on the least cost combination. The most optimized result by mean is the most optimal solution which is at the lowest cost of Net Present Value (NPC).
4. Data Resources and Parameters
4.1. Meteorological Data
Meteorological data plays an important role and is required prior to modeling a system. It is therefore needed to be able to forecast and estimate whether the mount of renewable resource is capable to provide a supportive system.
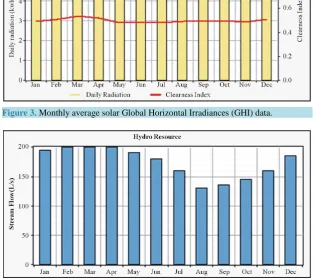
Solar system requires data of solar resources. It is essential to determine the amount of sunlight available and strike through a particular chosen location at a given time. Same applied to the availability of water resources where hydro system is to be implemented. Figure 3 and Figure 4 show the monthly average data of solar irra-diances and hydro flow rates respectively. The scaled annual average for this location is 4.953 kW⋅h/m2/day and the amount of clearness index is shown at 0.497. As for hydro flow rates, the scaled average flow is at 173.2 L/s [3].
4.2. Load Profile Determination
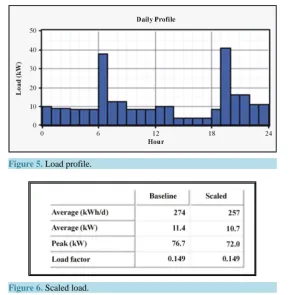
[image:4.595.159.468.375.534.2]Load profile is the load input that describes the electric demand that the system serve in that targeted location. In order to aggregate the user’s power demand, energy demand management concept and corrector factor are used. Energy produced is calculated in kW⋅h in relation to the tariff by means the energy daily allowance. Real daily energy demand is energy that is scaled down by a demand factor to optimize the size of hybrid system thus ful-filling user’s needs. Daily load profile cumulated by HOMER software is given in Figure 5. Figure 6 is the
[image:4.595.156.471.428.707.2]Figure 3. Monthly average solar Global Horizontal Irradiances (GHI) data.
Figure 5. Load profile.
Figure 6. Scaled load.
scaled load simulated in HOMER software. It can be seen that the proposed peak load required is scaled to 72 kW and average scaled load is 257 kW⋅h/d.
5. Solar PV, Battery and Hydro System Calculation
In order to build up a stand-alone system, it is substantial to have determined for meteorological and topography data in order to know whether the physical natural of that area is able to support the system as a prerequisite condition. To model a PV system, the average solar radiation ASR and average clearness index ACI are taken into consideration where ASR is 4.953 kW⋅h/m2/day and ACI is 0.497. PV panel that is selected for this work is SUN-50 where its maximum power output is 50 W.
5.1. Photovoltaic Calculation
Surface area for 1 PV module:2 0.676 m 0.596 m 0.403 m
A= ×L W = × = (1)
Power produced by 1 m2 of PV module:
2 max 50 2
m
0.403 124.07 W m p
P
A =
= = (2)
Efficiency of PV, η:
2
1 m 124.07
100% 100% 12.4%
1000 p
STC
η= × = × = (3)
Energy of PV, Epv:
2 4.953 0.497 12.4% 0.31 kW h m day
pv ASR ACI
E = × × =
η
× × = ⋅ (4)0.31 0.403 0.1230 kWh day
pv
E=E × =A × = (5)
Number of panels needed:
/ day 10 kW
0.1230 81.29 81 panels
pv
p N
E =
= = = (6)
Number of panels calculated to suit 10kW of power is 81 panels. Calculations of panels are measured under the Standard Conditions STC of 1000 W/m2 at normal operating temperature of 25˚C.
5.2. Battery Calculation
energy demand autonomous days
Depth of discharge system volta Battery stora
ge
10 kW 3
0. ge ca 8 24 pacity 156.25 A 0 h × × × = = × = ⋅ (7)
Battery storage capacity
Nominal capacity of the battery
156.25 A Number o
h f batteries
6.5 7Batteries 2 A h
⋅ ≈ = = ⋅ = (8)
The chosen battery is CP12240D. By considering the nominal capacity of battery that is 24 A⋅h, the number of batteries calculated to support 10 kW of load is 7 batteries.
5.3. Hydro System Calculation
Net head determination:hydro net
hydro water turbine
1000 w kW 40 kW 1000 w kW
75% 1000 9.8 173 31.4 m p
h
p g Q
η
× ×
=
× × × × × × =
= (9)
The total Net head calculated for this system is 31.4 m considering the nominal power output of hydro system that is set to 40 kW. Efficiency of hydro system is set to 75%, density of water is 1000 kg/m2, gravitational at 9.8 m/s2 and hydro turbine average flow rate at 173 m3/s.
6. Analysis and Simulated Result
From previous calculation and selection of parameters that have been done, model is constructed in HOMER software to perform simulation in order to achieve cost optimization process. HOMER performs hourly simula-tion to ensure the best possible matching between supply and demand in order to obtain the most optimum sys-tem. To observe any impact of changes that is affecting the system, parameters such as solar radiation variation, PV investment cost variation, water flow rate and diesel fuel price variation can be done in sensitivity analysis. HOMER simulates all possible outcome of system by making energy balance calculation. At the end of the si-mulation result, HOMER decides for best optimum result with combination of power sources and will be ranked from top to bottom with most optimum to least optimum. However for this paper, result are chosen according to total demand that have been decided that is 10 kW of solar PV, 40 kW of micro-hydro system, 20 kW of diesel generator and 5 kW comes from fuel cell. In simulation process, HOMER automatically calculates for total Net Present Cost (NPC), Levelized Cost of Energy (LCOE) and operating cost.
6.1. System Architectural
Table 1. System architecture.
Component size Capital cost ($)/kW Replacement cost ($) O&M cost ($/yr) Lifetime
PV 10 kW 396.9 0 0 25 years
Micro-hydro 40 kW 300 6000 780 30 years
Diesel Generator 20 kW 327 0 0.015 25,000 hrs
Fuel cell 5 kW 3000 2500 0.02 15,000 hrs
Electrolyzer 5 kW 1500 1200 20 25 years
Hydrogen tank 5 kW 1300 1200 0 25 years
Converter 10 kW 800 750 0 15 years
years of lifetime. Operational and maintenance cost is set to $ 0 due to PV panel need less maintenance. Capital cost for each of every component is based on its own size.
6.2. Economics Input
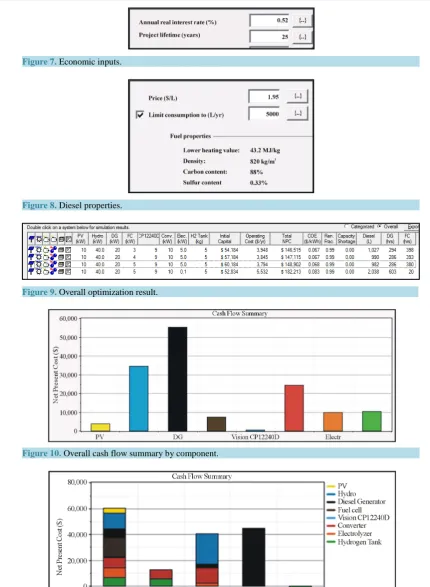
Figure 7 shows the economics constraint for this hybrid system. The lifetime is set to 25 years. The annual real interest rate is based on calculation that is shown in (10);
1 i f i f ′ − =
+ (10)
where
i = annual interest rate, f = annual inflation rate, i' = nominal interest rate,
3.35 1.8 0.52. 1 1.8
i= − =
+
Annual interest rate is calculated as 0.52 where the nominal interest rate is at 3.25 and annual inflation rate is 1.8 in accordance to Malaysia economics value. Figure 8 shows the properties of diesel price. Price of diesel is ranked at 1.95 ($/L) that is also according to the price of selling per liter of diesel in Malaysia.
6.3. Simulation of Cost Optimization
Figure 9 is the overall result of cost optimization that is ranked from top to bottom. As for this work, result are on line 3 with 10 kW of PV, 40 kW of micro-hydro, 20 kW of diesel generator and 5 kW of fuel cell are chosen. The running cost LCOE shows 0.068 $/kW⋅h = 6.8 cents/kW⋅h.
As for Figure 10 and Figure 11 are the cash flow summary by component and by cost type respectively. As can be senn in Figure 10, cost for Diesel generator ranked the highest value. In accordance to by cost type on Figure 11, PV panels ranked the highes which capital cost is at $ 60,184. Overall fuel calculated for this system is at $ 44,772.
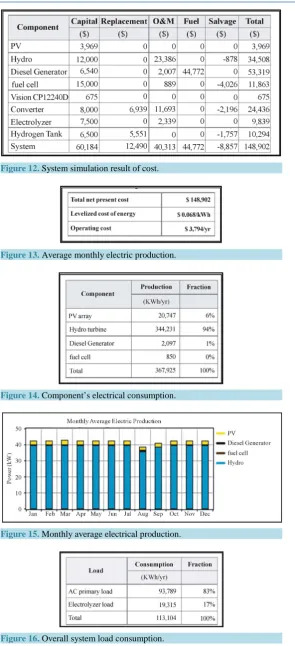
Figure 12 and Figure 13 are the overall detailed cash flow simulated for this system. The total Net Present Cost and Levelized Cost of Energy for this system is calculated at $ 148902.00 and $ 0.068 kW⋅h respectively. Operating cost for this system is at $ 3794/yr. Simulation result consists of cost for each component that is bro-ken down into capital cost, replacement cost, operation and maintenance cost, fuel cost and salvage value. The salvage value that shows a negative sign indicate that there is no return after end of project lifetime.
Figure 14 and Figure 15 show overall system load consumption. The annual production of PV module is at 20,747 kW⋅h/yr, hydro system is at 344,231 kW⋅h/yr, diesel generator is at 2097 kW⋅h/yr and fuel cell is at 850 kW⋅h/yr and the total is up to 367,925 kW⋅h/yr of production.
Figure 7. Economic inputs.
Figure 8. Diesel properties.
[image:8.595.91.522.78.666.2]Figure 9. Overall optimization result.
[image:8.595.138.509.546.706.2]Figure 10. Overall cash flow summary by component.
Figure 12. System simulation result of cost.
[image:9.595.171.467.76.724.2]Figure 13. Average monthly electric production.
Figure 14. Component’s electrical consumption.
Figure 15. Monthly average electrical production.
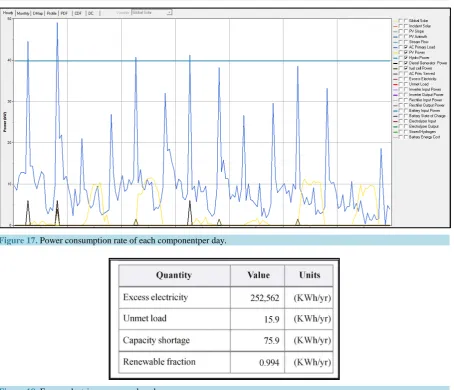
[image:9.595.170.457.379.709.2]Figure 17. Power consumption rate of each componentper day.
Figure 18. Excess electric energy produced.
generator and hydrogen fuel cell system. It shows that micro-hydro can cover most of the power demand in 24 hrs, while solar, diesel and fuel cell can cover a bit of loads.
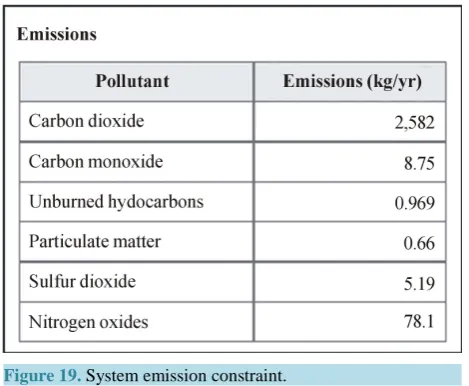
Figure 18 shows the value for excess energy produced, any unmet load and capacity shortage for this system excess is the sum of waste of energy that is not consumed by any load. Figure 19 is the emission data that pro-duced by this system.
7. Conclusion
Figure 19. System emission constraint.
Levelized Cost of Energy has met the target of this work. The increased cost in operation and maintenance cost may result in high rates of Levelized Cost of Energy (LCOE). Expanding the lifetime of a system may decrease the rate of cost per energy. Apart from that, from the economic point of view, high annual inflation rate may in-crease the annual interest rate which will result in the inin-crease of cost as well.
References
[1] Kverndokk, S. (1994) Depletion of Fossil Fuels and the Impacts of Global Warming. 3.
[2] Flavin, C., Gonzalez, M., Majano, A.M., Ochs, A., da Rocha, M. and Tagwerker, P. (2014) Study on Development of Renewable Energy Market in Latin America and the Caribean. 48.
[3] Azman, A.Y., Rahman, A.A. and Jamri, M.S. (2013) Study of Renewable Energy Potential in Malaysia. International Journal of Renewable Energy Resources, 1-7.
[4] Lau, C.Y., Gan, C.K. and Tan, P.H. (2014) Evaluation of Solar Photovoltaic Levelized Cost of Energy for PV Grid Parity Analysis in Malaysia. International Journal of Renewable Energy Resources, 28-34.
[5] Ayodele, T.R. (2014) Feasibility Study of Stand-Alone Hybrid Energy System, for Rural Electrification in Nigeria: The Case Study of Ala-Ajagbusi Community. International Journal of Renewable Energy Resources, 1-12.
[6] Barsoum, N.N., Yong, H.H., Chang, H.M.A. and Goh, W.C. Modeling and Cost Effective Simulation of Stand-Alone Solarand Micro-Hydro Energy. Proceeding of PSACO 2008 Conference, Vishakhapatnam, 13-15 March, 809-814.
[7] Branker, K., Pathak, M.J.M. and Pearce, J.M. (2011) A Review of Solar Photovoltaic Levelized Cost of Electricity. Renewable and Sustainable Energy Review, 4470-4482. http://dx.doi.org/10.1016/j.rser.2011.07.104
[8] Short, W., Packe, D. and Holt, T. (1995) A Manual for Economic Evaluation of Energy Efficiency and Renewable Energy Technologies. National Renewable Energy Laboratory, 1-120.
[9] Darling, S.B., You, F.Q., Veselka, T. and Velosa, A. (2011) Assumption and the Levelized Cost of Energy for Photo-voltaics. Energy & Environmental Science, 4, 3133-3138. http://dx.doi.org/10.1039/c0ee00698j