Image Contrast Enhancement using Atrous Wavelet
Transform and Singular Value Decomposition (SVD)
S. Sulochana
Research Scholar Institute of Remote Sensing
Anna University,Chennai
R. Vidhya
Associate Professor Institute of Remote Sensing
Anna University,Chennai
ABSTRACT
In this paper, a new satellite image contrast enhancement technique based on s Atrous wavelet transform and singular value decomposition (SVD) has been proposed. To obtain shift invariant discrete wavelet transform decomposition for images, we introduced the discrete wavelet transform known a “A trous” algorithm to decompose the image into wavelet planes which is computed as the difference between two consecutive approximations and calculate the singular value matrix of the residual image. The enhanced image is obtained by applying inverse transforms. These techniques are compared with conventional image equalization techniques such as general histogram equalization and discrete wavelet transform. Quality metrics were used to evaluate the superiority of the proposed method.
Keywords
Generalised Histogram Equalization(GHE), Singlar value decomposition(SVD), Discrete Wavelet transform(DWT), Atrous wavelet Transform(AWT)
1.
INTRODUCTION
Satellite images are used in many areas of remote sensing. The quality of the displayed is influenced by many factor .One of the most important factor is contrast which is created by the difference in luminance reflected from two adjacent surfaces. The contrast of an image is highly concentrated on a specific range; the information may be lost in those areas which are excessively and uniformly concentrated. The problem is to optimize the contrast of an image in order to represent all the information in the input image. A histogram can also describe the amount of contrast .Broad histograms reflect a scene with significant contrast, whereas narrow histograms reflect less contrast and may appear flat.
General histogram equalization (GHE)[1] is a simple method for contrast enhancement which consists of generating an output image with a uniform histogram .In image processing the idea of equalizing a histogram is to stretch the original histogram using entire range of discrete levels of the image .GHE is a commonly used for image contrast enhancement since it is computationally fast and simple to implement. One of the disadvantages of GHE is that the information laid on the histogram or probability distribution function is lost. In previous singular vale equalization(SVE) [2]technique is based on the singular value decomposition (SVD) [3] which is applied on image A of size P×Q such that
T A A
A
V
U
A
(1)
Here
V
AT is a P×Q orthogonal matrix whose columns are the Eigen vectors ofAA
T andV
A is a Q×Q orthogonal matrix whose columns are the Eigen vectors ofAA
T and ∑ is a Q×Q diagonal matrix with non-negative diagonal element in decreasing order of magnitudes whose entries are the square roots of the corresponding Eigen values ofAA
T.In this case SVD is used to deal with the illumination problem. The SVD of this new image is calculated and the maximum singularmax(
A
)
is used to calculate the transformation factor ξ as the ratio of the largest singular value of the generated matrix over maximum value of the image.
)
max(
)
max(
A
A
(2) Now new singular value matrix
A
A .A
can be referred as singular value matrix of the equalizedimage. Using this equalized matrix, a new image
A
can be calculated
A
U
A
AV
AT(3) The intensity of the image has been equalized by equalizing
2. ATROUS WAVELET TRANSFORM
Wavelet decomposition is used for image processing very much. Wavelet transform produce the images in different resolution. Wavelet representation refers to both spatial and frequency space. There are different approaches to do wavelet decomposition. One of them is Mallat algorithm which can use wavelet function such as “Daubechies functions (db1, db2 ,…)”which is not shift-invariant, this lead to a problem in signal analysis, pattern recognition etc…To obtain a shift-invariant discrete wavelet decomposition for images, we use the discrete wavelet transform known as “`a trous” (“with holes”)[8]10] algorithm decompose the image into wavelet planes. Given an image I we construct the sequence of approximations
1 1
(
I
)
I
F
,F
2(
I
1)
I
2 ,F
3(
I
2)
I
3… (4)In this algorithm for the discrete wavelet transform we must do the successive convolution with a filter. The wavelet planes are computed as the differences between two consecutive approximations
1
l
I
andl
I
.Lettingl
I
l
I
l
W
1
(
l
1
...
..
n
)
in whichI
0
I
.We can write the reconstruction formula
I
r
n
l
l
W
I
1
(5) In this representation, the imagesl
I
(
l
0
,...,
n
)
are versions of the original image I at increasing scales (decreasing resolution levels),l
W
(
l
0
,...,
n
)
are thewavelet planes, and
I
r
is a residual image.3.
PROPOSED
IMAGE
CONTRAST
ENHANCEMENT
Our proposed method has two important parts. The first one is singular value matrix by obtained by SVD contains the illumination information. Therefore, changing the singular values will directly affect the illumination of the image; hence the other information in the image will not be changed. The second part is the application of shift invariant wavelet transforms. In Atrous wavelet transform the illumination information is embedded in the residual of the image .The edges are concentrated in the wavelet planes. Hence separating the high frequency subbands and applying the illumination enhancement to the residual image in Atrous wavelet transform will protect the edge information from possible degradation. After reconstructing the final through inverse Wavelet transforms, the resultant image is not only enhanced with respect to illumination and also sharper edges.
ALGORITHM
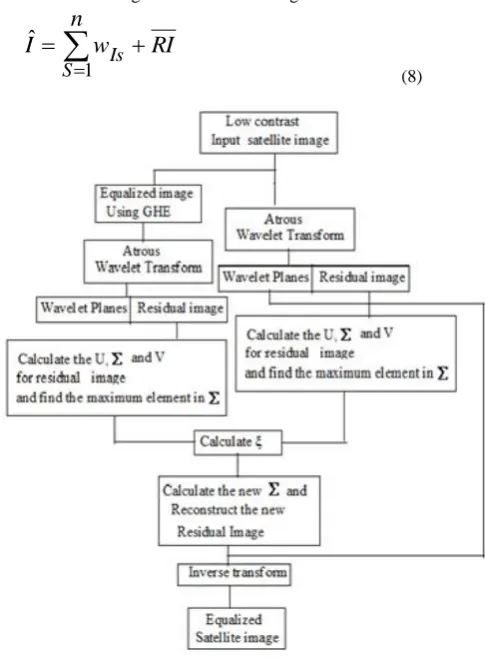
1. The input image I is first processed by using General histogram equalization (GHE) ,the resultant image is Ī. 2. (I & Ī) both images are transformed by Atrous wavelet transform into wavelet planes residual images.
....
2 , 1 I
I
w
w
and,
....
2
1
I
I
w
w
are the wavelet planes of inputimage(I) and general Histogram Equalized image(Ī).
RI
andI
R
are the residual images of I and Ī 3.The correction coefficient for the singular value matrix is calculated by using the following equation
)
max(
)
max(
RI
I
R
(6) WhereI
R
the singular is value matrix of the residualimage of Ī and
RI
is the singular value matrix of the residual image of I.4. The new singular value matrix of residual image and new residual image is composed by
RI
RI RI RIV
U
RI
(7) 5.The wavelet planes are recombined by applying inverse
atrous wavelet transform to generate the enhanced image
I
ˆ
.The flow of the algorithm is shown in fig.1
RI
n
w
I
S Is
1ˆ
(8) [image:2.595.321.564.352.682.2]4. EXPERIMENTAL RESULTS
Our proposed algorithm is implemented in Matlab 7.0. In this proposed algorithm Atrous wavelet transform we must do the successive convolution with a filter given below.
0.0039 0.0156 0.0234 0.0156 0.0039
0.0156 0.0625 0.0938 0.0625 0.0156
0.0234 0.0938 0.1406 0.0938 0.0234
0.0156 0.0625 0.0938 0.0625 0.0156
0.0039 0.0156 0.0234 0.0156 0.0039
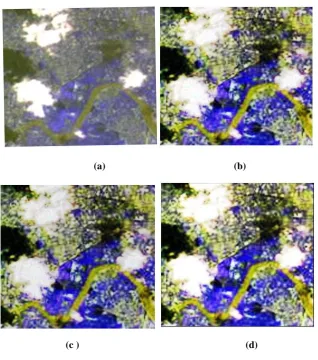
Low contrast images LISS III and LISSIV were used to test our proposed methods .These images have been equalized by GHE, DWT and proposed shift invariant wavelet transforms such as Atrous wavelet transform. The quality of the visual results indicated that the proposed equalizations gives good results compared with GHE and DWT . Experiments were performed over various low contrast images which confirmed the qualitative results.
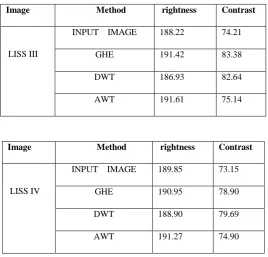
To start our analysis, for each image, we compute the brightness (i.e., the mean) and contrast (i.e., the standard deviation) of the original and the output images obtained by
the proposed methods Table. 1 shows values of the brightness and contrast obtained for the enhanced images.
Let us first analyze the results in Table 1 regarding the brightness of the original and the processed images. By observing the absolute difference between the value of the brightness in the original and processed images (i.e., the brightness preservation), we state that the images produced by our proposed methods are better in preserving the brightness of the original images. We perform a similar analysis to the one performed in Table1 by observing the contrast values, we state that the images produced by the GHE methods gives good results. Observing brightness and contrast our proposed methods produces good results.
5. IMAGE QUALITY METRICS
Image Quality [11]-[13] is a characteristic of an image that measures the perceived image degradation. Quality assessment methods can be broadly classified into two categories: Full Reference Methods (FR) and No Reference Method (NR). In FR, the quality of an image is measure in comparison with a reference image which is assumed to be perfect in quality. NR methods do not employ a reference image. The image quality metrics considered and implemented here fall in the FR category. In order to estimate the quality, the enhanced image is compared with the original image. The value obtained for different quality metrics are shown in Table2
(a) (b)
[image:3.595.140.459.371.732.2](a) (b)
[image:4.595.142.459.70.438.2](c ) (d)
Fig 3. LISS IV image
(a)Input image (b) Image contrast enhancement using GHE (c) Image contrast enhancement using DWT (d)Image contrast enhancement using AT
Table 1. Brightness and contrast for LISS III and LISS IV Image
Image Method rightness Contrast
LISS III
INPUT IMAGE 188.22 74.21
GHE 191.42 83.38
DWT 186.93 82.64
AWT 191.61 75.14
Image Method rightness Contrast
LISS IV
INPUT IMAGE 189.85 73.15
GHE 190.95 78.90
DWT 188.90 79.69
[image:4.595.164.433.500.757.2]Table2
(i) Image metrics readings for LISS III Image
(ii) Image metrics readings for LISS III Image
6. CONCLUSION
In this paper a new satellite image contrast enhancement techniques was proposed based on AWT. The proposed technique decomposed the input image into wavelet planes and residual images. Then SVD of the residual is updated and inverse transform was performed to get the enhanced image. The proposed techniques were compared with the DWT and GHE. Brightness and contrast was calculated which shows the superiority of the proposed method over conventional methods. Finally various quality metrics were calculated . Higher value offor evaluating the performance of the proposed methods.
8. ACKNOWLEDGEMENT
The authors wish to thank Institute of remote sensing (IRS),Anna University , Chennai for providing image samples used in this paper
.
REFERENCES
[1] Yeong- Taekgi M, Member, IEEE,” Contrast enhancement using Brightness preserving Bi-Histogram Equalization” Signal Processing R&D Center, Samsung Electronics Co., Suwon, IKorea Y.-T. Kim Contrast
[2] Hasan Demirel, Gholamreza Anbarjafari and Mohammad N. Sabet Jahromi,” Image Equaliztion Based on singular Value Decomposition”978-1-4244-2881-6/08/$25.00 ©2008 IEEE
[3] Kirk Baker,” Singular Value Decomposition tutorial” March 29, 2005
[4] Raghuram Rangarajan,Ramji Venkataramanan , Siddharth Shah Image Denoising Using Wavelets Wavelets & Time Frequency December 16, 2002 [5] Byoung-Woo Yoon, Woo-Jin Song,” Image contrast
enhancement based on the generalized histogram” Journal of Electronic Imaging 16(3), 033005 (Jul–Sep 2007)
[6] Kamarul Hawari Ghazali, Mohd Fais Mansor, Mohd. Marzuki Mustafa and Aini Hussain ,” Feature Extraction Technique using Discrete Wavelet Transform for Image Classification” The 5th Student Conference on Research and Development- SCOReD 2007 11-12 December 2007, Malaysia.
[7] Hasan Demirel, Cagri Ozcinar, and Gholamreza Anbarjafari,” Satellite Image Contrast Enhancement Using Discrete Wavelet Transform and Singular Value Decomposition”. IEEE Geoscience and Remote Sensing Letters.
METHOD MSE PSNR RMSE AD NCC NAE MD UQI SSIM
GHE 835.61 18.9850 3.7336e+002 2.9276e+005 8.9215e+004 785.2302 85 0.9325 0.7641
DWT 743.9125 19.4793 4.6072e+002 1.1095e+005 8.6289e+004 3.7109e+003 90 0.9322 0.7584
AWT 103.3541 27.9902 1.7774e+001 3.1065e+005 9.2922e+004 -2.9216e+003
130 0.9975 0.9720
METHOD MSE PSNR RMSE AD NCC NAE MD UQI SSIM
GHE 266.7661 23.8985 2.8399e+002 -1.0258e+005 7.9215e+004 985.2302 97 0.9841 0.9196
DWT 298.5117 23.4030 3.2492e+002 8.2420e+004 8.6289e+004 3.6809e+003 125 0.9826
0.9095
AWT 2.5072e+003 14.1428 5.1336e+002 -1.6255e+005 9.3222e+004 -2.8612e+003
156 0.9221
Decomposition” IEEE Transactions on Geoscience and Remote Sensing VOL.37.NO.3 May 1999
[9] Chen Shao-hui, Su Hongbo,Zhang Renhua, Tian Jing ,”Fusing remote sensing images using atrous wavelet
transform and empirical mode
decomposition”.ScienceDirect Pattern Recognition Letters 29 (2008) 330-
342
[10] Xiaodong Zhang and Deren Li,”Atrous Wavelet Decomposition Applied to Image Edge Detection”. Geographic information Sciences Vol, 7 No.2, Decomposition 2001.
[11] G. R. Harish Kumar and D. Singh, “Quality assessment of fused image of MODIS and PALSAR” Progress in Electromagnetics Research B, Vol. 24, 191{221, 2010 [12] D.Venkata Rao, N.Sudhakar , B.Ravindra Babu ,
L.Pratap Reddy,” An Image Quality Assessment Technique Based on Visual Regions of Interest Weighted Structural Similarity”, GVIP Journal, Volume 6, Issue 2, September, 2006