Arrhythmia ECG Signal Analysis using Non Parametric
Time-Frequency Techniques
A. Dliou
ESSI, Ecole Nationale des Sciences Appliquées, Université Ibn Zohr, Agadir,
Morocco
R. Latif
ESSI, Ecole Nationale des Sciences Appliquées, Université Ibn Zohr, Agadir,
Morocco
F. M. R. Maoulainine
Equipe l’enfant, la santé et le développement, service de réanimation CHU, faculté de
médecine, Université Cadi Ayyad, Marrakech, Morocco
M. Laaboubi ESSI, Ecole Nationale des
Sciences Appliquées, Université Ibn Zohr, Agadir,
Morocco
ABSTRACT
Non-parametric time-frequency analysis for multicomponent nonstationary signals is an important issue in signal processing, especially in the biomedical field. Due to the nonstationary, multicomponent nature of the biomedical ECG signal, the use of time-frequency analysis can be very useful to identify the exact multicomponent structure of this biological signal. In this paper, three time-frequency techniques are applied for analyzing a supraventricular ECG signal. These three time-frequency techniques are the Choi– Williams distribution, the Bessel distribution and the Born-Jordan distribution. Their performance over supraventricular ECG signal as well as over a monocomponent frequency modulation signal in additive Gaussian noise was compared. The results showed that the Choi–Williams technique gives a good performance as compared to other time-frequency techniques.
Keywords
Nonstationary signal, Time-frequency techniques, electrocardiogram, supraventricular arrhythmia, QRS complex.
1.
INTRODUCTION
The electrocardiogram (ECG) is a complementary examination quickly available, whose usefulness in terms of diagnosis and prognosis is major. This biological signal gives a representation containing information about the condition of the heart. To understand this signal, it helps to understand how the heart works. The shape and size of its main components P wave, QRS complex and T wave and the time intervals between these various components contains useful information about the nature of disease afflicting the heart. The change in the shape of ECG waveform and heart rate is generally reflected by the presence of cardiac abnormalities [1-4].
Time domain processing is a commonly selected and more intuitive option for analyzing biological signals such as electrocardiogram (ECG) by skilled physicians [1-5], but, this domain does not always present all the features of ECG signals then the abnormalities may not always be obvious.
The limits of the time-domain analysis have motivated the use of frequency domain techniques for analysis, like Fourier transform [6]. The development of the Cooley–Tukey algorithm has made Fourier techniques more widely available [7]. However, Fourier analysis presents a big problem. This spectral technique done on the entire signal find out which frequencies the signal contains, but you do not know when these frequencies appear in this signal. The effects of each frequency are analyzed as if they were spread over the entire signal. While the Fourier transform is a very useful concept and exhibit good results in stationary conditions, the most useful signals encountered in real-world situations are nonstationary. Therefore, this analysis is very limited since the environment is predominantly nonstationary because it cannot provide localized time information [8].
As all biological signals, especially the ECG signal, belong to the family of multicomponent nonstationary signals, which frequency contents change over time [9]. Their analysis with Fourier transform cannot be interesting, because their spectral characteristics as function of time can be extremely difficult to obtain. Due to the high mortality rate and many forms of heart diseases [9], early detection and precise discrimination of ECG arrhythmia are important and essential for the treatment of patients. A complete analysis of this type of biological signals requires a proper time-frequency technique that can resolve the problem of the Fourier transform and uncover the multicomponent nature of these signals.
In the field of mathematical signal processing and biomedical engineering, time-frequency analysis presents one of the major recent developments [11,12]. Time-frequency analysis is motivated by the analysis of nonstationary signals whose spectral characteristics change in time. In nonstationary conditions, time-frequency analysis stands as a sophisticated approach. Various time-frequency techniques that provide both spectral as well as time localized information have been important tools for the analysis of nonstationary signals, especially the ECG signal [13-21].
presents an energy concentration around the instantaneous frequency of each component in the time-frequency plane. As such, it can be employed to evaluate the frequency variation of the ECG signal as function of time.
Parametric and non-parametric techniques present the two major categories of the time-frequency techniques. In signal processing, non-parametric time-frequency techniques are an important issue for analyzing multicomponent nonstationary signals [20,23]. The Cohen’s Class is the most generalized and significant class of time frequency techniques [11]. However, time-frequency techniques of multicomponent signals have a major weakness, they suffer from the presence of cross-terms [11,12,22]. The cross-terms can obscure the interesting real features in the signal. The time-frequency resolution (energy concentration) is an important issue for both mono and multicomponent signals [24]. Significant efforts have been applied to define which time frequency technique can decrease the effect of cross-terms while ameliorating the time frequency resolution [11,12,22]. However, there is always a compromise between these two concepts, time and frequency. Despite of the rich literature, the time-frequency techniques have different performances in this respect and the choice of a particular technique is not an easy task it is application dependent.
This paper presents a comparative study of the following time-frequency techniques, the Choi–Williams distribution, the Born-Jordan distribution and the Bessel distribution, belonging to Cohen's class and their behavior for analyzing the abnormal Electrocardiogram signal. This abnormal signal was taken from a patient with supraventricular arrhythmia.
The paper is organized as follows. We first summarize the mathematical time-frequency methods of the Choi–Williams distribution, the Born-Jordan distribution and the Bessel distribution. After that, we will discuss about the normal and supraventicular ECG signals. Then, an extensive performance comparison of the three time-frequency techniques over noisy monocomponent linear frequency modulation signal will be presented. After that, the analysis results of the three time-frequency techniques over a supraventicular ECG signal we will discuss. Finally, a brief concluding section provides the main results presented in this work.
2.
TIME-FREQUENCY TECHNIQUES
Time domain and frequency domain present two extremes of a large set of signal analysis methods. The best time resolution is obtained by the time domain, but without any information about the frequency concept. The frequency domain gives the best frequency resolution where, however, we cannot identify the temporal localization of the frequencies constituting the signal.
To surpass the weakness of the time and frequency domain, the time-frequency techniques are receiving growing interest offering their ability to move continuously between time and frequency domain. Therefore, a proper time-frequency technique can overcome the limits of the time and frequency domain and expose the nonstationary and multicomponent nature of the ECG signals.
Since many aspects of the physical condition of human heart are reflected in the waveforms of ECG, it is important for the processing techniques to detect the different components (P and T waves and especially the QRS complex) of this type of the biomedical signal for a good patient diagnostic. However, the multicomponent signals analysis by the time-frequency techniques suffers from the presence of cross-terms, these
terms are arising in the middle between the time-frequency components. Therefore, a time-frequency technique that reduces the cross-terms is needed [13-21].
In this comparative work, we study the behavior and the performance of the following time-frequency techniques in analyzing a supraventricular arrhythmia ECG signal. These techniques are the Choi–Williams distribution, the Bessel distribution, the Born-Jordan distribution.
2.1. The Choi–Williams distribution
The Choi-Williams distribution CWD(t,f) is one of Cohen’s generalized class of time-frequency techniques, this method adopts an exponential kernel to reduce the cross-terms magnitude. It was a significant step in the field of time-frequency analysis where it opened the way for optimizing resolution with cross-terms reduction [25,26]:
dxd
e
x
t
s
x
t
s
e
t
CWD
j x s 2 * ) 16 ()
2
(
)
2
(
4
2
)
,
(
2 2
(1)Where the parameter σ is real and can control the amount of cross-terms attenuation and time and frequency resolution. We can have a good performance in reducing cross-terms with high resolution but there is always a compromise between these two requirements decided by the factor σ. The amplitude of the cross-terms is directly proportional to the parameter σ. If the cross-terms are suppressed too much, we will lose automatically in resolution in the time frequency plane.
2.2. Born-Jordan distribution (BJD)
The Born-Jordan distribution (BJD) performs well for signals with constant frequency whereas it does not perform as well for signal with frequency modulation. The BJD of a signal s(t) is expressed by the following equation [27,28]:
dxd
e
x
s
x
s
t
BJD
j t t s 2 * 2 2*
)
2
(
)
2
(
1
)
,
(
(2)2.3. The Bessel Distribution
Bessel distribution (BD) applied to a signal s is defined by the following equation [29]:
d
d
s
s
t
t
e
t
BD
s j t)
2
(
)
2
(
)
2
(
*
)
(
1
2
)
,
(
* 2
(3)Where τ is time lag, and α is a positive scaling factor with a recommended value α≤0.5.
based on the Bessel function of the first kind is given by the following expression (RIDB):
RIDB
s(
t
,
)
h
(
)
R
s(
t
,
)
e
j2d
(4)With
d
s
s
t
g
t
R
tt s
)
2
(
)
2
(
*
)
(
1
)
(
2
)
,
(
*
2
(5)
Where s is the original signal, s* is the conjugate of the original signal, t is time instants, g is time smoothing window, and h is frequency smoothing window.
3.
CARDIAC SIGNALS
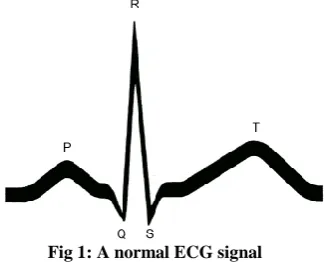
An Electrocardiogram (ECG) is a recording of electrical activity produced by the heart. Fluently, ECG signals are handled in the medical field for monitoring, diagnosis, and the treatment of patients suffering from heart diseases. ECG trace is most usually obtained with the electrodes attached in a variety of standard positions to make easier the detection of the abnormalities. A normal ECG signal consists chiefly of P wave, QRS complex and T wave. Understanding these various components allows obtaining important knowledge about the function of the patient's heart. Cardiologists can use minute features of the ECG signals to collect useful diagnostic information [2-5].
An electrocardiogram consists principally by the P wave, QRS complex and T wave which are generated by the heart beating, these different components have a well-known signature. Sometimes in the time domain, these waves have similar morphologies. Time frequency analysis of such signal, which take account both time and frequency concepts, can afford some parameters which behave differently than that of the time or frequency domain techniques [2-5].
[image:3.595.55.281.104.224.2]The figure 1 presents a normal ECG with its principal components, P and T waves and QRS complex:
Fig 1: A normal ECG signal
An arrhythmia is an abnormality of cardiac rhythm, it refers to any change from the normal sequence of electrical impulses. Arrhythmias differ in their population frequency, anatomical substrate, physiological mechanism, etiology, natural history, prognostic significance, and response to treatment. The heart can beat too slow, too fast, or with an irregular rhythm [31,32]. In this study, a supraventricular arrhythmia ECG signal was treated.
Supraventricular arrhythmia occurs in the upper areas of the heart. It has irregular shapes of QRS complexes [31].
The figure 2 shows the time-domain ECG signal of a patient with supraventricular arrhythmia. This supraventricular arrhythmia data was obtained from [33]. The sampling frequency for this abnormal ECG signal was 128 samples/s, the signal length is 4 seconds. The shape of the QRS complex in this signal is abnormal at the QR part. A time frequency representation is needed to deal with this problem and detect the change that occurs in a narrow duration of time.
Fig 2: Time-domain ECG signal from a patient with supraventricular arrhythmia
4.
DISCUSSION AND RESULTS
4.1
Time-frequency comparison over noisy
frequency modulation signal
In this section, an analytic frequency modulation signal is considered to analyze the performance of the three time-frequency techniques. The monocomponent signal is given by the following equation:
s
(
t
)
a
*
e
i(t)
noise
(
t
)
(6)Where the amplitude a is constant, υ(t) is the analytic signal phase and noise(t) is a white Gaussian noise with complex-values.
The derivative of the phase represents the instantaneous frequency of the signal s(t) given by the following expression:
dt
d
t
f
i
2
1
)
(
(7)As around the instantaneous frequency all time-frequency techniques show an energy concentration, then the estimation of the instantaneous frequency will be a solution of the following optimization problem:
f
(
t
)
arg(
max
(
W
(
t
,
f
));
f i
2
0
f
sf
(8)Where W(t,f) is the time-frequency distribution obtained by equation 1 , 2 or 4 and fs = 1/T is the sampling frequency.
[image:3.595.89.253.534.665.2]
)]
(
[
))
(
(
)]
(
[
))
(
(
t
f
t
f
V
t
f
t
f
B
i i
i i
(9)
With:
f
i(
t
)
f
i(
t
)
f
i(
t
)
(10)Where
f t
i( )
andf
i(
t
)
are the instantaneous frequency
and instantaneous frequency estimate respectively.
For the Quadratic class of time-frequency distribution, this bias is zero for linear frequency modulation signal, and therefore a Cramer–Rao bound (CRB) exists for the variance.
For this study a linear frequency modulation test signal with
the following expression was considered:
s t
( )
ae
i( )t , υ(t) = 2π(fot+ βt2/2), with a = 1, f [image:4.595.319.534.102.300.2]o=0.05fs, β=0.4fs. From the equation 7, the instantaneous frequency is: f=fo+βt. For this time-frequency analysis, N=512 samples was selected as length signal with the sampling frequency equal to N Hz, whereas the total duration of the signal was 1 second. Using different signal-to-noise ratio (SNR), Gaussian white noise samples were added to the test signal.
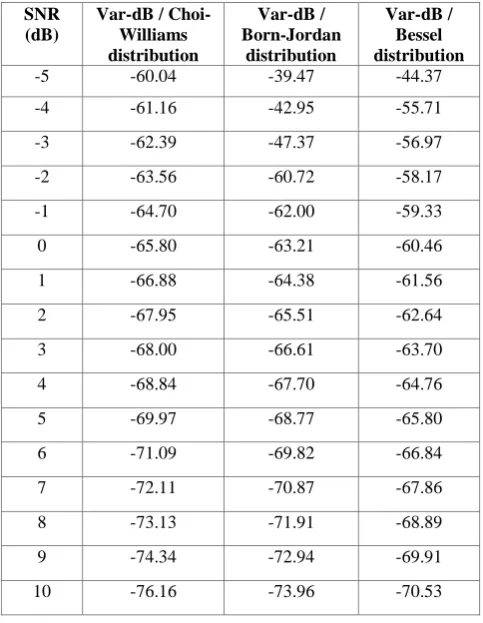
Table 1. Performance of the different time-frequency techniques of a linear frequency modulation signal
SNR (dB)
Var-dB / Choi-Williams distribution
Var-dB / Born-Jordan
distribution
Var-dB / Bessel distribution
-5 -60.04 -39.47 -44.37
-4 -61.16 -42.95 -55.71
-3 -62.39 -47.37 -56.97
-2 -63.56 -60.72 -58.17
-1 -64.70 -62.00 -59.33
0 -65.80 -63.21 -60.46
1 -66.88 -64.38 -61.56
2 -67.95 -65.51 -62.64
3 -68.00 -66.61 -63.70
4 -68.84 -67.70 -64.76
5 -69.97 -68.77 -65.80
6 -71.09 -69.82 -66.84
7 -72.11 -70.87 -67.86
8 -73.13 -71.91 -68.89
9 -74.34 -72.94 -69.91
10 -76.16 -73.96 -70.53
The different results of the three time-frequency techniques over monocomponent signal are shown in the Table 1. The Choi–Williams distribution present a distinguished
performance compared to other time-frequency techniques, where this time-frequency gives the minimum instantaneous frequency variance.
Fig 3: Performance of the different time-frequency techniques over a linear monocomponent frequency
modulation signal
From the figure 3, we can note that the Choi-Williams time-frequency technique gave a minimal variance for all SNR's. The difference in performance between Choi-Williams time-frequency and other time-time-frequency techniques is more evident for low SNR's.
4.2
Time-frequency comparison over a
supraventricular ECG signal
[image:4.595.48.290.419.731.2]The figures 4 presents the time-frequency image of the abnormal ECG signal obtained from a patient with supraventricular arrhythmia (figure 2). This time-frequency image is obtained by the calculation of the Choi-Williams distribution by using equation 1.
Fig 4: Time-frequency image of the supraventricular arrhythmia ECG signal (figure 2) using Choi-Williams
distribution
[image:4.595.316.540.448.619.2]Fig 5: Time-frequency image of the supraventricular arrhythmia ECG signal (figure 2) using Born-Jordan
distribution
The figures 6 presents the time-frequency image of the abnormal ECG signal obtained from a patient with supraventricular arrhythmia (figure 2). This time-frequency image is obtained by the calculation of the Bessel distribution by using equation 3.
Fig 6: Time-frequency image of the supraventricular arrhythmia ECG signal (figure 2) using Bessel distribution
First the abnormal ECG signal collected from a patient with supraventricular arrhythmia (figure 2) was converted by Hilbert transform into its analytical form and processed using the different time-frequency techniques.
A supraventricular rhythm is due to abnormal impulses arising from the atria [31]. The QRS complexes of the abnormal signal (figure 2) have irregular shapes.
From the figures 4 to 6, we can note that the different time-frequency techniques are able to identify the three QRS complexes of the abnormal ECG signal. However, only the Choi-Williams distribution manage to track the change in the frequency components of each QRS complex as marked by ‘QRS1’ and ‘QRS11’ with clearly and with good resolution.
Due to its high time-frequency resolution and cross-terms control, the Choi-Williams time-frequency technique expected to be efficient in analyzing the ECG signal than the other techniques, especially with the Bessel distribution treated in [13].
5.
CONCLUSION
The principal aim of this paper was to present a comparative performance study of three time-frequency techniques applied to an abnormal ECG signal in order to identify the existing anomaly. The three time-frequency techniques that have been the subject of this study are the Choi–Williams distribution, the Born-Jordan distribution, the Bessel distribution.
For the supraventricular arrhythmia ECG signal, only the Choi-Williams technique which can identify and reveal the true structure of the QRS complexes, where there are two components with narrow separation in frequency. Due to its high time-frequency resolution and cross-terms control, the Choi-Williams time-frequency technique expected to be efficient in analyzing the abnormal ECG signal.
6.
REFERENCES
[1] Shirley A. Jones 2008 ECG Success Exercises in ECG Interpretation, by F. A. Davis Company.
[2] Clifford Gari D., Azuaje Francisco, McSharry Patrick E. 2006. Advanced Methods and Tools for ECG Data Analysis, ARTECH HOUSE, INC.
[3] Shade Bruce 2008 Pocket ECGs : A Quick Information Guide, by The McGraw-Hill Companies.
[4] Rowlands Angela and Sargent Andrew 2011 The ECG Workbook 2nd edition, M&K Publishing.
[5] Bigan C., Woolfson M.S. 2000. Time-frequency analysis of short segments of biomedical data, IEEE Proc.-Sci. Meas. Technol. 147 (6) 368–373.
[6] Clayton R.H., Murray A. (Sept. 1993. Estimation of the ECG signal spectrum during ventricular fibrillation using the fast Fourier transform and maximum entropy methods, Proceedings of the Computers in Cardiology, pp. 867 - 870.
[7] Cooley J. W.and Tukey J. W. 1965. An algorithm for machine calculation of complex Fourier series, Math. Comput. 19, 297–301.
[8] Chen. Z., Senior Member, IEEE, and Urwin P. 2001. Power Quality Detection and Classification Using Digital Filters, IEEE Porto Power Tech Conference 10" L13" September, Porto, Portugal.
[9] Wood J. C., Barry D. T. Sept. 1996. Time-frequency analysis of skeletal muscle and cardiac vibrations, Proceedings of the IEEE, vol. 84, issue 9, pp. 1281-1294.
[10]World Hearth Organization, The Atlas of Heart Disease
and Stroke, http://www.who.int/
cardiovascular_diseases/resources/atlas/en/.
[11]Cohen L. 1989. Time-frequency distributions-a review, Proc. IEEE 77 (7) 941–981.
[12]Cohen L. 1995. Time-Frequency Analysis, Prentice Hall PTR, Englewood Cliffs, New Jersey.
[13]Mousa Allam and Saleem Rashid 2011 Using reduced interference distribution to analyze abnormal cardiac signal, Journal of ELECTRICAL ENGINEERING, VOL. 62, NO. 3, 168–172.
[image:5.595.55.279.336.505.2][15]Al-Manie Mohammed A. 2010. Deconvolution methods for biomedical signals analysis, Indian Journal of Science and Technology, Vol. 3 No. 2.
[16]Boashash B. 2003. Time-Frequency Signal Analysis and Processing: A Comprehensive Reference, Elsevier, Oxford, UK.
[17]Latif R., Aassif E., Moudden A., Faiz B. 2003. High resolution time-frequency analysis of an acoustic signal backscattered by a cylindrical shell using a Modified Wigner-Ville representation, Meas. Sci. Technol. 14, pp. 1063-1067.
[18]Latif R., Aassif E., Maze G., Decultot D., Moudden A., Faiz B. 2000. Analysis of the circumferential acoustic waves backscattered by a tube using the time-frequency representation of Wigner-Ville, Journal of Measurement Science and Technology, Vol. 11, 1, pp. 83-88.
[19]Latif R., Laaboubi M., Aassif E., Maze G. 2009. Détermination de l’épaisseur d’un tube élastique à partir de l’analyse temps-fréquence de Wigner-Ville, Journal Acta-Acustica, Vol 95, Number 5, pp 843-848.
[20]Hussain Z. M. and Boashash B. 2002. Adaptive instantaneous frequency estimation of multi-component FM signals using quadratic time-frequency distributions, IEEE Transactions on Signal Processing, vol. 50, no. 8, pp. 1866 -1876.
[21]Addison Paul S. 2005. Wavelet transforms and the ECG: a review, Physiol. Meas. 26 R155–R199.
[22]Flandrin P. 1998. Time-Frequency/Time-Scale Analysis, Academic Press, Boston, MA.
[23]Hussain Z.M., Boashash B. 2003. IF estimation for multicomponent signals, in: Time-Frequency Signal Analysis and Processing: A Comprehensive Reference, Elsevier, Oxford, UK, pp. 437–445.
[24]Boashash B. 1991. Time-frequency signal analysis In: Advances in Spectrum Estimation (S.Haykin: editor). Prentice-Hall, NJ.
[25]Choi H., Williams W. 1989. Improved time-frequency representation of multicomponent signals using exponential kernels, IEEE Trans. Signal Process. 37 (6) 862–871.
[26]Hlawatsch, F., Manickam T. G., Urbanke R. L, and Jones W. 1995. Smoothed pseudo-Wigner distribution, Choi-Williams distribution, and cone-kernel representation: Ambiguity-domain analysis and experimental comparison, Signal Processing, vol. 43 (2), pp. 149-168.
[27]Cohen L. 1966. Generalized Phase-Space Distribution Functions, J. Math. Phys., Vol. 7, No. 5, pp. 781-786.
[28]Thayaparan T. and Kennedy S. February 2004. Detection of a manoeuvring air target in sea-clutter using joint time-frequency analysis techniques. In IEEE Proceedings - Radar, Sonar and Navigation, Vol. 151, pages 19-30.
[29]Guo Z., Durand L.G., Lee H.C. 1994. The Time-Frequency Distributions of Nonstationary Signals Based on a Bessel Kernel, IEEE Trans. on Signal Proc., vol 42, pp. 1700-1707.
[30]Jeong J., Williams W. 1992. Kernel design for reduced interference distributions, IEEE Trans. Signal Processing, 40 No. 2, 402–412.
[31]Hebbar A.K., Hueston W.J. 2002. Management of Common Arrhythmias: Part I. Supraven-tricular Arrhythmias, J. Am. Family Physician 65 (12) 2479– 2486.
[32]Hebbar A.K., Hueston W.J. 2002. Management of common arrhythmias: Part II. Ventricular arrhythmias and arrhythmias in special populations, J. Am. Family Physician 65 (12) 2491–2496.