Correlation between Various Quality Characteristics for
Aspect-Oriented Systems
Kanika Arora
ASET
Amity University
Noida-125, U.P
Abhishek Singhal
ASET
Amity University
Noida-125, U.P
Abhay Bansal
ASET
Amity University
Noida-125, U.P
ABSTRACT
Aspect-oriented system is a new emerging technique of software development that provides mechanism for implementing cross-cutting concerns. Quality assessment of important characteristics like cohesion, coupling, complexity, reusability, maintaibility, etc. is fairly unexplored for Aspect-oriented systems. Through this research work we have tried to find out the correlation between some of the quality characteristic of aspect-oriented system. We have established correlation between cohesion and complexity, Cohesion and Changeability. Then we have find out that whether cohesion metric can be used as indicator for assessing complexity and changeability of aspect oriented system. Then will find out that whether cohesion metric and complexity can be used as indicator for assessing reusability of aspect oriented system through finding the correlation between cohesion and reusability, and complexity and reusability.
General Terms
Aspect-Oriented systems, Software Engineering
Keywords
Correlation, Cohesion, Changeability, Complexity, Reusability
1.
INTRODUCTION
Aspect-oriented is new programming approach to develop software. There are various existing approaches like modular and object-oriented but these approaches suffer from limitation in properly separating crosscutting concerns. Examples of cross cutting concerns are caching, tracing, logging, security, resource pooling, synchronization, exception handling etc. Code related to these concerns is generally duplicated within several modules. This code must be properly encapsulated as well as must be scattered throughout the code. This is limitation in object-oriented and module-oriented system. Aspect-oriented approach provides efficient way for separating cross cutting concerns. Through Aspect-oriented system tangling of code will be reduced which makes it easier to understand core functionality. Also reusability and maintenance can be increased. An aspect contains some code and instructions about when to invoke the aspect, where to invoke and how to invoke. Cross cutting concerns are implemented as aspects. AspectJ, AspectC, AspectC++, AspectXML, CasearJ, Hyper/J etc are various languages for aspect-oriented system. Different terms are introduced in respective aspect oriented language. [1] There are various metrics to measure quality characteristics of object-oriented system and module-oriented system but very few metrics are for aspect-oriented system. Various quality characteristic are cohesion, coupling, complexity, size, reusability, changeability, maintainability etc. Cohesion is one
of the important quality characteristic. Cohesion is degree to which elements of module belong to each other. High cohesion is desirable for any system. Coupling is degree of relatedness among the modules that is connection between modules. Low coupling is desirable. Complexity is efforts needed to analyze code, efforts needed in modification and modification of modules. Maintainability is modification of software product after delivery. Reusability is using the module again to reduce the coding. Changeability is capability of a program to allow modification to be implemented. There are various metrics to measure quality characteristics of object-oriented system and module-oriented systems but very few metrics are for aspect-oriented system. [2] Through this research work we have tried to find out the correlation between some of the quality characteristic of aspect-oriented system. We have established correlation between cohesion and complexity, Cohesion and Changeability. Then we have find out that whether cohesion metric can be used as indicator for assessing complexity and changeability of aspect oriented system. Then will find out that whether cohesion metric and complexity can be used as indicator for assessing reusability of aspect oriented system through finding the correlation between cohesion and reusability, and complexity and reusability.
2.
CORRELATION BETWEEN
COHESION AND CHANGEABILITY
2.1
Change Impact Analysis
[image:2.595.312.545.414.565.2]It is not feasible to perform all possible changes to evaluate ACI for a big Aspect-oriented system. For evaluating ACI, some random changes of different patterns have been made. Minimum number of random changes required in a component need to be defined to get approximately same value of ACI. To define minimum required number of random changes of different patterns in a component, we used the results of the experiment on samples of AspectJ of different size components performed by Kumar et al. [5]. Criteria have been defined on the basis of these results for deciding the minimum number of random changes.
Table 1.1 Criteria for Minimum Number of Random Changes
No. of operations in the component
Minimum number of random changes required to evaluate ACI
1 4
2 7
3 12
4 18
5 21
6 23
7 25
>7 >25
Average change impact can be evaluated as sum of the number of affected operations (of the same component or of another component) due to changes made in the code, and dividing by total number of changes made, which can be formulized as:
𝐴𝐶𝐼 𝐶𝑖 = 𝑁𝑗 =1𝑁𝐴𝑂𝑗(𝐶𝑖)/𝑁 where ACI is average change impact of component ci , N is
the number of changes made based on the minimum number of random changes required in a component and NAOj(ci) is
the number of affected operations by jth change in a component ci .
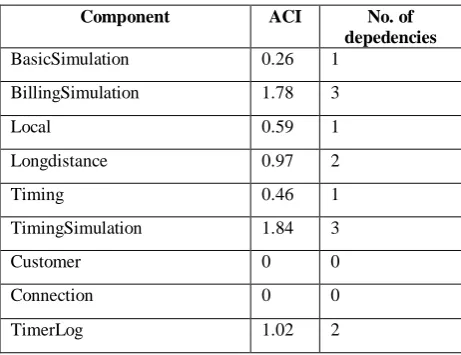
Table 1.2 Values of ACI calculated Component ACI No. of
depedencies
BasicSimulation 0.26 1
BillingSimulation 1.78 3
Local 0.59 1
Longdistance 0.97 2
Timing 0.46 1
TimingSimulation 1.84 3
Customer 0 0
Connection 0 0
TimerLog 1.02 2
In order to validate proposed changeability measurement technique, dependency of a component on other components has also been measured. Number of dependencies can be measured with the help of adjacency matrix, which is one of the existing techniques.
2.2
Cohesion Calculation
Cohesion is degree of relatedness among elements of the module. High cohesion is desirable feature of any software program. Various metrics are available for cohesion measurement. Sant Anna et al. (2003) [6], Zhao and Xu (2004) [7], Gelinas et al. (2006) [8], Kumar et al. (2008a) [9,10] proposed various cohesion metrics for aspect-oriented system. In our research work we have used UACOH metric proposed by Kumar et al which is derived from metric given by Gelinas et al [8]. They identified different connections in aspect oriented system and used as base for cohesion measurement. Metric includes directly and indirectly connected components but excluded the access operations. UACOH (Ci) metric is defined as actual number of connections between members by maximum number of possible connections of interest between members of Ci. 𝑈𝐴𝐶𝑂𝐻(𝐶𝑖) = 𝐴𝑁𝐶(𝐶𝑖) 𝑀𝑁𝐶 𝐶𝑖 ∈ [0,1]
Where ANC (Ci) is actual number of connections between members and MNC (Ci) is maximum number of possible connections of interest between members of Ci.
We have taken different programs in AspectJ language for calculation of cohesion. Value of cohesion metric calculated for various programs are as follows
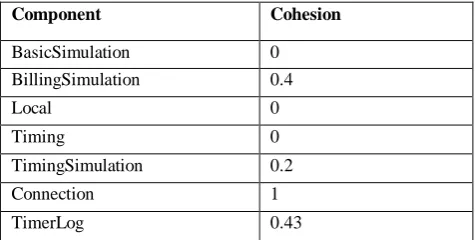
Table 1.3 Values of Cohesion calculated
Component Cohesion
BasicSimulation 0
BillingSimulation 0.4
Local 0
Longdistance 0
Timing 0
TimingSimulation 0.2
Customer 0
Connection 1
TimerLog 0.43
2.3
Correlation Calculation
Correlation is measure of association between two or more sets of data. Example: How sales is related to price, How sale of item A is related to sale of item B.
[image:2.595.54.285.582.759.2]Where as in probabilistic model includes the scope of error, therefore, equation is 𝑦 = 𝑏𝑜𝑋 + 𝑏1 + 𝜀
ἑ (epsilon) is also referred to as residual.
To find out the regression model first step is to draw a scatter plot and confirm the linear relationship between variable x and y variable.
Next step is to develop the Linear Regression model. For which regression coefficients b0 and b1, values of ∑x, ∑y, ∑x2, ∑xy are calculated through the following formula
𝑆𝑆𝑥𝑦 = 𝑥𝑦 −
( 𝑥 )( 𝑦 )𝑁
𝑆𝑆𝑥𝑥 = x
2−
𝑥2𝑛
𝑏1 = 𝑆𝑆𝑥𝑦 𝑆𝑆𝑥𝑥
𝑏𝑜 = 𝑦
𝑥 −
𝑏1( 𝑥) 𝑛
Then after calculating the values simple regression line can be computed 𝑦 = 𝑏𝑜𝑋 + 𝑏1
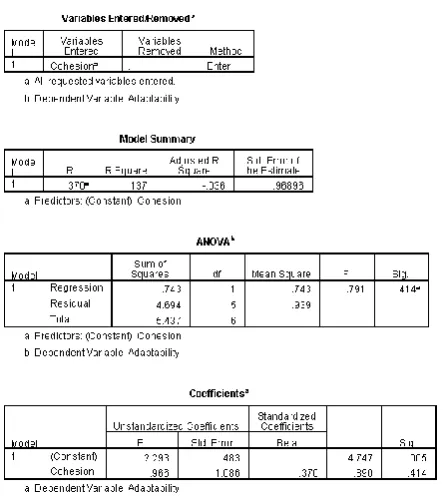
Various tools can be used for developing simple linear regression like MS Excel, Minitab, SPSS, etc. In this paper we have used SPSS tool developed by IBM for creating scatter plot as well as finding correlation between cohesion and complexity.
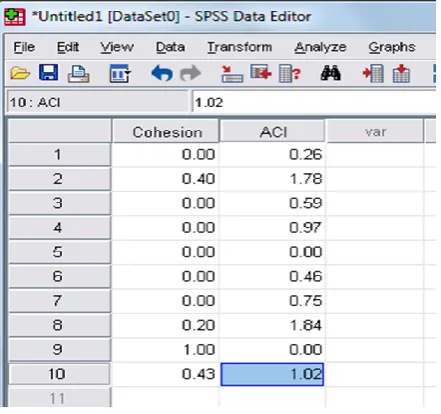
[image:3.595.317.561.73.236.2]Using the same tool SPSS and same procedure correlation between cohesion and changeability can be established [11,12]. To calculate the correlation manually and performing Statistical inference about correlation coefficient equation written above number can be used.
Figure 1: Values for cohesion and ACI variables
[image:3.595.321.550.297.604.2]Figure 2: Scatter Plot for Cohesion and ACI
Figure 3: Correlation output through SPSS
2.4
Result
[image:3.595.56.277.454.661.2]These values are high enough to indicate that in high dependent AO system, change impact will be high. That means, a highly dependent AO system will absorb low changes. It has been seen from the existing literature that highly dependent systems lead to poor maintainability, which is also proved by the present work. Also we verified the results given by Kumar et al.
3.
CORRELATION BETWEEN
COHESION AND REUSABILITY
Reusability is how wider an component can be reused in other components and in terms of aspect-oriented system reusability is how wider an AO component can be reused in other AO Components. As reusability reduces development time, efforts, cost for developing software, therefore, reusable software are in high demand. Module-oriented, Object-oriented, component-based software developed are some of the used approaches for developing reusable software. These approaches provide different level of reusability like functional, code design reusability, sub-system and system reusability. The code for any feature scatters throughout, which is limitation of traditional software development approaches. But in AO approach, aspects are created which integrates with primary concerns, therefore, through this code is better modularized. There are various metrics for calculating reusability for traditional approaches but those metrics are not appropriate for AOS because of extra features and not much exploration is there in this field. In this chapter we will find out the correlation between cohesion and reusability. For calculating correlation SPSS tool has been used.
3.1 Calculation of Reusability
For calculating reusability of software we should first know the characteristics on which reusability depends. According to study conducted by National Institute of Standards and Technology (NIST) [13] researchers identified ten characteristics on which reusability depends. These characteristics are maintainability, modularity, reliability, flexibility, portability, efficiency, completeness, understandability, generality expandability. The characteristics identified are indirect characteristics on which reusability depends. The ten characteristics on which reusability depend cannot be measured directly and few of these are not as much important for reusability. Kumar et al. conducted survey to determine the importance of the various characteristic for assessing reusability. On the basis of survey result found to be maintainability, understandability, adaptability and modularity as the important characteristics. To assess the value of reusability they proposed the model in which these four external characteristics and internal characteristics are calculated. On the basis of the trend obtained from the values of these characteristics show, reusability is assessed.
[image:4.595.310.548.541.661.2]We conducted the survey to determine the values of these four characteristics and then correlated cohesion with these values to find out reusability. Values obtained for these four characteristics are given in the table below.
Table 1.4 Values of characteristics on which reusability depends Compone nt Understan dability Modul arity Maintain ability Adapta bility BasicSimul ation
2.67 2.83 2.50 2.33
Connection 2.17 3.17 3.00 2.67
BillingSim ulation
2.83 3.17 3.33 2.17
TimingSim ulation
3.17 3.67 2.83 3.67
TimerLog 3.83 4.50 3.83 4.0
Local 1.83 2.0 2.17 1.67
Timing 1.17 1.0 1.3 1.5
3.2
Cohesion Calculation
Cohesion is degree of relatedness among elements of the module. High cohesion is desirable feature of any software program. Various metrics are available for cohesion measurement. Sant Anna et al. (2003) [6], Zhao and Xu (2004) [7], Gelinas et al. (2006) [8], Kumar et al. (2008a) [9, 10] proposed various cohesion metrics for aspect-oriented system. In our research work we have used UACOH metric proposed by Kumar et al which is derived from metric given by Gelinas et al [8]. They identified different connections in aspect oriented system and used as base for cohesion measurement. Metric includes directly and indirectly connected components but excluded the access operations. UACOH (Ci) metric is defined as actual number of connections between members by maximum number of possible connections of interest between members of Ci. 𝑈𝐴𝐶𝑂𝐻 𝐶𝑖 = 𝐴𝑁𝐶(𝐶𝑖) 𝑀𝑁𝐶 𝐶𝑖 𝜖 [0,1]
Where ANC (Ci) is actual number of connections between members and MNC (Ci) is maximum number of possible connections of interest between members of Ci.
We have taken different programs in AspectJ language for calculation of cohesion. Value of cohesion metric calculated for various programs are given in the table 1.5
Table 1.5 Values of Cohesion calculated Component Cohesion
BasicSimulation 0
BillingSimulation 0.4
Local 0
Timing 0
TimingSimulation 0.2
Connection 1
3.3
Correlation Calculation
Correlation is measure of association between two or more sets of data. Example: How sales is related to price, How sale of item A is related to sale of item B.
Correlation and Regression are generally performed together [11, 12]. Regression explains the variation in one variable i.e. dependent variable due to variation in other variable i.e. independent variable. Example: Variation in sale of sale of product because of variation in advertising. There can be simple linear relation, Non-linear and multiple regression. In our paper we have tried to establish correlation between two variables, therefore, that will be linear Regression. Simple Linear Regression is based upon slope-intercept equation of line y = b0x+b1 where b0 is slope of the line and b1 is y intercept of line. In deterministic model, all Points are assumed to be on the regression line, therefore, equation is y = b0x+b1
Where as in probabilistic model includes the scope of error, therefore, equation is y = b0x+b1+ ἑ
ἑ (epsilon) is also referred to as residual.
To find out the regression model first step is to draw a scatter plot and confirm the linear relationship between variable x and y variable.
Next step is to develop the Linear Regression model. For which regression coefficients b0 and b1, values of ∑x, ∑y, ∑x2, ∑xy are calculated through the following formula
𝑆𝑆𝑥𝑦 = 𝑥𝑦 −
( 𝑥 )( 𝑦 )𝑁
𝑆𝑆𝑥𝑥 = x
2−
𝑥2𝑛
𝑏1 = 𝑆𝑆𝑥𝑦 𝑆𝑆𝑥𝑥
𝑏𝑜 = 𝑦
𝑥 −
𝑏1( 𝑥) 𝑛
Then after calculating the values simple regression line can be computed y=b0x+b1
Various tools can be used for developing simple linear regression like MS Excel, Minitab, SPSS, etc. In this paper we have used SPSS tool developed by IBM for creating scatter plot as well as finding correlation between cohesion and complexity.
[image:5.595.324.527.116.265.2]Using the same tool SPSS and same procedure correlation between cohesion and changeability can be established [11, 12]. To calculate the correlation manually and performing Statistical inference about correlation coefficient equation written above can be used.
Figure 4: Values for cohesion and external characteristics
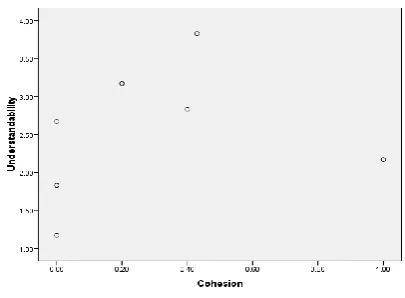
The scatter plot obtained between Cohesion and understandability on the basis of values obtained.
Figure 5: Scatter Plot for Cohesion and Understandability
[image:5.595.321.537.353.499.2]The scatter plot obtained between Cohesion and Modularity on the basis of values obtained.
Figure 6: Scatter Plot for Cohesion and Modularity
The scatter plot obtained between Cohesion and Maintainability on the basis of values obtained.
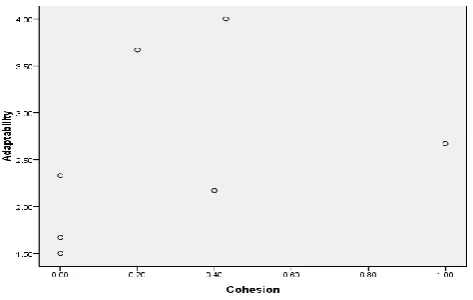
[image:5.595.324.532.572.734.2]The scatter plot obtained between Cohesion and Adaptability on the basis of values obtained.
Figure 8: Scatter Plot for Cohesion and Adaptability
[image:6.595.62.299.104.254.2]The correlation obtained for the values of cohesion, understandability, modularity, maintainability and adaptability using SPSS tool developed by IBM.
Figure 9: Correlation output through SPSS
[image:6.595.54.295.341.579.2]Figure 10: Correlation between cohesion and external characteristics
Figure 11: Correlation and Regression values for cohesion and understandability
[image:6.595.316.536.442.699.2] [image:6.595.54.299.638.712.2]
Figure 13: Correlation and Regression values for cohesion and maintainability
Figure 14: Correlation and Regression values for cohesion and Adaptability
3.4
Result
The output shows the value of r2 is .56 for the characteristic understandability and the standard error computed is 0.9395, the value of r2 for modularity is 0.237 and value of standard error is 1.08, the value of r2 for maintainability is 0.340 and value of standard error is .72 and the value of r2 for adaptability is .137 and value of standard error is 0.96 . Values obtained for r2 and standard error shows lack in consistency. Also the values of correlation coefficients for these characteristics show there is no consistency in values obtained. As there is no consistency in the measures collected for UACoh, it is not recommended as being used for assessing reusability. Therefore, UACoh cannot be used as indicators of reusability of AO components.
4
CORRELATION
BETWEEN
COMPLEXITY AND REUSABILITY
Reusability is how wider an component can be reused in other components and in terms of aspect-oriented system reusability is how wider an AO component can be reused in other AO Components. As reusability reduces development time, efforts, cost for developing software, therefore, reusable software are in high demand. Module-oriented, Object-oriented, component-based software developed are some of the used approaches for developing reusable software. These approaches provide different level of reusability like functional, code design reusability, sub-system and system reusability. The code for any feature scatters throughout, which is limitation of traditional software development approaches. But in AO approach, aspects are created which integrates with primary concerns, therefore, through this code is better modularized. There are various metrics for calculating reusability for traditional approaches but those metrics are not appropriate for AOS because of extra features and not much exploration is there in this field. In this chapter we will find out the correlation between complexity and reusability. For calculating correlation SPSS tool has been used.
4.1 Calculation of Reusability
[image:7.595.57.279.427.678.2]Table 1.6 Values of characteristics on which reusability depends
Componen t
Understand ability
Modul arity
Maintaina bility
Adapta bility BasicSimul
ation
2.67 2.83 2.50 2.33
Connection 2.17 3.17 3.00 2.67
BillingSimu lation
2.83 3.17 3.33 2.17
TimingSim ulation
3.17 3.67 2.83 3.67
TimerLog 3.83 4.50 3.83 4.0
Local 1.83 2.0 2.17 1.67
Timing 1.17 1.0 1.3 1.5
4.2 Complexity Calculation
[image:8.595.319.550.312.431.2]We have used the complexity model proposed by Kumar et al. (2010) [14, 15] for measuring code complexity as discussed in chapter 3. Tool is based upon the concept of fuzzy logic [16].
Table 1.7 Values of Complexity calculated Component Complexity
BasicSimulation 0.71
BillingSimulation 0.51
Local 0.31
Timing 0
TimingSimulation 0.31
Connection 0.51
TimerLog
0.51
4.3 Correlation calculation
Correlation is measure of association between two or more sets of quantitative data. Example: How sales is related to price, How sale of item A is related to sale of item B. Correlation and Regression are generally performed together [11, 12]. Regression explains the variation in one variable i.e. dependent variable due to variation in other variable i.e. independent variable. Example: Variation in sale of sale of product because of variation in advertising. There can be simple linear relation, Non-linear and multiple regression. In our paper we have tried to establish correlation between two variables, therefore, that will be linear Regression. Simple Linear Regression is based upon slope-intercept equation of line y = b0x+b1 where b0 is slope of the line and b1 is y intercept of line. In deterministic model, all Points are assumed to be on the regression line, therefore, equation is y = b0x+b1
Where as in probabilistic model includes the scope of error, therefore, equation is y = b0x+b1+ ἑ
ἑ (epsilon) is also referred to as residual.
To find out the regression model first step is to draw a scatter plot and confirm the linear relationship between variable x and y variable.
Next step is to develop the Linear Regression model. For which regression coefficients b0 and b1, values of ∑x, ∑y, ∑x2, ∑xy are calculated through the following formula
𝑆𝑆𝑥𝑦 = 𝑥𝑦 −
( 𝑥 )( 𝑦 )𝑁
𝑆𝑆𝑥𝑥 = x
2−
𝑥2𝑛
𝑏1 = 𝑆𝑆𝑥𝑦 𝑆𝑆𝑥𝑥
𝑏𝑜 = 𝑦
𝑥 −
𝑏1( 𝑥) 𝑛
Then after calculating the values simple regression line can be computed 𝑦 = 𝑏𝑜𝑋 + 𝑏1
[image:8.595.50.287.342.459.2]Various tools can be used for developing simple linear regression like MS Excel, Minitab, SPSS, etc. In this paper we have used SPSS tool developed by IBM for creating scatter plot as well as finding correlation between cohesion and complexity. Using the same tool SPSS and same procedure, correlation between cohesion and reusability can be established [11, 12]. To calculate the correlation manually and performing Statistical inference about correlation coefficient equation written above can be used.
Figure 15: Values for complexity and external characteristics
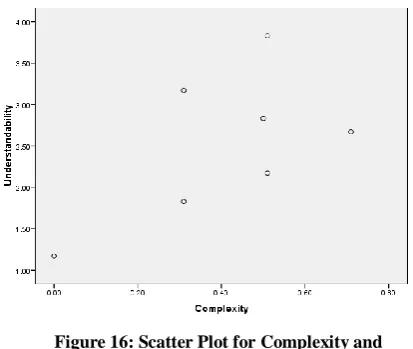
[image:8.595.319.526.506.680.2]The scatter plot obtained between Complexity and understandability on the basis of values obtained.
Figure 16: Scatter Plot for Complexity and Understandability
Figure 17: Scatter Plot for Complexity and Modularity
[image:9.595.318.554.128.340.2]The scatter plot obtained between Complexity and Maintainability on the basis of values obtained.
Figure 18: Scatter Plot for Complexity and Maintainability
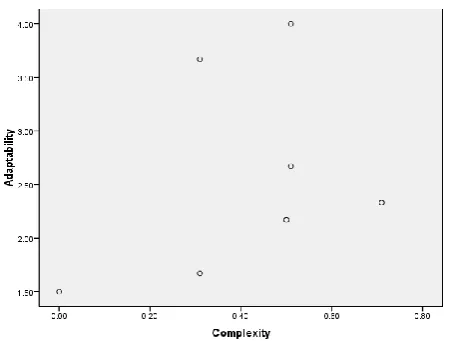
The scatter plot obtained between Complexity and Adaptability on the basis of values obtained.
Figure 19: Scatter Plot for Complexity and Adaptability
[image:9.595.69.265.290.461.2]The correlation obtained for the values of complexity, understandability, modularity, maintainability and adaptability using SPSS tool developed by IBM.
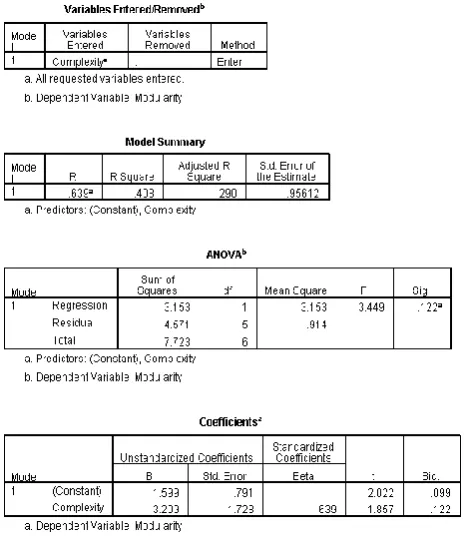
Figure 20: Correlation output through SPSS
[image:9.595.321.541.394.653.2] [image:9.595.59.284.535.705.2]Figure 22: Correlation and Regression values for complexity and modularity
[image:10.595.58.290.400.654.2]Figure 23: Correlation and Regression values for complexity and maintainability
Figure 24: Correlation and Regression values for complexity and Adaptability
4.5 Result
The output shows the value of r2 is .369 for the characteristic understandability and the standard error computed is 0.242, the value of r2 for modularity is 0.408 and value of standard error is .290, the value of r2 for maintainability is 0.452 and value of standard error is .342 and the value of r2 for adaptability is .129 and value of standard error is 0.45. The values collected for complexity show proportional relationship with external characteristics understandability, modularity, maintainability and adaptability. Increase in value of complexity of any component show increase in reusability of the component. The correlation coefficient show high correlation between complexity and external characteristics. Therefore complexity can be used as indicator of assessing reusability of aspect-oriented systems.
5. CONCLUSION
Correlation analysis between average change impact and number of dependencies gives a correlation factor value. We evaluated values of cohesion metric for the different programs to establish correlation between cohesion and changeability, to check whether cohesion metric can be used to predict changeability or not. The results show that cohesion metric cannot be used to predict changeability of AOS. This result verifies the result given by Kumar et al in their work. Values obtained for r2 and standard error shows lack in consistency for cohesion and external characteristics of reusability. Also the values of correlation coefficients for these characteristics show there is no consistency in values obtained. As there is no consistency in the measures collected for UACoh, it is not recommended as being used for assessing reusability. Therefore, UACoh cannot be used as indicators of reusability of AO components.
high correlation between complexity and external characteristics. Therefore complexity can be used as indicator of assessing reusability of aspect-oriented systems.
6.
REFERENCES
[1] Avadhesh Kumar, “Analysis and Design of Metric for Aspect-Oriented Systems”, Ph.D. dissertation, School of Mathematics and Computer Applications, Thapar University, Patiala, Punjab, 2010.
[2] Arora K, Singhal A, Bansal A, “ A study of Various Metrics for Different Quality Characteristic for Aspect-oriented Systems”, International Journal of Computational Intelligence and Information security (IJCIIS),ISSN NO 1837-7823, Volume-3, No. 4, pp: 25-32,April2012.
[3] ISO/IEC 9126, 2001, Institute of Electrical and Electronics Engineering, Part1, 2, 3, 4: Quality Model. [4] Chaumun M.A., Kabaili H., Keller R.K., and Lustman F.,
2002. A Change Impact Model for Changeability Assessment in Object-Oriented Systems. Science of Computer Programming, vol.45(2-3), Elsevier Science Publishers,pp-155-174.
[5] Kumar, A., Kumar, R., Grover, P.S., 2006b. A Change Impact Assessment in Aspect-Oriented Software Systems. In the proceedings of International Software Engineering Conference Russia 2006 (SECR-2006), Dec, 2006, pp: 83-87.
[6] Sant'Anna, C., Garcia, A., Chavez, C., Lucena, C., and Staa, A., 2003. On the Reuse and Maintenance of Aspect-Oriented Software: An Assessment Framework. XXIII Brazilian Symposium on Software Engineering, Manaus, Brazil, October 2003.
[7] Zhao, J., and Xu, B., 2004. Measuring Aspect Cohesion. In: Proceedings of International Conference on Fundamental Approaches to Software Engineering (FASE'2004), March 29-31, LNCS 2984, Springer-Verlag, Barcelona, Spain, pp.54-68.
[8] Gelinas, J.F., Badri, M., and Badri, L., 2006. A Cohesion Measure for Aspects. Journal of Object Technology, 5(7), pp. 97–114.
[9] Kumar, A., Kumar, R., and Grover, P.S., 2008a. Towards a Unified Framework for Cohesion Measurement in Aspect-Oriented Systems. In IEEE Proceedings of 19th Australian Software Engineering Conference (ASWEC 2008) Perth, Western Australia, March 26-28, pp:57-65. [10]Kumar, A., Kumar, R., and Grover, P.S., 2010b. Unified
Cohesion Measures for Aspect-Oriented Systems. Accepted for publication in International Journal of Software Engineering and Knowledge Engineering (IJSEKE), September Issue, 2010.
[11]Naval Bajpai ,Business Statistics, pearson Publication [12]Rajendra Nargundkar, Marketing research: Text and
Cases, Tata Mc Graw Hill.
[13]Salamon, W.J., and Wallace, D.R., 1994. Quality Characteristics and Metrics for Reusable Software (Preliminary Report). US DoC for US DoD Ballistic Missile Defense Organization, NISTIR 5459.
[14]Kumar A., Kumar R., and Grover P.S., 2008b. Towards a Unified Framework for Complexity Measurement in Aspect-Oriented Systems. In IEEE Proceedings of 2008 International Conference on Computer Science & Software Engineering (CSSE 2008), Wuhan, China, Dec-12-14, pp: 98-103.
[15]Kumar, R., Grover, P.S., and Kumar, A., 2010a. A Fuzzy Logic Approach to Measure Complexity of Generic Aspect-Oriented Systems. Journal of Object Technology (JOT), 9(3), pp: 43-57, May/June 2010.