R E S E A R C H A R T I C L E
Open Access
An organ culture system to model early
degenerative changes of the intervertebral
disc II: profiling global gene expression changes
Dessislava Z Markova
1, Christopher K Kepler
1,3, Sankar Addya
2, Hallie B Murray
4, Alexander R Vaccaro
1,3,
Irving M Shapiro
1, D Greg Anderson
1,3, Todd J Albert
1,3and Makarand V Risbud
1*Abstract
Introduction:Despite many advances in our understanding of the molecular basis of disc degeneration, there remains a paucity of preclinical models which can be used to study the biochemical and molecular events that drive disc degeneration, and the effects of potential therapeutic interventions. The goal of this study is to characterize global gene expression changes in a disc organ culture system that mimics early nontraumatic disc degeneration.
Methods:To mimic a degenerative insult, rat intervertebral discs were cultured in the presence of TNF-a, IL-1b and serum-limiting conditions. Gene expression analysis was performed using a microarray to identify differential gene expression between experimental and control groups. Differential pattern of gene expression was confirmed using quantitative reverse transcriptase polymerase chain reaction (qRT-PCR) or Western blot.
Results:Treatment resulted in significant changes in expression of more than 1,000 genes affecting many aspects of cell function including cellular movement, the cell cycle, cellular development, and cell death and proliferation. Many of the most highly upregulated and downregulated genes have known functions in disc degeneration and extracellular matrix hemostasis. Construction of gene networks based on known cellular pathways and expression data from our analysis demonstrated that the network associated with cell death, cell cycle regulation and DNA replication and repair was most heavily affected in this model of disc degeneration.
Conclusions:This rat organ culture model uses cytokine exposure to induce wide gene expression changes with the most affected genes having known reported functions in disc degeneration. We propose that this model is a valuable tool to study the etiology of disc degeneration and evaluate potential therapeutic treatments.
Introduction
Amongst the many potential pain generators in the lumbar spine, symptomatic disc degeneration is thought to be a significant contributor to low back pain (LBP) [1,2] and accounts for more than 25% of lumbar fusion surgery per-formed in the USA [3]. By some estimates, LBP results in direct and indirect health-care expenditures exceeding $100 billion per year, a considerable portion of which is due to discogenic pain [4]. Despite the scale of this clinical problem, many aspects of the pathogenesis associated with
LBP remain incompletely characterized. The highly vari-able nature of associated symptoms and the presence of multiple potential sources of pain within the spine often confound efforts to accurately identify and study disc degeneration in live subjects. However, most authorities agree that there is a strong link between intervertebral disc degeneration and the LBP [5,6].
Establishing clinically relevant models of disc degen-eration has also proven difficult. In contrast to humans, disc degeneration is not commonly seen in most quad-rupedal animals, likely due to a variety of factors such as mineral composition, vertebral range of motion, extracellular matrix (ECM) composition, cell type, and weight distribution [7]. Different strategies have been * Correspondence: [email protected]
1
Department of Orthopaedic Surgery, Thomas Jefferson University, 1015 Walnut Street, Philadelphia, PA 19107, USA
Full list of author information is available at the end of the article
developed to induce disc degeneration in animals including gene silencing, application of supraphysiologic loading, and disc injury. One theoretical advantage of usingin vitromodels to study disc degeneration is the ability to carefully control confounding environmental variables, which may differ between individual animals such as nutrition and the loading environment. To date, most widely used in vitrostudies are performed with cells isolated from the intervertebral disc, which are then either grown in monolayer or suspended in a matrix that allows cells to assume a three-dimensional phenotype. To capture the benefits associated with in vitro models of disc degeneration while maintaining essentially normal cell density and distribution and the native ECM, we have developed and performed initial characterization of a disc organ culture model using intact rat intervertebral discs [8]. Since the hallmark catabolic processes such as matrix breakdown and decreased cellular biosynthesis during human degenera-tion are mediated by a number of cytokines, including IL-1band TNF-a[9-14], we chose to mimic the degen-erative state by treating organ-cultured discs with a cocktail containing both these cytokines.
Our initial investigations focused on targeted evalua-tion of a few key molecules known to be intermediaries in the degenerative cascade or essential components of the disc ECM [8]. In the present study, we hope to expand on our initial studies to demonstrate that this model replicates the degenerative phenotype in humans through analysis of global gene expression changes. Our results clearly indicate that this model is a good alterna-tive toin vivoand cell-basedin vitromodels of interver-tebral disc degeneration.
Materials and methods
Disc harvesting and organ culture
The rat tissue samples were obtained under a protocol approved by the Institutional Animal Care and Use Committee (IACUC) of the Thomas Jefferson University (Protocol number 703H). Rat lumbar disc specimens were isolated using a method reported earlier by Pon-nappan et al. [8]. Briefly, using a sterile surgical blade (number 15) the whole lumbar intervertebral discs (IVDs with the endplates were dissected (n = 6 discs/ animal) and maintained in organ culture in 12-well cell culture plates. All experimental lumbar discs were cul-tured in DMEM containing 1% FBS, 10 ng/ml IL-1b (R&D Systems, Inc., Minneapolis, MN, USA), 100 ng/ml TNF-a, 50μg/ml L-ascorbate, 40 mM NaCl, antibiotics and antimycotics (Cellgro, Mediatech, Inc., Herndon, VA, USA). Control discs were cultured in DMEM con-taining 10% FBS, 50 μg/ml L-ascorbate, 40 mM NaCl and antibiotics without any cytokines. The discs were maintained in culture for 10 days. The complete
medium was replaced every two days for both groups. In each experiment, six lumbar discs from one animal were used per group. The number of animals used for each study is indicated where appropriate.
Microarray analysis
experiments. The microarray data can be accessed at the Gene Expression Omnibus number GSE42611 [17].
RNA extraction and quantitative real-time PCR
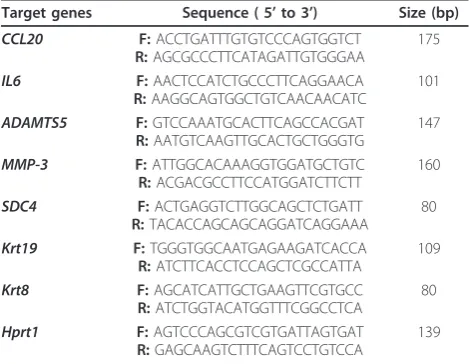
[image:3.595.56.291.539.721.2]The discs were collected and the annulus fibrosus (AF) was separated from the nucleus pulposus (NP) as in pre-viously described method [8]. Total RNA was extracted from NP tissue (RNeasy Micro kit, Qiagen) according to the manufacturer’s instructions. The RNA samples were treated with DNase I digestion prior to conversion into cDNA. Single-stranded cDNA was synthesized from 0.5 μg of total RNA using RNA to cDNA EcoDry Premix (Oligo dT) (Clontech Laboratories, Inc., Mountain View, CA, USA) and quantitative (q) RT-PCR was performed using SYBR Green PCR Master Mix (Applied Biosys-tems, Foster City, CA, USA) on an ABI 7900 HT sequence detection system. A melting curve analysis was performed to ensure primer specificity. The amount of PCR product was estimated using a relative standard curve quantification method. Expression was normalized by using housekeeping gene hypoxanthine phosphoribo-syltransferase 1 (Hprt1). All the primers used were synthesized by Integrated DNA Technologies, Inc. (Cor-alville, IA, USA). Sequences for primers are presented in Table 1.
Western blot
Expression of Syndecan 4 (SDC-4) and Keratin 19 (KRT19) were evaluated by Western blot analysis. NP tissue was washed with cold PBS and was extracted with lysis buffer (Cell Signaling Technologies, Beverly, MA, USA) at 4°C for 24 h. The lysis buffer contains: 20 mM Tris-HCl (pH 7.5), 150 mM NaCl, 1 mM Na2 EDTA, 1 mM EGTA, 1% Triton, 2.5 mM sodium pyrophosphate, 1 mM b-glycerophosphate, 1 mM Na3VO4, 1 μg/ml
leupeptin, 1 mM PMSF and 1× complete protease inhi-bitors (Roche, Indianapolis, IN, USA). The tissue lysate was centrifuged for 10 min at 14,000 × g to collect the clear tissue extract. Protein concentration in the extract was determined using a Pierce BCA protein assay kit (Thermo Fisher Scientific Inc., Rockford, IL, USA). Lysates were treated with 0.1 U/ml chondroitinase ABC (Sigma-Aldrich) in 50 mM Tris-acetate EDTA buffer at 37°C for 1 h. Protein extracts (10μg) were centrifuged at 4°C for 2 min at 14,000 × g and resolved on NuPAGE 4 to 12% Bis-Tris Gels (Invitrogen, Carlsbad, CA, USA). Proteins were transferred onto Immobilon-P Membrane (Merck Millipore, Darmstadt, Germany). The membrane was blocked with 5% nonfat dry milk in PBS with 0.1% Tween-20 and incubated overnight at 4°C in 3% nonfat dry milk in PBS with 0.1% Tween-20 with the appropri-ate antibody anti-Syndecan 4 (Abcam, Cambridge, UK) and anti-Keratin 19 (Cell Signaling Technologies), respectively. The binding of the secondary antibody was detected by enhanced chemiluminescence (ECL-Plus, GE Healthcare, Little Chalfont, UK). Results were nor-malized to the content of tubulin detected with mono-clonal antibody beta-tubulin (1:3000, Developmental Studies Hybridoma Bank (DSHB)), n= 3 independent experiments.
Senescence-associatedb-galactosidase staining
The primary rat NP cells were isolated using a method reported earlier by Wanget al. [10]. Cells were plated in Lab-Tek II Chamber Slide System (Nalge Nunc Interna-tional, Rochester, NY, USA) and treated with 10 ng/ml IL-1band 10 ng/ml TNF-afor 10 days. The slides were rinsed with PBS, fixed with fixative solution for 15 min at room temperature, and incubated overnight at 37°C with fresh SA-b-gal staining solution (Senescence Detec-tion Kit, Abcam). Cells were observed under a light microscope for development of blue color. The images were captured using a Nikon Eclipse E600 (Nikon, Tokyo, Japan).
Data analysis
Statistical analysis was performed using Sigma Plot 11.2 statistical software (Systat Software, Inc., Chicago, IL, USA). Differences between groups in continuous vari-ables were analyzed by the Student’sttest assuming sig-nificance atP < 0.05.
Results
Microarray experiment
Following organ culture experiment (Figure 1A), RNA was extracted and microarray analysis was performed. Figure 1B depicts the heat map of the significant NP gene expression profile changes between the control (Ctr) and experimental (Exp) groups, demonstrating Table 1 Primers used for real-time RT-PCR.
Target genes Sequence ( 5’to 3’) Size (bp)
CCL20 F:ACCTGATTTGTGTCCCAGTGGTCT
R:AGCGCCCTTCATAGATTGTGGGAA
175
IL6 F:AACTCCATCTGCCCTTCAGGAACA
R:AAGGCAGTGGCTGTCAACAACATC
101
ADAMTS5 F:GTCCAAATGCACTTCAGCCACGAT
R:AATGTCAAGTTGCACTGCTGGGTG
147
MMP-3 F:ATTGGCACAAAGGTGGATGCTGTC
R:ACGACGCCTTCCATGGATCTTCTT
160
SDC4 F:ACTGAGGTCTTGGCAGCTCTGATT
R:TACACCAGCAGCAGGATCAGGAAA
80
Krt19 F:TGGGTGGCAATGAGAAGATCACCA
R:ATCTTCACCTCCAGCTCGCCATTA
109
Krt8 F:AGCATCATTGCTGAAGTTCGTGCC
R:ATCTGGTACATGGTTTCGGCCTCA
80
Hprt1 F:AGTCCCAGCGTCGTGATTAGTGAT
R:GAGCAAGTCTTTCAGTCCTGTCCA
139
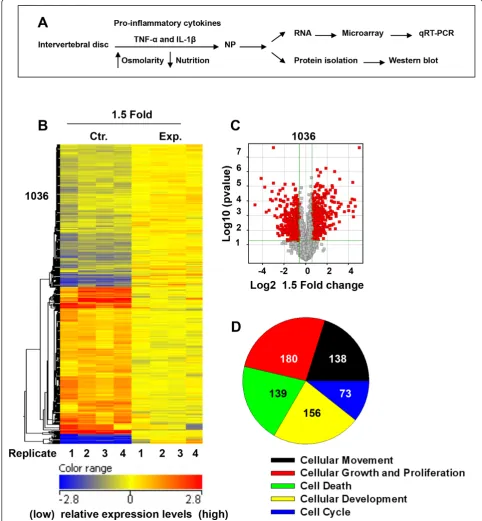
Figure 1(A) Schematic showing disc organ culture setup. Culturing discs under low pO2, in hyperosmolar, nutritionally limiting media with
exposure to proinflammatory cytokines mimics the molecular changes characteristic of disc degeneration.(B)Microarray analysis of rat discs treated with TNF-aand IL-1bfor 10 days. The heat map displays gene expression patterns of 1,036 genes after treatment. The relative levels of gene expression are depicted with a color scale, where blue represents the lowest and red represents the highest level of expression.(C)
Volcano plot of microarray data depicting the significant differences (P< 0.05) in expression patterns between the control (Ctr.) and
more than 1,000 individual genes that were either upre-gulated or downreupre-gulated by more than 1.5-fold in the experimental model. In total, 1,036 genes demonstrated a significant upregulation or downregulation based on the microarray results. Figure 1C more clearly depicts the relative balance between genes either upregulated or downregulated by more than 1.5-fold (P< 0.05) in the experimental model compared to the control group using a volcano plot; significantly upregulated genes are depicted by red dots to the right of the center while sig-nificantly downregulated genes are denoted by red dots to the left of the center. From a functional standpoint, genes changing expression patterns in the experimental model could be divided into several different known cel-lular functions as seen in Figure 1D: 138 genes affect cellular movement, 73 genes affect the cell cycle, 156 genes affect cellular development, 139 genes are involved in cellular death and 180 genes are known intermediaries in cellular growth and proliferation. Genes contributing to these major cellular functions are shown in Table 2.
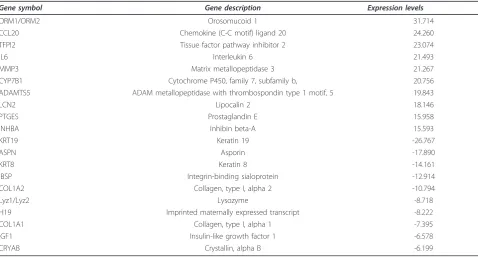
The 10 genes most highly upregulated and downregu-lated in the experimental group are depicted in Figure 2A and 2B, respectively, and the related expres-sion levels are reported in Table 3. Upregulated genes with known roles in disc degeneration included interleu-kin-6 (Il-6), matrix metallopeptidase 3 (Mmp3), and a disintegrin and metalloproteinase with thrombospondin motifs 5 (Adamts5). Highly downregulated genes with known roles in maintenance of normal disc phenotype or as markers for NP cells included Krt19, asporin (Aspn), collagen I alpha-1 (Col1a1), collagen I alpha-2 (Col1a2) and insulin-like growth factor 1 (Igf1).
RNA extraction and quantitative real-time PCR
Validation of differentially expressed genes by real-time RT-PCR
Confirmation of microarray data with qRT-PCR was performed for selected genes from the top 10 upregu-lated and downreguupregu-lated genes as shown in Table 3. Also included in these confirmatory experiments was
Sdc-4, as it was also significantly upregulated in the array data and has recently been shown to be a key reg-ulator ofAdamts5activity in the IVD [10]. Experimental group demonstrated significant upregulation of chemo-kine (C-C motif) ligand 20 (Ccl20), Il-6, Adamts5, and
Mmp3 by almost 216-fold (P < 0.001), 45-fold (P = 0.003), 26-fold (P = 0.02) and 42-fold (P = 0.048), respectively, compared to control (Figure 2C and 2D). Alternatively,Krt19andKrt8 were significantly downre-gulated in the experimental group by 27-fold (P< 0.001) and 17-fold (P< 0.001), respectively, compared to con-trols (Figure 2E). Col1a1andCol1a2 were not evaluated using qRT-PCR in this study as these genes have
previously been shown to be downregulated in experi-mental discs using the same organ culture model [8]. Notably, the relative changes in gene expression between experimental and control groups were larger when analyzed by qRT-PCR suggesting that microarray analysis may be a conservative evaluation of the gene expression differences between the control and the experimental discs.
Western blot analysis
Western blot analysis was performed to demonstrate the effect of treatment on the expression of SDC-4 and KRT19. Similar to the results for the microarray and the qRT-PCR experiments, Western blot analysis showed a robust downregulation of KRT19 protein in the experi-mental group compared to the control group (Figure 2F). There was a strong increase in SDC4 levels in the experimental discs when compared to the control discs (Figure 2F).
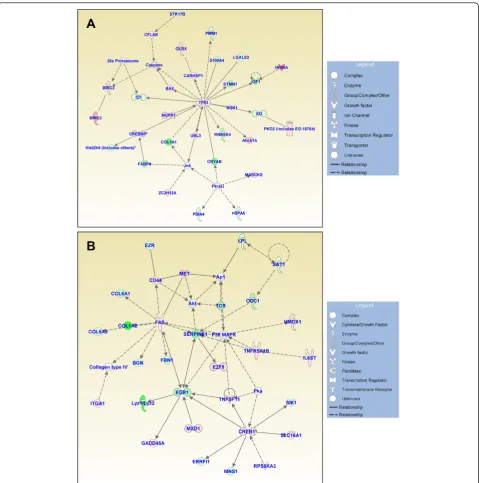
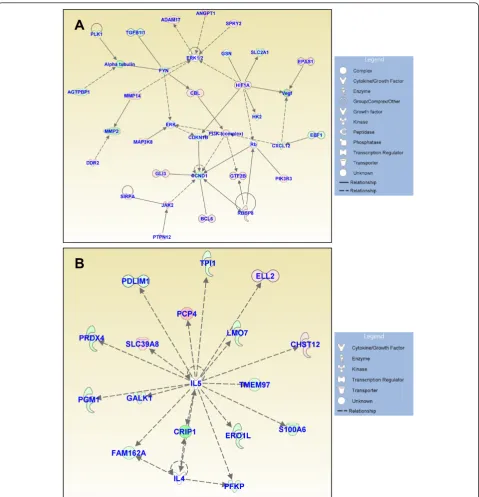
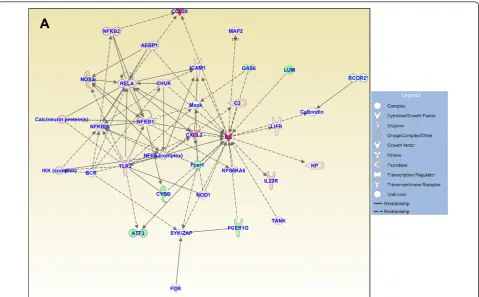
Functional gene networks
Figures 3, 4, and 5 show the IPA-generated gene net-works. The network depicted in Figure 3A is associated with cell death, cell cycle, and DNA replication, recom-bination and repair, and has a score of 31. The network depicted in Figure 3B is associated with cellular growth and proliferation, tissue development and cancer, and has a score of 27. The network shown in Figure 4A is associated with cellular development and vascular func-tion and development, and has a score of 27. The net-work illustrated in Figure 4B is associated with carbohydrate metabolism and protein synthesis and has a score of 16. Finally, the network in Figure 5 depicts genes related to cellular movement, immune cell traf-ficking, cell-to-cell signaling and cellular interactions and has a score of 24.
Effect of cytokines on NP cell senescence
Staining for SA-b-gal was used to measure the effect of proinflammatory cytokines on phenotype of primary rat NP cells. Increased blue staining was evident in the cytoplasm of the cells treated for 10 days compared to the control group, indicating onset of senescent cell phenotype (Figure S1 in Additional file 1).
Discussion
in vivoandex vivo models have been proposed to study disc degeneration but most rely on nonanatomic and nonphysiologic methods of inducing degeneration. AF puncture models continue to be a popular method of inducing degenerative changes in quadrupeds to mimic
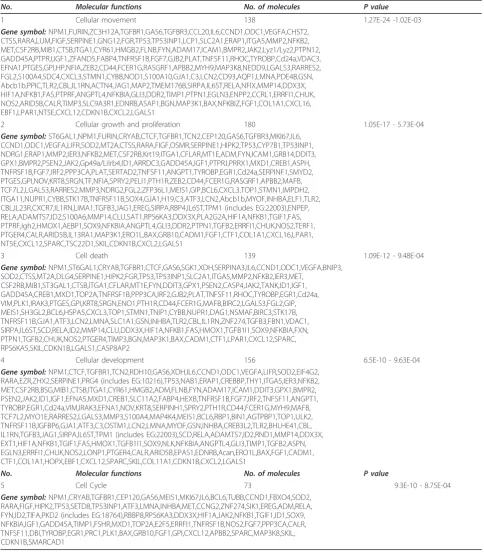
[image:6.595.56.541.100.653.2]a degenerative phenotype. However, techniques that rely on annular puncture and injection of an enzyme into the disc space to induce degeneration may not accu-rately model this process in humans [18-22]. Similarly, the use of species that are prone to the development of Table 2 Differentially expressed genes based on major molecular and cellular functions.
No. Molecular functions No. of molecules P value
1 Cellular movement 138 1.27E-24 -1.02E-03
Gene symbol:NPM1,FURIN,ZC3H12A,TGFBR1,GAS6,TGFBR3,CCL20,IL6,CCND1,ODC1,VEGFA,CHST2, CTSS,RARA,LUM,FIGF,SERPINE1,GNG12,FGR,TP53,TP53INP1,LCP1,SLC2A1,ERAP1,ITGA5,MMP2,NFKB2, MET,CSF2RB,MIB1,CTSB,ITGA1,CYR61,HMGB2,FLNB,FYN,ADAM17,ICAM1,BMPR2,JAK2,Lyz1/Lyz2,PTPN12, GADD45A,PTPRJ,IGF1,ZFAND5,FABP4,TNFRSF1B,FGF7,GJB2,PLAT,TNFSF11,RHOC,TYROBP,Cd24a,VDAC3, EFNA1,PTGES,GPI,HP,NFIA,ZEB2,CD44,FCER1G,RASGRF1,APBB2,MYH9,MAP3K8,NEDD9,LGALS3,RARRES2, FGL2,S100A4,SDC4,CXCL3,STMN1,CYBB,NOD1,S100A10,GJA1,C3,LCN2,CD93,AQP1,LMNA,PDE4B,GSN, Abcb1b,PPIC,TLR2,CBL,IL1RN,ACTN4,JAG1,MAP2,TMEM176B,SIRPA,IL6ST,RELA,NFIX,MMP14,DDX3X, HIF1A,NFKB1,FAS,PTPRF,ANGPTL4,NFKBIA,GLI3,DDR2,TIMP1,PTPN1,EGLN3,ENPP2,CCRL1,ERRFI1,CHUK, NOS2,ARID5B,CALR,TIMP3,SLC9A3R1,EDNRB,ASAP1,BGN,MAP3K1,BAX,NFKBIZ,FGF1,COL1A1,CXCL16, EBF1,LPAR1,NT5E,CXCL12,CDKN1B,CXCL2,LGALS1
2 Cellular growth and proliferation 180 1.05E-17 - 5.73E-04
Gene symbol:ST6GAL1,NPM1,FURIN,CRYAB,CTCF,TGFBR1,TCN2,CEP120,GAS6,TGFBR3,MKI67,IL6, CCND1,ODC1,VEGFA,LIFR,SOD2,MT2A,CTSS,RARA,FIGF,OSMR,SERPINE1,HIPK2,TP53,CYP7B1,TP53INP1, NDRG1,ERAP1,MMP2,IER3,NFKB2,MET,CSF2RB,Krt19,ITGA1,CFLAR,MT1E,ADM,FYN,ICAM1,GRB14,DDIT3, GPX1,BMPR2,PSEN2,JAK2,Gp49a/Lilrb4,ID1,ARRDC3,GADD45A,IGF1,PTPRJ,PRRX1,MXD1,CREB1,ASPH, TNFRSF1B,FGF7,IRF2,PPP3CA,PLAT,SERTAD2,TNFSF11,ANGPT1,TYROBP,EGR1,Cd24a,SERPINF1,SMYD2, PTGES,GPI,NOV,KRT8,SRGN,TF,NFIA,SPRY2,PELI1,PTH1R,ZEB2,CD44,FCER1G,RASGRF1,APBB2,MAFB, TCF7L2,LGALS3,RARRES2,MMP3,NDRG2,FGL2,ZFP36L1,MEIS1,GIP,BCL6,CXCL3,TOP1,STMN1,IMPDH2, ITGA11,NUPR1,CYBB,STK17B,TNFRSF11B,SOX4,GJA1,H19,C3,ATF3,LCN2,Abcb1b,MYOF,INHBA,ELF1,TLR2, CBL,IL23R,CXCR7,IL1RN,LIMA1,TGFB3,JAG1,EREG,SIRPA,RBP4,IL6ST,TPM1 (includes EG:22003),ENPEP, RELA,ADAMTS7,ID2,S100A6,MMP14,CLU,SAT1,RPS6KA3,DDX3X,PLA2G2A,HIF1A,NFKB1,TGIF1,FAS, PTPRF,Igh2,HMOX1,AEBP1,SOX9,NFKBIA,ANGPTL4,GLI3,DDR2,PTPN1,TGFB2,ERRFI1,CHUK,NOS2,TERF1, PTGER4,CALR,ARID5B,IL13RA1,MAP3K1,ERO1L,BAX,GRB10,CADM1,FGF1,CTF1,COL1A1,CXCL16,LPAR1, NT5E,CXCL12,SPARC,TSC22D1,SKIL,CDKN1B,CXCL2,LGALS1
3 Cell death 139 1.09E-12 - 9.48E-04
Gene symbol:NPM1,ST6GAL1,CRYAB,TGFBR1,CTCF,GAS6,SGK1,XDH,SERPINA3,IL6,CCND1,ODC1,VEGFA,BNIP3, SOD2,CTSS,MT2A,DLG4,SERPINE1,HIPK2,FGR,TP53,TP53INP1,SLC2A1,ITGA5,MMP2,NFKB2,IER3,MET,
CSF2RB,MIB1,ST3GAL1,CTSB,ITGA1,CFLAR,MT1E,FYN,DDIT3,GPX1,PSEN2,CASP4,JAK2,TANK,ID1,IGF1, GADD45A,CREB1,MXD1,TOP2A,TNFRSF1B,PPP3CA,IRF2,GJB2,PLAT,TNFSF11,RHOC,TYROBP,EGR1,Cd24a, VIM,PLK1,IRAK3,PTGES,GPI,KRT8,SRGN,ENO1,PTH1R,CD44,FCER1G,MAFB,BIRC2,LGALS3,FGL2,GIP, MEIS1,SH3GL2,BCL6,HSPA5,CXCL3,TOP1,STMN1,TNIP1,CYBB,NUPR1,DAG1,NSMAF,BIRC3,STK17B, TNFRSF11B,GJA1,ATF3,LCN2,LMNA,SLC1A1,GSN,INHBA,TLR2,CBL,IL1RN,ZNF274,TGFB3,FBN1,VDAC1, SIRPA,IL6ST,SCD,RELA,ID2,MMP14,CLU,DDX3X,HIF1A,NFKB1,FAS,HMOX1,TGFB1I1,SOX9,NFKBIA,FXN, PTPN1,TGFB2,CHUK,NOS2,PTGER4,TIMP3,BGN,MAP3K1,BAX,CADM1,CTF1,LPAR1,CXCL12,SPARC, RPS6KA5,SKIL,CDKN1B,LGALS1,CASP8AP2
4 Cellular development 156 6.5E-10 - 9.63E-04
Gene symbol:NPM1,CTCF,TGFBR1,TCN2,RDH10,GAS6,XDH,IL6,CCND1,ODC1,VEGFA,LIFR,SOD2,EIF4G2, RARA,EZR,ZHX2,SERPINE1,PRG4 (includes EG:10216),TP53,NAB1,ERAP1,CREBBP,THY1,ITGA5,IER3,NFKB2, MET,CSF2RB,BSG,MIB1,CTSB,ITGA1,CYR61,HMGB2,ADM,FLNB,FYN,ADAM17,ICAM1,DDIT3,GPX1,BMPR2, PSEN2,JAK2,ID1,IGF1,EFNA5,MXD1,CREB1,SLC11A2,FABP4,HEXB,TNFRSF1B,FGF7,IRF2,TNFSF11,ANGPT1, TYROBP,EGR1,Cd24a,VIM,IRAK3,EFNA1,NOV,KRT8,SERPINH1,SPRY2,PTH1R,CD44,FCER1G,MYH9,MAFB, TCF7L2,MYO1E,RARRES2,LGALS3,MMP3,S100A4,MAP4K4,MEIS1,BCL6,RBP1,BIN1,AGTPBP1,TOP1,ULK2, TNFRSF11B,IGFBP6,GJA1,ATF3,C3,OSTM1,LCN2,LMNA,MYOF,GSN,INHBA,CREB3L2,TLR2,BHLHE41,CBL, IL1RN,TGFB3,JAG1,SIRPA,IL6ST,TPM1 (includes EG:22003),SCD,RELA,ADAMTS7,ID2,RND1,MMP14,DDX3X, EXT1,HIF1A,NFKB1,TGIF1,FAS,HMOX1,TGFB1I1,SOX9,NLK,NFKBIA,ANGPTL4,GLI3,TIMP1,TGFB2,ASPN, EGLN3,ERRFI1,CHUK,NOS2,LONP1,PTGER4,CALR,ARID5B,EPAS1,EDNRB,Acan,ERO1L,BAX,FGF1,CADM1, CTF1,COL1A1,HOPX,EBF1,CXCL12,SPARC,SKIL,COL11A1,CDKN1B,CXCL2,LGALS1
No. Molecular functions No. of molecules P value
5 Cell Cycle 73 9.3E-10 - 8.75E-04
disc degeneration, such as the sand rat, or other gene knockout models that alter disc biology may not com-pletely reflect the complexities in etiology of human degenerative changes [23-27]. In contrast, an ideal model would not require traumatic injury to the struc-ture of the intervertebral disc and instead induce degen-eration using processes native to the IVD. In this investigation, we characterized a rat organ culture model of disc degeneration through analysis of global gene expression using microarray approach that was further validated using quantitative mRNA and protein expression analysis. This nontraumatic model of disc degeneration, based on the use of inflammatory cyto-kines IL-1band TNF-a, mimics known gene expression patterns observed in the degenerative human disc. Moreover, this model allows for the evaluation of ana-bolic, catabolic and inflammatory processes that become imbalanced in disc degradation leading to degradation of the ECM and ultimately to loss of the biomechanical properties of the intervertebral disc.
The phenotypic and genotypic changes associated with disc degeneration are complex, reflecting the interrelat-edness of many distinct processes. We found changes in the expression of genes involved in a number of cellular functions; genes controlling cellular growth and prolif-eration (181 genes) and cellular development (156 genes) were the most frequently affected. Similarly, IPA network analysis demonstrated the highest gene network score amongst genes involved in cell death, cell cycle, and DNA replication, recombination and repair. This
finding, and the increased incidence of SA-b-gal in cyto-kine-treated NP cells, suggests that during degeneration disc cells may be particularly susceptible to processes such as senescence [28], at the same time as identifying genes that are likely to be related to these processes. Furthermore, these IPA networks highlight the web of interrelated pathways that are differentially regulated in discs undergoing degenerative changes; not only may changes in expression of a single gene have wide down-stream consequences but these figures hint that the existence of a single key mediator of disc degeneration is unlikely.
[image:8.595.58.537.99.356.2]Analysis of the top 20 most affected genes indicate that many genes are known mediators of disc degenera-tion or serve a role in maintaining normal disc funcdegenera-tion. Prior characterization of gene expression patterns from degenerative human IVD tissue has shown a similar breadth of changes in global expression patterns [29-31]. These gene expression analyses suggest that many dif-ferent processes are altered in disc degeneration, although most current research tends to focus on the patterns of inflammatory mediator expression. In agree-ment with recent studies that showed enhanced chemo-kine-mediated macrophage migration by inflammatory cytokines [32], one of the highly upregulated molecules identified in this study is Ccl20. This chemokine is a major regulator of macrophage and mast cells migration and has been reported to be upregulated in other arthritic disorders [33,34]. Gruberet al. compared global gene expression profiles between discs with different Table 3 Top 10 molecules which demonstrated the highest upregulation and downregulation in treated discs.
Gene symbol Gene description Expression levels
ORM1/ORM2 Orosomucoid 1 31.714
CCL20 Chemokine (C-C motif) ligand 20 24.260
TFPI2 Tissue factor pathway inhibitor 2 23.074
IL6 Interleukin 6 21.493
MMP3 Matrix metallopeptidase 3 21.267
CYP7B1 Cytochrome P450, family 7, subfamily b, 20.756
ADAMTS5 ADAM metallopeptidase with thrombospondin type 1 motif, 5 19.843
LCN2 Lipocalin 2 18.146
PTGES Prostaglandin E 15.958
INHBA Inhibin beta-A 15.593
KRT19 Keratin 19 -26.767
ASPN Asporin -17.890
KRT8 Keratin 8 -14.161
IBSP Integrin-binding sialoprotein -12.914
COL1A2 Collagen, type I, alpha 2 -10.794
Lyz1/Lyz2 Lysozyme -8.718
H19 Imprinted maternally expressed transcript -8.222
COL1A1 Collagen, type I, alpha 1 -7.395
IGF1 Insulin-like growth factor 1 -6.578
degrees of degeneration and found broad changes in gene expression patterns, both with respect to the large number of affected genes and the variety of known functions [29]. In contrast to the present study, few of the 47 genes identified by Gruberet al. to be differen-tially expressed had known roles in disc degeneration. In another study evaluating differences between disc
[image:9.595.59.539.87.571.2]tissue harvested immediately post-mortem from patients without known spinal pathology and tissue harvested from patients with degenerative discs, Zhanget al. [30] reported more than 500 differentially expressed genes. Consistent with the results from our study, Zhang and colleagues reported a significant upregulation of two known regulators of disc degeneration:Mmp3 (3-fold)
Figure 3Functional gene networks identified using Ingenuity Pathway Analysis (IPA) from differentially expressed genes between the control and treated discs.(A)Network-1: cell death, cell cycle, and DNA replication, recombination, and repair (score 31).(B)Network-2: cellular growth and proliferation, tissue development, and cancer (score 27). Node color indicates degree of overexpression (red) and the degree of downregulation (green). Colored nodes represent genes of focus, whereas genes in uncolored nodes were not identified as being
and Il-6 (2.5-fold). Finally, Gruber et al. [31] recently utilized microarray analysis and found more than 4,500 differentially expressed genes between early and advanced stages of disc degeneration. Moreover, the authors identified 23 with known roles in the homeosta-sis of the ECM including collagen subunits, Aggrecan,
Adamtsand metalloproteinase inhibitor 3 (Timp3).
[image:10.595.59.539.87.585.2]Certain genes identified in our screen have previously been studied for their role in the pathobiology of inter-vertebral disc degeneration. Moreover, the similarity with the previously identified expression patterns in human disc degeneration suggests that our model accu-rately recapitulates natural disc degeneration. IL-6 is an inflammatory cytokine that has been associated with
disc herniation and discogenic pain in clinical studies [35,36] but has been less well characterized with respect to its cellular function compared to other inflammatory mediators such as IL-1 or TNF-a. Studer et al. [37], recently described contribution of IL-6 in the presence of soluble IL-6 receptor (sIL-6R) in amplification of the inflammatory response to IL-1 and TNF-a in NP cells. The authors suggested that in the NP, IL-6/sIL-R path-way may play a role in potentiating specific functions of IL-1 and TNF-asuch as downregulation of matrix pro-duction and upregulation of prostaglandins and MMP3. We found that both Mmp3 and Adamts5 were highly upregulated in our model. MMP3 is an extracellular zinc-dependent proteinase involved in digestion of non-collagen matrix proteins and regulates ECM homeostasis in healthy discs. Upregulation of Mmp3, however, is associated with excessive degradation of the ECM, ulti-mately depleting the hydrophilic nature of the NP and the associated ability to distribute compressive load. Similarly, the ADAMTS peptidases that degrade impor-tant proteoglycans including aggrecan [10,38] are shown to be upregulated in degenerative discs by both Le Mai-treet al. [39] and Pockertet al. [40]. SDC4 is a cell sur-face proteoglycan that has been shown to be essential in
activation of the ADAMTS5 within the intervertebral disc, thereby serving as an important regulator of ECM homeostasis [10]. Our study found substantial upregula-tion ofSdc4, confirming the important roleAdamtsplay in ECM regulation during disc degeneration. It is impor-tant to comment that there is a strong correlation between expression of senescent biomarkers and increased gene expression of catabolic-degrading enzymes in the disc. Thus up-regulation of many of the catabolic enzymes in our model is likely a reflection of senescent cell phenotype as indicated by our SA-b-gal staining [26].
[image:11.595.59.539.88.385.2]Disc degeneration also affects synthesis of ECM pro-teins. Collagen I is an important structural protein within the disc, particularly in the AF, which must resist high tensile loads to maintain the disc shape and spine alignment during axial loading. Disc degeneration is typically associated with an upregulation of collagen I that leads to a loss of compliance and hardening of the NP. Interestingly, we found downregulation of two col-lagen I alpha chains, contrary to what would be expected. Although downregulation of collagen II and upregulation of collagen I is eventually seen in a degen-erative IVD, one explanation for these findings is that
the initial reparative attempts by the IVD normalize ECM expression patterns, which only later become irre-vocably altered.
Downregulation of asporin in the treated cells was also contrary to expectations. Asporin was found to be expressed at higher levels in human discs with more advanced degeneration at both the protein and mRNA level [41]. Furthermore, expression of a particular asporin allele (D14) has been associated with the devel-opment of disc degeneration in both Chinese and Japa-nese populations [42]. Little, however, is known about the molecular basis for these findings as the role of asporin in the IVD has not been thoroughly character-ized. Further understanding of the role of this molecule in disc degeneration may provide greater insight into potential explanations for downregulation of asporin in organ culture models.
Other researchers have described organ culture models to study disc degeneration, but used different processes to induce degeneration. Robertset al. [18], Chenet al. [19] and Jimet al. [43] have all recently described sys-tems that utilize injections of chemolytic enzymes to degrade the ECM and induce a degenerative phenotype. Although these models result in a phenotype consistent with disc degeneration, the homology with the human intervertebral disc degenerative process is questionable as there is little evidence that the nonspecific global chemo-lysis is the driving force behind human IVD degeneration [29,30,43]. More work is needed to establish whether the use of such enzymes is an appropriate way to induce structural degeneration and inflammation for use in modeling human disc degeneration. Similarly, many organ culture models are based on needle puncture and may be limited by this mechanism of disc injury. Annular needle puncture in animal models and humans results in clinically significant iatrogenic disc degeneration, how-ever, it is unclear whether this model is an accurate representation of disc degeneration commonly seen in humans [44,45] that does not occur via this mechanism. In contrast, induction of disc degeneration using IL-1b and TNF-amimics the pathways that drive inflammatory processes and disease phenotype in humans.
Conclusions
Our results clearly demonstrate a widespread differential regulation of genes largely consistent with previous research into the molecular basis of disc degeneration. Furthermore, results from our study found differential expression in many genes known to be mediators of inflammatory processes associated with disc degenera-tion and regulators of extracellular matrix producdegenera-tion. Taken together, these findings suggest that the rat organ culture model described can be used for further studies designed to better understand the etiology of disc
degeneration and evaluate potential therapeutic treatments.
Additional material
Additional file 1: Figure S1. Senescence-associatedb-galactosidase staining of rat nucleus pulposus (NP) cells following treatment with
TNF-aand IL-1bfor 10 days. The result indicates that the number of SA-b -gal-positive NP cells is increased in the experimental(B)versus the control group(A).
Abbreviations
ADAMTS5: a disintegrin and metalloproteinase with thrombospondin motifs 5; AF: annulus fibrosus; ASPN: asporin; CCL20: chemokine (C-C motif) ligand 20; COL1A1: collagen type I alpha-1; COL1A2: collagen type I alpha-2; Ctr.: control group; DMEM: Dulbecco’s modified Eagle medium; ECM: extracellular matrix; EDTA: ethylenediaminetetraacetic acid; Exp.: experimental group; FBS: fetal bovine serum; Hprt1: hypoxanthine phosphoribosyltransferase 1; IL-1β: interleukin-1beta; IL-6: interleukin-6; IGF1: insulin-like growth factor 1; IPA: Ingenuity Pathway Analysis; IVD: intervertebral disc; KRT19: Keratin 19; LBP: low back pain; MMP3: matrix metallopeptidase 3; NP: nucleus pulposus; PBS: phosphate-buffered saline; RT-PCR: reverse transcription-polymerase chain reaction; SDC-4: Syndecan-4; sIL-6R: soluble IL-6 receptor; TIMP3: metalloproteinase inhibitor 3;TNF-α: tumor necrosis factor-alpha.
Competing interests
TJA receives royalties from Biomet, Inc. (Parsippany, NJ, USA). HBM is employed by Biomet, Inc. (Parsippany, NJ, USA). The other authors declare that they have no competing interests.
Authors’contributions
DZM and SA carried out the experimental work, analyzed the data and drafted the manuscript.
CKK helped design the studies, secured funding and co-wrote the manuscript. HBM, ARV, IMS, DGA, and TJA helped design the study and prepare the final manuscript. MVR designed the study, helped analyze the data, secured funding and co-wrote the manuscript. All authors read and approved the final manuscript.
Acknowledgements
This work was supported by a research grant from Biomet, Inc. and grants from the National Institutes of Health (AR050087 and AR055655 to MR). The authors would like to thank the TJU Cancer Genomics Facility staff (Kimmel Cancer Center, Thomas Jefferson University) for their contributions related to the microarray experimentation.
Authors’details
1
Department of Orthopaedic Surgery, Thomas Jefferson University, 1015 Walnut Street, Philadelphia, PA 19107, USA.2Department of Cancer Biology,
Kimmel Cancer Center, Thomas Jefferson University, 233 South 10th Street, Philadelphia, PA 19107, USA.3Department of Orthopaedic Surgery, Rothman
Institute, 925 Chestnut Street, Philadelphia, PA 19107, USA.4Biomet Spine,
Biomet Inc., 100 Interpace Parkway, Parsippany, NJ 07054, USA.
Received: 29 November 2012 Revised: 26 April 2013 Accepted: 16 September 2013 Published: 16 September 2013
References
1. Kuslich SD, Ulstrom CL, Michael CJ:The tissue origin of low back pain and sciatica: areport of pain response to tissue stimulation during operations on the lumbar spine using local anesthesia.Orthop Clin North Am1991, 22:181-187.
2. Schwarzer AC, Aprill CN, Derby R, Fortin J, Kine G, Bogduk N:The relative contributions of the disc and zygapophyseal joint in chronic low back pain.Spine1994,19:801-806.
4. Katz JN:Lumbar disc disorders and low-back pain: socioeconomic factors and consequences.J Bone Joint Surg Am2006, ,Suppl 2:21-24. 5. Luoma K, Riihimaki H, Luukkonen R, Raininko R, Viikari-Juntura E,
Lamminen A:Low back pain in relation to lumbar disc degeneration.
Spine2000,25:487-492.
6. Takatalo J, Karppinen J, Niinimaki J, Taimela S, Nayha S, Mutanen P, Sequeiros RB, Kyllonen E, Tervonen O:Does lumbar disc degeneration on MRI associate with low back symptom severity in young Finnish adults?
Spine2011,36:2180-2189.
7. Alini M, Eisenstein SM, Ito K, Little C, Kettler AA, Masuda K, Melrose J, Ralphs J, Stokes I, Wilke HJ:Are animal models useful for studying human disc disorders/degeneration?Eur Spine J2008,17:2-19.
8. Ponnappan RK, Markova DZ, Antonio PJ, Murray HB, Vaccaro AR, Shapiro IM, Anderson DG, Albert TJ, Risbud MV:An organ culture system to model early degenerative changes of the intervertebral disc.Arthritis Res Ther
2011,13:R171.
9. Le Maitre CL, Freemont AJ, Hoyland JA:The role of interleukin-1 in the pathogenesisof human intervertebral disc degeneration.Arthritis Res Ther
2005,7:R732-745.
10. Wang J, Markova D, Anderson DG, Zheng Z, Shapiro IM, Risbud MV: TNF-alpha and IL-1beta promote a disintegrin-like and metalloprotease with thrombospondin type I motif-5-mediated aggrecan degradation through syndecan-4 in intervertebral disc.J Biol Chem2011,286:39738-39749. 11. Le Maitre CL, Hoyland JA, Freemont AJ:Catabolic cytokine expression in
human IVD degeneration: IL-1βand TNFαexpression profile.Arthritis Res Ther2007,9:R77.
12. Tian Y, Yuan W, Fujita N, Wang J, Wang H, Shapiro IM, Risbud MV: Inflammatory cytokines associated with degenerative disc disease control aggrecanase-1 (ADAMTS-4) expression in nucleus pulposus cells through MAPK and NF-κB.Am J Pathol2013,182:2310-2321.
13. Wang H, Tian Y, Wang J, Phillips KL, Binch AL, Dunn S, Cross A, Chiverton N, Zheng Z, Shapiro IM, Le Maitre CL, Risbud MV:Inflammatory cytokines induce notch signaling in nucleus pulposus cells: implications in intervertebral disc degeneration.J Biol Chem2013,288:16761-16774. 14. Fujita N, Gogate SS, Chiba K, Toyama Y, Shapiro IM, Risbud MV:Prolyl hydroxylase 3 (PHD3) modulates catabolic effects of tumor necrosis factor-α(TNF-α) on cells of the nucleus pulposus through co-activation of nuclear factorκB (NF-κB)/p65 signaling.J Biol Chem2012,
287:39942-39953.
15. Saraiya M, Nasser R, Zeng Y, Addya S, Ponnappan RK, Fortina P, Anderson DG, Albert TJ, Shapiro IM, Risbud MV:Reversine enhances generation of progenitor-like cells by dedifferentiation of annulus fibrosus cells.Tissue Eng Part A2010,16:1443-1455.
16. Thirunavukkarasu M, Addya S, Juhasz B, Pant R, Zhan L, Surrey S, Maulik G, Menon VP, Maulik N:Heterozygous disruption of Flk-1 receptor leads to myocardial ischaemia reperfusion injury in mice: application of affymetrix gene chip analysis.J Cell Mol Med2008,12:1284-1302. 17. Gene Expression Omnibus Accession viewer.[http://www.ncbi.nlm.nih.
gov/geo/query/acc.cgi?acc=GSE42611].
18. Roberts S, Menage J, Sivan S, Urban JP:Bovine explant model of degeneration of the intervertebral disc.BMC Musculoskelet Disord2008, 9:24.
19. Chen WH, Liu HY, Lo WC, Wu SC, Chi CH, Chang HY, Hsiao SH, Wu CH, Chiu WT, Chen BJ, Deng WP:Intervertebral disc regeneration in an ex vivo culture system using mesenchymal stem cells and platelet-rich plasma.Biomaterials2009,30:5523-5533.
20. Liang H, Ma SY, Feng G, Shen FH, Joshua Li X:Therapeutic effects of adenovirus-mediated growth and differentiation factor-5 in a mice disc degeneration model induced by annulus needle puncture.Spine J2010, 10:32-41.
21. Chan DD, Khan SN, Ye X, Curtiss SB, Gupta MC, Klineberg EO, Neu CP: Mechanical deformation and glycosaminoglycan content changes in a rabbit annular puncture disc degeneration model.Spine2011, 36:1438-1445.
22. Zhang H, Yang S, Wang L, Park P, La Marca F, Hollister SJ, Lin CY:Time course investigation of intervertebral disc degeneration produced by needle-stab injury of the rat caudal spine: laboratory investigation.J Neurosurg Spine2011,15:404-413.
23. Moskowitz RW, Ziv I, Denko CW, Boja B, Jones PK, Adler JH:Spondylosis in sand rats: a model of intervertebral disc degeneration and hyperostosis.
J Orthop Res1990,8:401-411.
24. Boyd LM, Richardson WJ, Allen KD, Flahiff C, Jing L, Li Y, Chen J, Setton LA: Early-onset degeneration of the intervertebral disc and vertebral end plate in mice deficient in type IX collagen.Arthritis Rheum2008, 58:164-171.
25. Li CG, Liang QQ, Zhou Q, Menga E, Cui XJ, Shu B, Zhou CJ, Shi Q, Wang YJ: A continuous observation of the degenerative process in the
intervertebral disc of Smad3 gene knock-out mice.Spine2009, 34:1363-1369.
26. Vo N, Seo HY, Robinson A, Sowa G, Bentley D, Taylor L, Studer R, Usas A, Huard J, Alber S, Watkins SC, Lee J, Coehlo P, Wang D, Loppini M, Robbins PD, Niedernhofer LJ, Kang J:Accelerated aging of intervertebral discs in a mouse model of progeria.J Orthop Res2010,28:1600-1607. 27. Millecamps M, Tajerian M, Sage EH, Stone LS:Behavioral signs of chronic
back pain in the SPARC-null mouse.Spine2011,36:95-102.
28. Le Maitre CL, Freemont AJ, Hoyland JA:Accelerated cellular senescence in degenerate intervertebral discs: a possible role in the pathogenesis of intervertebral disc degeneration.Arthritis Res Ther2007,9:R45. 29. Gruber HE, Mougeot JL, Hoelscher G, Ingram JA, Hanley EN Jr:Microarray
analysis of laser capture microdissected-anulus cells from the human intervertebral disc.Spine2007,32:1181-1187.
30. Zhang YG, Guo X, Sun Z, Jia G, Xu P, Wang S:Gene expression profiles of disc tissues and peripheral blood mononuclear cells from patients with degenerative discs.J Bone Miner Metab2010,28:209-219.
31. Gruber HE, Hoelscher GL, Ingram JA, Bethea S, Zinchenko N, Hanley EN Jr: Variations in aggrecan localization and gene expression patterns characterize increasing stages of human intervertebral disk degeneration.Exp Mol Pathol2011,91:534-539.
32. Wang J, Tian Y, Phillips KL, Chiverton N, Haddock G, Bunning RA, Cross AK, Shapiro IM, Le Maitre CL, Risbud MV:Tumor necrosis factorα- and interleukin-1β-dependent induction of CCL3 expression by nucleus pulposus cells promotes macrophage migration through CCR1.Arthritis Rheum2013,65:832-842.
33. Kawashiri SY, Kawakami A, Iwamoto N, Fujikawa K, Aramaki T, Tamai M, Arima K, Kamachi M, Yamasaki S, Nakamura H, Tsurumoto T, Kono M, Shindo H, Ida H, Origuchi T, Eguchi K:Proinflammatory cytokines synergistically enhance the production of chemokine ligand 20 (CCL20) from rheumatoid fibroblast-like synovial cells in vitro and serum CCL20 is reduced in vivo by biologic disease-modifying antirheumatic drugs.J Rheumatol2009,36:2397-2402.
34. Tanida S, Yoshitomi H, Nishitani K, Ishikawa M, Kitaori T, Ito H, Nakamura T: CCL20 produced in the cytokine network of rheumatoid arthritis recruits CCR6+ mononuclear cells and enhances the production of IL-6.Cytokine
2009,47:112-118.
35. Burke JG, Watson RW, McCormack D, Dowling FE, Walsh MG, Fitzpatrick JM: Intervertebral discs which cause low back pain secrete high levels of proinflammatory mediators.J Bone Joint Surg Br2002,84:196-201. 36. Specchia N, Pagnotta A, Toesca A, Greco F:Cytokines and growth factors
in the protruded intervertebral disc of the lumbar spine.Eur Spine J
2002,11:145-151.
37. Studer RK, Vo N, Sowa G, Ondeck C, Kang J:Human nucleus pulposus cells react to IL-6: independent actions and amplification of response to IL-1 and TNF-alpha.Spine2011,36:593-599.
38. Tian Y, Yuan W, Fujita N, Wang J, Wang H, Shapiro IM, Risbud MV: Inflammatory cytokines associated with degenerative disc disease control aggrecanase-1 (ADAMTS-4) expression in nucleus pulposus cells through MAPK and NF-κB.Am J Pathol2013,182:2310-2321.
39. Le Maitre CL, Freemont AJ, Hoyland JA:Localization of degradative enzymes and their inhibitors in the degenerate human intervertebral disc.J Pathol2004,204:47-54.
40. Pockert AJ, Richardson SM, Le Maitre CL, Lyon M, Deakin JA, Buttle DJ, Freemont AJ, Hoyland JA:Modified expression of the ADAMTS enzymes and tissue inhibitor of metalloproteinases 3 during human intervertebral disc degeneration.Arthritis Rheum2009,60:482-491.
41. Gruber HE, Ingram JA, Hoelscher GL, Zinchenko N, Hanley EN, Sun Y: Asporin, a susceptibility gene in osteoarthritis, is expressed at higher levels in the more degenerate human intervertebral disc.Arthritis Res Ther2009,11:R47.
43. Jim B, Steffen T, Moir J, Roughley P, Haglund L:Development of an intact intervertebral disc organ culture system in which degeneration can be induced as a prelude to studying repair potential.Eur Spine J2011, 20:1244-1254.
44. Illien-Junger S, Pattappa G, Peroglio M, Benneker LM, Stoddart MJ, Sakai D, Mochida J, Grad S, Alini M:Homing of mesenchymal stem cells in induced degenerative intervertebral discs in a whole organ culture system.Spine2012,37:1865-1873.
45. Korecki CL, Costi JJ, Iatridis JC:Needle puncture injury affects intervertebral disc mechanics and biology in an organ culture model.
Spine2008,33:235-241.
doi:10.1186/ar4301
Cite this article as:Markovaet al.:An organ culture system to model early degenerative changes of the intervertebral disc II: profiling global gene expression changes.Arthritis Research & Therapy201315:R121.
Submit your next manuscript to BioMed Central and take full advantage of:
• Convenient online submission
• Thorough peer review
• No space constraints or color figure charges
• Immediate publication on acceptance
• Inclusion in PubMed, CAS, Scopus and Google Scholar
• Research which is freely available for redistribution