International Journal of Emerging Technology and Advanced Engineering
Website: www.ijetae.com (ISSN 2250-2459,ISO 9001:2008 Certified Journal, Volume 3, Issue 6, June 2013)
241
Tractography of Multiple Fibre Orientation in Diffusion
Tensor Imaging using Automatic Relevance Determination
N. Herald Anantha Rufus
1, D. Selvathi
21Assistant professor, Udaya school of Engineering, Vellamodi, India
2
Professor, MEPCO SCHLENK Engineering College, Sivakasi, India
Abstract—Diffusion tensor imaging (DTI) has become an indispensable tool for studying white matter both in normal populations and in populations with brain disorders. This paper describes a direct extension of diffusion spectrum magnetic resonance image tractography of multiple fibre orientation. Using this data the on line selection of number of fibre orientations supported by the data at each voxel are performed, simplifying the problem of tracking in a multi-orientation field. The multi fiber approach has a direct
equivalent in the single fiber case, but it can be able to assess
the advantages of increasing the local model complexity, while other factors remain constant. The dominant pathway from a region remains the same between single- and multi-fibre approaches, but the multi-fibre approach is more sensitive to secondary or subordinate pathways.
Keywords— Diffusion tensor imaging, Diffusion spectrum imaging, Segmentation, Tractography, White matter.
I. INTRODUCTION
Diffusion Tensor magnetic resonance imaging (DTMRI) is a technique for the measurement of the random thermal motion of water molecules in live tissues. The fibre structures restrict this diffusive motion in the tissues like white matter of the central nervous system. Thus the resulting diffusion is maximal along the orientation(s) of the underlying fibre(s)[1]. To infer the presence and geometry of white matter fibres, the diffusion MRI signal can be used.
DTI has proven very great success in depicting in vivo
the intricate architecture of white matter[2] as well as in providing quantitative imaging measures indicative of white matter integrity [3]. Using such measures, most commonly fractional anisotropy (FA) and mean diffusivity (MD), whole-brain voxel-based analysis have been used traditionally to identify the differences in white matter microstructures across the populations of interest [4-7].
The different reports of novel brain structure–function relationships are increasing as neuroimaging methods are developed which relates the patterns of brain white matter connectivity to cognitive processes [8, 9].
The techniques for studying and analyzing, these two different types of data have been evolving rapidly, but separately, and there have been no systematic studies attempting to interrogate DTI tractography patterns in the context of human intracranial EEG data.
The Diffusion Weighted Images are usually collected along several non-collinear directions for diffusion tensor imaging (DTI), and used to estimate the apparent diffusion coefficient (ADC), diffusion anisotropy, e.g. fractional anisotropy (FA), other measures of anisotropy, or carry out fiber tractography. If motion induced signal reduction results in an overestimation of the ADC along one or more diffusion encoding directions, the 3-dimensional diffusion profile, along with the above mentioned measures (e.g. FA), will be estimated inaccurately. In addition to the erroneous estimation of the diffusion properties in a given individual, these biases can propagate to group level comparisons if, by chance, the images of one group suffer more pulsation artifacts than the images of the other group. However, these examples, and many others, exist at a spatial resolution that is available to DTI tractography.
International Journal of Emerging Technology and Advanced Engineering
Website: www.ijetae.com (ISSN 2250-2459,ISO 9001:2008 Certified Journal, Volume 3, Issue 6, June 2013)
242 These techniques have been made to include such complex fibre information into both deterministic and probabilistic [12] tractography techniques, the existing results including pathways from cerebral peduncle to the entire motor strip. This paper describes a direct extension of a previously published probabilistic tractography routine[19] to the case of multiple fibre orientations in each voxel.
This propose an online Bayesian method for assessing the most appropriate number of fibre orientations for the data at each voxel, and carry out probabilistic tractography through these complex orientation fields. Because this multi-fibre approach has a direct equivalent in the single fibre case, able to assess the advantages of increasing the local model complexity, while other factors remain constant. Here the result found that, in general, the dominant pathway from a region remains the same between single- and multi-fibre approaches, but it shows a number of examples where the multi-fibre approach is more sensitive to secondary or subordinate pathways.
II. METHODS
A. Signal model
Signal model is described in [14]and[19]. It is a partial
volume model, where the diffusion-weighted MR signal is split into an infinitely anisotropic component for each fibre orientation, and a single isotropic component. Unlike [19], here, on multiple fibre orientations are performed.
Each diffusion-weighted measurement of the predicted signal at each voxel is:
∑
∑ (
)
(1)
Where S0 is the non-diffusion-weighted signal value, d is
the diffusivity, bi and ri are the b-value and gradient
direction associated with the ith acquisition, and fj and
are the fraction of signal contributed by, and
anisotropic diffusion tensor along, the jth fibre orientation
(θj, ϕj), and N is the maximum number of fibres. That is, A
is fixed as:
(
)
(2)
and Rj rotates A to (θj, ϕj). The noise is modelled
separately for each voxel as independently identically distributed (IID) Gaussian with a mean of zero and standard deviation across acquisitions of σ.
As in [19], Bayesian estimation is used to fit the parameters of this model to the signal at each voxel. However, there is a slight twist. This is necessary to infer multiple fibre populations when there is evidence in the data that they exist. In voxels which truly only support a single fibre orientation (such as medial callosal voxels), fitting a more complex model to the data may lead to poor estimation of the true fibre orientation and its uncertainty, and will, in any case, provide practical problems for tractography. Second fibre orientations will be followed when they do not truly exist. This problem can be solved using a Bayesian trick known as automatic relevance determination (ARD), or shrinkage priors, which were originally devised in the field of Neural Networks, but have since been used in neuroimaging.
B. Automatic relevance determination
Automatic relevance determination is different from other model selection techniques, as it does not fit different models to the data separately, and compare them on the basis of a metric reflecting data fit and model complexity. Instead, ARD fits the more complex model, but ensures that parameters that are not supported by the data, do not contribute to the likelihood (by ensuring that, in the posterior distribution, they take the value zero with very low variance). ARD can be applied to many different parameters within a model, and each ARD will act independently on its own particular parameter. A major advantage of ARD is that it only requires a single model to be fit to the data (as opposed to fitting every candidate model and comparing). Each parameter that is subject to ARD is then selected or deselected (forced to zero) depending on whether it is supported in the data.
Technically, this is achieved by placing a prior distribution on a parameter in a Bayesian model, which will force that parameter to take the value zero if, and only if, there is no evidence in the data for its existence. This prior distribution can take a number of forms. However, the most common of these is a Gaussian distribution with mean zero, but unknown variance. The variance is then estimated as a further parameter. If there is no evidence in the data for the existence of the original parameter, this variance term will be estimated very small, forcing the original parameter to zero. However, if the original parameter is supported by the data, the extra variance term will be estimated large, allowing the original parameter freedom to take any value.
International Journal of Emerging Technology and Advanced Engineering
Website: www.ijetae.com (ISSN 2250-2459,ISO 9001:2008 Certified Journal, Volume 3, Issue 6, June 2013)
243 If the original parameter does not contribute to the data, it will not reduce the likelihood energy, the prior energy will take over, the new variance will shrink to zero, and, with it, so will the original parameter. The trade-off is between the potential reduction in likelihood energy available from the better fit to the data afforded by the extra parameter, and the potential reduction in prior energy available from having low variance when the parameter is close to zero. ARD cannot work in the context of point estimation schemes (for example, finding the parameters which maximize the joint posterior probability), as there is a singularity when the prior variance is 0 (generating
infinite negative energy). ARD relies on the
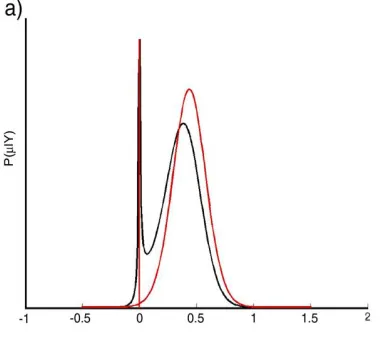
marginalisation over hyperparameters that is built in to any fully Bayesian estimation scheme. The Automatic Relevance Determination is a prior on µ and it will force µ to zero if the µ is not supported by the data. So it would not contribute to the likelihood function. In any case if µ is supported by the data then the posterior distribution on µ will be weighted at zero. Fig 1(a) shows the distribution for data comprising nearly 30 random samples with mean and variance 0.5 and 1 respectively.
C. ARD on constrained parameters
The ARD parameters must be constrained in between 0 and 1. Therefore, instead of using a Gaussian Distribution with an unknown variance, Beta Distribution with mode at 0 and an unknown width can be used.
Fig.1. (a) Marginal posterior distribution on μ for true model averaging (red), and ARD approximation (black). (b) Effective prior
distribution given by standard Gaussian ARD (red), and range-limited Beta ARD (black) in the range [0 1].
( | ) ( | ) ∫ (3)
|
|
∫ ∫
σ
σ
(4)∫
σ
σ (5)
|
~ β (1,
(6)
P(
~
-1 (7)Where, again, a reference prior for can be used . Integrate over to give the effective prior distribution on fi, gives: P(
(8)
Similarly, integrate out the variance parameter from a standard Gaussian ARD prior (from Eq. (7)) gives: P( )= | | (9)
These two distributions can be compared in Fig. 1(b).
[image:3.612.53.243.467.640.2]International Journal of Emerging Technology and Advanced Engineering
Website: www.ijetae.com (ISSN 2250-2459,ISO 9001:2008 Certified Journal, Volume 3, Issue 6, June 2013)
244 D. Priority model
ARD has been used on the parameters represent the
volume fractions of all but the first fibre
(where
implies all fibres from 2 to N). This reveals that if there is no indication for a second or third fibre orientation in the data, the volume fraction attributed to these fibres will be forced to zero and do not apply an ARD to the first fibre in order to ensure that are directly comparable with the previously published single fibre algorithm. i.e. that any increased sensitivity seen in the results can be solely attributed to an increase in complexity in local modelling.
The prior distributions on model variables are therefore as follows:
~ U (0, (10)
~ U (0,
(11)
~ ARD (12)
) ~
) (13)
~ U (0,
(14)
P( ) = -1 (15)
For details about these priors, see[17] .And also apply
the further constraint that
∑
. This constraint is
applied easily in Markov Chain Monte Carlo, by excluding any sample in which the constraint is not met. Model estimation is performed using Metropolis Hastings Markov
Chain Monte Carlo sampling, after analytically
marginalizing over variance parameters, as in[17]. So burn in for 2000 jumps, then run the chain for a further 1000 jumps sampling every 20. Initialisation is by the log-linear
diffusion tensor fit as in[17], unless any preprocessed
neighbouring voxel has more than one existing fibre orientation. In this case parameters are initialised based on the mean values from this neighbouring voxel. At the end of this procedure, samples from the posterior probability distribution on every parameter in the model, including the orientation and volume fraction parameters from each fibre population is provided. Probabilistic tractography in a multi fibre field is performed using the same sampling scheme that was shown to sample from the global probability of connection in [17], and has also been used in [12,13], and [24] .
This scheme amounts to streamline tractography except, at each step, instead of progressing along the most likely principal diffusion direction; retrieving a sample from the posterior distribution on principal diffusion directions and progress along this same direction.
A large number of samples have been drawn as this streamline becomes a sample from the connectivity distribution. Two streamline samples arriving at the same point in space will choose different samples from the posterior distribution on local orientation at that voxel, and therefore leave along different directions, hence accounting for the uncertainty in local fibre orientation. After retrieving many number of samples, it is easy to compute the probability of the dominant streamline passing through any single region or voxel, by counting the number of streamlines that passed through that region and dividing by the total number of samples drawn. The only adaption need to make this procedure acquiescent to the multi-fibre case is, at each step, to choose from which population the orientation sample have been drawn. There are a number of available options here. Particularly saying, modeling approach as mentioned above, would be to draw a sample from a whole set of fibre orientations, and select each
orientation, i, with a probability proportional to fi at the
above said sample.
However, in a crossing fibre region, this scheme will preferentially sample the dominant fibre, independent of the previous orientation of the streamline. Instead, a scheme has been chosen that aims to maintain the orientation of the streamline, as this will allow us to track non-dominant pathways through crossing regions. Again, draw a single sample from a set of fibre orientations, examine each fibre population to confirm that the volume fraction has not been forced to zero by automatic relevance determination (threshold at 0.05). Then draw a sample from each remaining population (i.e. those have been judged to be supported by the data), and choose that sample whose orientation is closest to parallel to the preceding orientation of the streamline.
III. DATA ACQUISITION
Diffusion-weighted data were acquired on a 1.5 T Siemens Sonata scanner by using echo planar imaging (72×2 mm thick axial slices, matrix size 128×104, field of
view 256×208 mm2, giving a voxel size of 2×2×2 mm).
The diffusion weighting was sotropically distributed along
60 directions by using a b-value of 1000 s mm−2, allowing
International Journal of Emerging Technology and Advanced Engineering
Website: www.ijetae.com (ISSN 2250-2459,ISO 9001:2008 Certified Journal, Volume 3, Issue 6, June 2013)
245 Among the 12 direction data from these same data, the 12 gradient orientations have been taken that performed finest under the energy minimization scheme proposed by [25], to generate a 12 direction diffusion data set with a single non-diffusion-weighted volume. In each data set, each scan was subsequently aligned to a reference (b=0) scan using affine registration intended to maximise mutual information.
IV. RESULTS
A. Local fitting of the complex fibre model
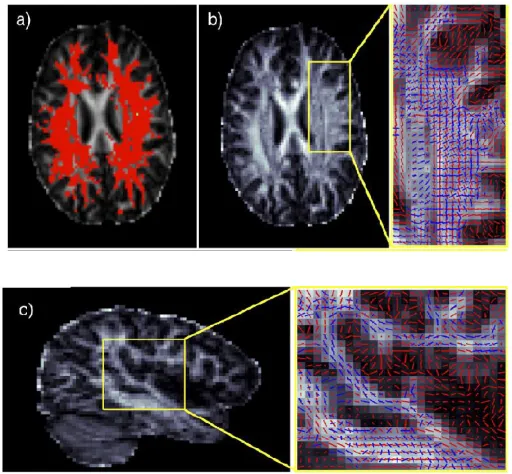
The examples for the probabilistic multi- orientation fitting is shown in fig.2. Fig.2(a) shows the complex fibre architecture. In this case the Fractional Anisotropy (FA) is greater than 0.1
[image:5.612.51.307.320.557.2]
Fig. 2. Multi-orientation fitting. (a) Axial slice showing regions where more than a single orientation were supported (thresholded at fi 0.5 after ARD-based estimation). (b and c) Axial and sagittal close ups of
crossing fibre bundles with dominant fibre orientation in red and second in blue. Directions shown are the mean vectors of the posterior
distribution samples.
Fig 2(b) and (c) show close ups in lateral portions of the brain of the crossings between the longitudinal and the medio-lateral fibres. The second fibre direction (blue) is consistent between voxels, and joins into a connected path even in fine fibre bundles (c). In human DTI data, at this crossing, the SLF dominates the motor pathways, but multiple orientations expose that the fibre populations are similar in contribution to the MR signal.
In this voxel (which is typical), the mean value of f1, f2
for the posterior distributions is 0.41 and 0.32, respectively.These numbers can be interpreted as the
relative contributions to the MR signal of the SLF (f1) and
motor (f2) projections. Note that the slight difference in
volume fractions can also be seen as a slightly wider spread in the posterior distribution on the second orientation.
B. Projections Tracking
For tracking the dominant projections, all the seven cortical regions and thalamus have been defined from population probabilistic maps with 30 % threshold. To interrogate the increased sensitivity provided by the multi fibre model, the tractography on multiple pathways with known anatomical connections have been performed. Motor pathways are defined as a seed mask as the internal capsule on a single slice (Z=6) of the MNI 152 average brain. Then defined primary motor cortex (M1) from a population probability map [23] thresholded at 30%. In each of nine subjects, 5000 samples have been drawn from the connectivity distribution for each seed voxel and retained the samples that passed through the M1 target mask. To avoid inter-hemispheric connections, samples were excluded from further analysis if they crossed the mid-sagittal plane. The same experiment is repeated exactly using single fibre tractography described in[17]. The fig.3 shows the results of the single and multi fibre
approaches.The multi-fibre approach exhibits more of the
[image:5.612.325.568.505.668.2]cortico-spinal pathways than the single-fibre approach in each subject. However, the ability to find the lateral motor projections is variable across subjects in the multi-fibre approach.
Fig. 3. Thalamic parcellation with single fibre (a) and crossing-fibre (b) tractography. Prefrontal cortex in burgundy, premotor cortex in red, primary motor cortex in light blue, primary sensory cortex in dark blue, posterior parietal cortex in orange, occipital cortex in
International Journal of Emerging Technology and Advanced Engineering
Website: www.ijetae.com (ISSN 2250-2459,ISO 9001:2008 Certified Journal, Volume 3, Issue 6, June 2013)
246 V. DISCUSSIONS
In this paper, the Tractography of multiple fibre orientation in diffusion tensor imaging using ARD is presented. Using this modelling approach, it is possible to detect white matter regions of complex fibre architecture that have previously been identified by model-free inversion approaches. Furthermore, by inferring on a model of local diffusion, this is possible to limit the regions in which multiple fibres are detected to those where the data require such a complex model. In order to perform this reduction, the automatic relevance determination in a formal Bayesian estimation scheme is used. Using a clinically feasible acquisition scheme with 60 diffusion directions, and a b-value of 1000, this is able to detect complex fibre architecture in approximately a third of voxels with an FA greater than 0.1. These approaches dramatically reduce the problem of tractography in a multi-fibre field to an extent that it is tractable to probabilistic sampling schemes. Tractography approaches that detect complex fibre architecture in every voxel, whether or not it is supported by the data, will be much more susceptible to false positive connections than approaches that infer complexity in a selective manner. Here, by using a natural extension to a single fibre tractography technique, it is able to examine directly the potential advantages of estimating complex architecture before performing tractography. Connectivity-based segmentation of thalamus which relies only on identifying the target with the highest connection probability was largely unchanged between the single and multi-fibre approaches, suggesting that the same dominant pathway is found by both approaches. Furthermore, in four separate fibre systems where non dominant pathways have previously been hard to find, we find that multi-fibre tractography is more sensitive to non-dominant projections that single fibre tractography. For example, the medial portion of the SLF was found strongly in all subjects, whereas it is invisible to single fibre approaches. However, in some cases this non-dominant projection is found with variable success and connection likelihood from subject to subject. For example, in the cortico-spinal tract, lateral projections to primary motor cortex were not found strongly in every subject . It has previously been reported that there are regions of the cortico-spinal tract where it has been possible to estimate three populations of fibres in high b-value diffusion data. It is possible that, if more diffusion directions were acquired higher b –value, more than two orientations and hence the whole cortico-spinal tract can be identified.
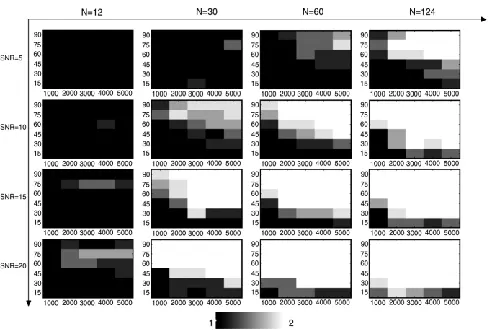
[image:6.612.324.569.218.383.2]Fig.4. and Fig.5. shows that the simulation results of two fibre crossings and three fibre crossing with different number of diffution encoding orientations. These simulations suggest that the data can resolve 2 fibre systems with an angular resolution of around 45°, but that in order to resolve a 3 fibre orthogonal system robustly; it requires b-values upwards of 4500 for different N values.
Fig. 4. Simulations of two crossing fibres with different number of diffusion encoding orientations (main x-axis), SNR (main y-axis), b-values (individual xaxes), and separation angle (individual y-axes). Simulations were repeated 5 times. Greyscale shows the average
number of fibres recovered by the estimation technique
Fig. 5. Simulations of three fibres crossing at 90° with different number of diffusion encoding orientations (main x-axis), b-values (individual x-axes), and SNR (individual y-axes). Simulations were
repeated 5 times. Greyscale shows the average number of fibres recovered by the estimation technique.
VI. CONCLUSION
International Journal of Emerging Technology and Advanced Engineering
Website: www.ijetae.com (ISSN 2250-2459,ISO 9001:2008 Certified Journal, Volume 3, Issue 6, June 2013)
247 REFERENCES
[1] Lin, C.P., Wedeen, V., Chen, J., Yao, C., Tseng, W., ― Validation of diffusion spectrum magnetic resonance axonal fiber imaging with manganese-enhanced optic tracts and ex vivo phantoms‖, NeuroImage 19,(2003) 482–495.
[2] Pajevic, S., Pierpaoli, C., ―Color schemes to represent the orientation of anisotropic tissues from diffusion tensor data: application to white matter fiber tract mapping in the human brain‖, Magn. Reson. Med. 42,(1999) 526– 540.
[3] Pierpaoli, C., Jezzard, P., Basser, P.J., Barnett, A., Chiro, G.D., ―Diffusion tensor MR imaging of the human brain‖, Radiology 201, (1996) 637–648.
[4] Buchsbaum, M.S., Friedman, J., Buchsbaum, B.R., Chu, K.-W., Hazlett, E.A., Newmark, R., Schneiderman, J.S., Torosjan, Y., Tang, C., Hot, P.R., Stewart, D., Davis, K.L., Gorman, J., 2006. Diffusion tensor imaging in schizophrenia. Biol. Psychiat. 60 (11), 1181–1187. [5] J.M.P. Martinez, R.B. Llavori, M.J.A. Cabo, and T.B. Pedersen, "Integrating Data Warehouses with Web Data: A Survey," IEEE Trans. Knowledge and Data Eng., preprint, 21 Dec. 2007, doi:10.1109/TKDE.2007.190746.(PrePrint)
[6] D.H., Thompson, A.J., ―Diffusion tractography based group m [7] apping of major white-matter pathways in the human brain‖.
NeuroImage 19 (4),(2003) 1545– 1555
[8] Simon, T.J., Ding, L., Bish, J.P., McDonald-McGinn, D.M., Zackai, E.H., Gee, J., ― Volumetric, connective and morphologic changes in the brains of children with chromosome 22q11.2 deletion syndrome: an integrative study‖. NeuroImage 25 (1),(2005) 169–180.
[9] Eriksson, S.H., Rugg-Gunn, F.J., Symms, M.R., Barker, G.J., Duncan, J.S., 2001. Diffusion tensor imaging in patients with epilepsy and malformations of cortical development. Brain 124 (March), 617–626.
[10] T.M. Ellmore, M.S. Beauchamp, J.I. Breier, J.D. Slater, G.P. Kalamangalam, T.J. O’Neill, et al., Temporal lobe white matter asymmetry and language laterality in epilepsy patients, NeuroImage 49 (3) (2010) 2033
[11] S.R. Rudebeck, J. Scholz, R. Millington, G. Rohenkohl, H. Johansen-Berg, A.C. Lee, Fornix microstructure correlates with recollection but not familiarity memory, Journal of Neuroscience 29 (47) (2009) 14987–14992.
[12] N.E. Crone, A. Sinai, A. Korzeniewska, High-frequency gamma oscillations and human brain mapping with electrocorticography, Progress in Brain Research 159 (2006) 275–295.
[13] K. Jerbi, T. Ossandon, C.M. Hamame, S. Senova, S.S. Dalal, J. Jung, et al., Task- related gamma-band dynamics from an intracerebral perspective: review and implications for surface EEG and MEG, Human Brain Mapping 30 (6) (2009) 1758–1771. [14] Tuch, David S., 2004. Q-ball imaging. Magn. Reson. Med. 52,
1358–1372 (Dec).
[15] Tuch, D.S., Reese, T.G.,Wiegell, M.R., Makris, N., Belliveau, J.W.,Wedeen, V.J., 2002. High angular resolution diffusion imaging reveals intravoxel white matter fiber heterogeneity. Magn. Reson. Med 48, 577–582.
[16] Alexander, Daniel C., 2005. Multiple-fiber reconstruction algorithms for diffusion MRI. Ann. N. Y. Acad. Sci. 1064, 113–133 (Dec).
[17] Hagmann, P., Thiran, J.-P., Jonasson, L., Vandergheynst, P., Clarke, S., Maeder, P., Meuli, R., 2003. DTI mapping of human brain connectivity: statistical fibre tracking and virtual dissection. NeuroImage 19, 545–554 (Jul).
[18] Hosey, Tim, Williams, Guy, Ansorge, Richard, 2005. Inference of multiplefiber orientations in high angular resolution diffusion imaging. Magn.Reson. Med. 54, 1480–1489 (Dec).
[19] Basser, P.J., Matiello, J., Le Bihan, D., 1994. Estimation of the effective selfdiffusion tensor from the NMR spin echo. J. Magn. Reson., Ser. B 103, 247–254.
[20] Behrens, T.E.J., Johansen-Berg, H.,Woolrich, M.W., Smith, S.M., Wheeler- Kingshott, C.A.M., Boulby, P.A., Barker, G.J., Sillery, E.L., Sheehan, K., Ciccarelli, O., Thompson, A.J., Brady, J.M., Matthews, P.M., 2003a. Non-invasive mapping of connections between human thalamus and cortex using diffusion imaging. Nat. Neurosci. 6 (7), 750–757 (Sep).
[21] Behrens, T.E.J.,Woolrich, M.W., Jenkinson, M., Johansen-Berg, H., Nunes, R.G., Clare, S., Matthews, P.M., Brady, J.M., Smith, S.M., 2003. Characterization and propagation of uncertainty in diffusion-weighted MR imaging. Magn. Reson. Med. 50, 1077–1088 (Nov). [22] Bernardo, J.M., Smith, A.F.M., 2000. Bayesian Theory. Wiley.
Catani, M., Howard, R.J., Pajevic, S., Jones, D.K., 2002. Virtual in vivo interactive dissection of white matter fasciculi in the human brain. NeuroImage 17, 77–94 (Sep).
[23] Tuch, David S., Reese, Timothy G., Wiegell, Mette R., Van Wedeen, J.,2003. Diffusion MRI of complex neural architecture. Neuron 40,885–895 (Dec).
[24] Tuch, David S., Wisco, Jonathan J., Khachaturian, Mark H., Ekstrom, Leeland B., Kotter, Rolf, Vanduffel, Wim, 2005. Q-ball imaging of macaque white matter architecture. Philos.
[25] Takahiro Makino, Shoichi Ito ⁎, Satoshi Kuwabara, ―Involvement of pontine transverse and longitudinal fibers in multiple system atrophy: A tractography-based study‖,Journal of the Neurological Sciences 303 (2011) 61–66
[26] Atira S. Bick , Arnaldo Mayer, Netta Levin, ―From research to clinical practice: Implementation of functional magnetic imaging and white matter tractography in the clinical environment‖ , Journal of the Neurological Sciences 312 (2012) 158–165
[27] M.Hasan a,n, IndikaS.Walimuni a, HumairaAbid a, KlausR.Hahn b,―Areviewofdiffusiontensormagneticresonanceimagingcomputation al methods andsoftwaretools Khader‖, Computers in Biology and Medicine 41 (2011) 1062–1072
[28] Maaike Vandermosten,, Bart Boets, Jan Wouters, Pol Ghesquièrea, ―A qualitative and quantitative review of diffusion tensor imaging studies in reading and dyslexia‖, Neuroscience and Biobehavioral Reviews 36 (2012) 1532–1552
[29] H. Goto, Y. Hasegawa, and M. Tanaka, ―Efficient Scheduling Focusing on the Duality of MPL Representation,‖ Proc. IEEE Symp. Computational Intelligence in Scheduling (SCIS ’07), pp. 57-64, Apr. 2007, doi:10.1109/SCIS.2007.367670. (Conference proceedings)
International Journal of Emerging Technology and Advanced Engineering
Website: www.ijetae.com (ISSN 2250-2459,ISO 9001:2008 Certified Journal, Volume 3, Issue 6, June 2013)
248 [31] E.E. Reber, R.L. Michell, and C.J. Carter, ―Oxygen Absorption in
the Earth’s Atmosphere,‖ Technical Report TR-0200 (420-46)-3, Aerospace Corp., Los Angeles, Calif., Nov. 1988. (Technical report with report number)
[32] L. Hubert and P. Arabie, ―Comparing Partitions,‖ J. Classification, vol. 2, no. 4, pp. 193-218, Apr. 1985. (Journal or magazine citation)