Journal of Chemical and Pharmaceutical Research, 2015, 7(12):96-107
Research Article
CODEN(USA) : JCPRC5
ISSN : 0975-7384
Systematic optimization of formulation and manufacturing method for
preparing a rapid release nisoldipine dosage form
Sandeep Kumar Vats*
1, Roop Narayan Gupta
2, Kalaiselvan Ramaraju
1and Romi Singh
1Sun Pharmaceutical Industries Limited, R&D-II, Sarhaul, Sec 18, Gurgaon, Haryana, India
Birla Institute of Technology, Mesra, Ranchi, Jharkhand, India
_____________________________________________________________________________________________
ABSTRACT
Dissolution enhancement is one of the major focus areas in drug delivery owing to increase in number of new drugs with a limited solubility. Conventional approaches to address this need include selecting suitable polymer(s) followed by optimizing various drug-polymer combinations to arrive at one providing requisite dissolution enhancement. What often lacks in such approaches is (a) evaluation of industrial feasibility to scale-up the developed solid dispersion method and (b) inclusion of solid dispersion into a suitable dosage form for convenient administration to the patient. Regulatory agencies globally are emphasizing on use of quality by design (Qbd) tools in product development. The present work focuses on devising a strategy to optimize a binary solid dispersion formulation with a limited number of statistically designed experiments (DoE) to arrive at a suitable formula and industrially doable process. Polymer screening was undertaken using phase solubility studies with a model drug, Nisoldipine. The screened polymers were evaluated at various drug-polymer ratios and two most industrially feasible methods i.e. Hot-melt extrusion (HME) and solvent evaporation. Dissolution efficiency and T90 were used as parameters for evaluation of dissolution enhancement. Solid dispersion characterization was performed using differential scanning calorimetry (DSC), Fourier transform infra-red spectroscopy (FTIR), dynamic vapor sorption (DVS) and scanning electron microscopy (SEM). Dissolution enhanced formulations were designed using Copovidone. The moisture uptake was reduced in the solid dispersion compared to Copovidone. Hot-melt extrusion was preferred as the method of preparation since it is devoid of solvent usage. The incorporation of solid dispersion at 20% drug load into a tablet resulted in a rapid release tablet dosage form with enhanced dissolution properties.
Keywords: Design of experiments, Differential vapor sorption, Hot-melt extrusion, Solid dispersion, Recrystallization
_____________________________________________________________________________________________
INTRODUCTION
process later on in the development [3]. The most promising method, with a feasibility of successful scale-up, for promoting dissolution, is the formation of solid dispersion in a proper carrier [4]. The solid dispersion technique provides a means of reducing particle size to nearly a molecular level. As the soluble carrier dissolves, the insoluble drug is exposed to the dissolution medium as very fine particles for quick dissolution and absorption [5]. Therefore, current focus of research is on the technologies that can enhance the solubility which solves many related problems. Among various factors affecting the formulation of solid dispersion, the type and quantity of a carrier system for the drug [6] and manufacturing process with scale-up considerations [7] are of prime importance. The selection of an adequate carrier system is one of the most important aspects in the formulation of solid dispersions containing high melting point drug [8]. A screening methodology to design and prepare solid dispersion based on physicochemical characteristics was reported earlier [9]. However, the literature on systematic screening of solid dispersion systems with use of design of experiments (DoE) is uncommon. The aim of present research work is to systematically study the factors affecting dissolution enhancement of a poorly soluble drug using a risk-assessment based problem solving approach as per current regulatory expectations [10, 11]. Nisoldipine, which is a calcium channel blocker (melting point ~152°C) with low and variable oral bioavailability, was used as a model drug [12]. Since this is a BCS class II drug, dissolution is the rate limiting step in its absorption after oral administration and hence an enhanced dissolution formulation would provide for improvement in bioavailability [13]. Nisoldipine is prone to photolytic degradation [14] and hence all the experiments were carried out using golden fluorescent light and analysis was carried out using low-actinic amber color glassware.
EXPERIMENTAL SECTION
Materials: Nisoldipine was purchased from Erregierre S.p.A., Italy. Inactive ingredients were sourced from JRS Pharma GMBH & Co. KG, Germany (Sodium Starch Glycolate, Explotab), FMC Biopolymer, USA (Microcrystalline cellulose, Avicel-102), Roquette, USA (Sorbitol, Neosorb P DC), BASF Corporation, USA (Kolliphor P-237, Kollidon VA-64), Ashland specialty ingredients, USA (Hydroxy ethyl cellulose, Natrosol 250L Pharm), Evonik, USA (Colloidal Silicon dioxide-Aerosil 200), Avantar performance materials USA (Stearic acid), Merck limited India (Acetone) and Cognis, Germany (Sodium lauryl sulphate-Texapon® K12 P PH). All other chemicals and solvents were of analytical grade and were used as obtained.
Phase solubility studies: Solubility measurements were performed in triplicate using the method reported by Higuchi and Connors [15]. An excess amount of Nisoldipine was added to purified water containing increasing concentrations (0-10% w/v) of Copovidone and Poloxamer. The vials were sealed and shaken at 37±0.5 °C for 72 h in a thermostatically controlled orbital shaker-cum incubator (Colton, India) and the samples were filtered through a 0.45 μm polyvinylidene fluoride (PVDF) filter. The filtrate was suitably diluted and the concentration in the solution was determined spectrophotometrically at λmax 238 nm (Shimadzu UV-2450 spectrophotometer, Japan).
Preparation of solid dispersions: Solid dispersions were prepared either by solvent evaporation or Hot-melt mixing / extrusion at the drug polymer combinations provided in table 1. Physical mixtures were also prepared by blending the drug and polymer in a mortar and sieving through 250µ sieve.
1. Solvent evaporation method [SE]: The polymer was first dissolved in acetone and drug was added to the polymer solution. The drug-polymer solution was poured on to glass trays in form of a thin film and air-dried for 6 hours. The semi-dried mass was further kept at in vacuum oven 40°C until constant mass. Subsequently, the solid dispersions were milled using a mortar-pestle and screened through a 250µ.
2. Hot-Melt mixing / extrusion [HME]: For Poloxamer solid dispersion preparation, hot-melt mixing was used. Poloxamer was melted using an oil bath followed by addition of drug to the molten polymer under continuous stirring until a homogenous dispersion formed. The melt was air-cooled and was further kept at 40°C in vacuum oven for 4 hours. The solid dispersions were subsequently pulverized using a mortar-pestle and screened through a 250µ sieve. For Copovidone, a co-rotating twin screw Hot-Melt Extruder Pharm11 (Thermo Fisher Scientific, Germany) was used. The drug and polymer were mixed geometrically and the blend was fed into extrusion chamber at a constant feed rate of 50 rpm and a powder feed rate of 200 g/hr. The length to diameter ratio was 40 and the temperature of seven heating zones starting from hopper side towards the die (2 mm round) were set at 110, 130, 150, 150, 170, 180 and 180 °C. The extruded thread was subsequently passed through an in-line milling unit. The milled extrudes were cooled to room temperature and pulverized and screened via 250µ sieve.
combinations (table 1). Dissolution efficiency and time to dissolve 90% drug (T90) in 0.1N HCl containing 0.25% sodium lauryl sulfate (SLS) /900ml/USP-II/50rpm was selected as critical quality attributes (response) and data was analyzed for significance (p<0.05) using JMP® software (version 9, SAS Inc., USA).
Preparation of tablets: Sorbitol was sifted using #30ASTM sieve. The solid dispersion equivalent to 17 mg dose of Nisoldipine was co-sifted with hydroxy ethyl cellulose and sodium starch glycolate. This solid dispersion mix was geometrically mixed with sorbitol. This blend was lubricated with a mixture of # 60 ASTM sifted stearic acid-Aerosil-200 (1:1) in a 1-liter octagonal blender at 48% occupancy for 20 minutes. The formulations are summarized in table 2. A 16-station tablet press (Cadmach, India) equipped with two 8.0 mm standard concave round (SRC) punch and die sets was used for compressing tablets of 250±5 mg (batch size 1000 tablets).
1. Physical characterization of solid dispersion:
Differential scanning calorimetry studies: The differential scanning calorimetry (DSC) patterns were generated for pure API, polymer, physical mixtures and selected solid dispersions using a DSC-60 (Shimadzu, Japan). The samples (~10 mg) were sealed in perforated aluminum pans and thermograms were obtained at heating rate of 10 °C/min in the temperature range of 40°C to 200°C in the atmosphere of nitrogen.
Fourier-transform infrared spectroscopy studies: Pure drug and prepared solid dispersions were subjected to FTIR (Pristige-21, Shimadzu-Japan) spectroscopic analysis to study the drug and carrier interaction. A finely ground, approximately 1% mixture of a solid sample in KBr was fused into a transparent disk using a hydraulic press and analyzed over the range of 4000 to 400 cm-1.
Scanning electron microscopy: The surface morphology of Nisoldipine and the selected solid dispersion formulations were obtained by means of scanning electron microscope (Jeol-JSM-5300, Tokyo, Japan). The samples were mounted on a glass stub with double-sided adhesive tape and coated under vacuum with gold in an argon atmosphere prior to observation. Micrographs with different magnifications were recorded at 25 KV to study the morphological and surface characteristics of the solid dispersions.
Dynamic Vapor Sorption: To evaluate the moisture susceptibility of the drug, polymers and solid dispersions, dynamic vapor sorption studies were performed [16]. A known amount of sample was weighed and kept in the sample holder in a controlled temperature and pressure chamber (DVS advantage, Surface Measurement Systems Ltd, UK). The change in mass was monitored with varying humidity conditions to understand the effect of moisture. All the samples were then analyzed “as is” at a constant temperature of 30°C and programmed for sorption for a period of 3 hours in each humidity condition from 0%, 30, 60, and 90%.
2. Physical characterization of rapid release tablets
Uniformity of dosage units: Nisoldipine present in the tablets was approx. 7% w/w (solid dispersion ~34%w/w). Therefore, uniformity of dosage units by a content uniformity test was used as indicated in USP <905>. The content uniformity test was performed on 10 tablets. The tablets were individually subjected to drug content determination by assay method and data analyzed to calculate the acceptance value (Limit for AV value NMT 15, as per USP)
Dissolution studies: The in-vitro dissolution behavior of pure drug, physical mixture and solid dispersion and tablets containing solid dispersion was studied using dissolution system (2100C, Distek Inc., USA) equipped with auto-sampler (Evolution 4300, Distek Inc., USA). The dissolution studies (n=3) were performed using USP Dissolution apparatus type II (paddle) in 900 ml of 0.1N HCl containing 0.25%SLS as dissolution media at 50rpm and 37±0.5ºC temperature. The dissolution test was performed for 210 minutes with 5ml sampling every 30 minutes and replaced with same volume of fresh media post each sampling. The samples were filtered using 0.45µ PVDF filter, diluted and analyzed by UV spectrophotometer at 238nm. Cumulative amount of drug dissolved in the preparations was calculated using calibration equation (with sampled volume adjustment). Dissolution efficiency and T90 were calculated from the dissolution data using DD solver application in Microsoft Excel software [17]. The model-fitting and data analysis was performed using JMP® software (version 9, SAS Inc., USA)
RESULTS AND DISCUSSION
AN-type AL-type AL-type
0.00 50.00 100.00 150.00 200.00 250.00
0 2 4 6 8 10 12
Solubilit
y (µg/ml)
[image:4.595.82.530.68.383.2]Polymer conc (%w/w)
Phase solubility study with various polymers
Fig. 1: Phase solubility studies of Nisoldipine with (●) PVP K-30 (■) Poloxamer (▲) Copovidone
It indicates that the solubility was enhanced as a function of polymer concentration in the following order Copovidone > Poloxamer > PVP. With PVP, there was an initial increase in solubility but steadies afterwards. The trend line was fitting into a second-order polynomial equation (AN-type solubility curve, y=-0.511x2+8.7227x+5.3214, R² = 0.9840). The dissolution enhancement due to Poloxamer can be due to the surfactant properties which increased the wettability of the drug particles. Abrupt increase in solubility beyond 1% concentration might be due to increased solubilization after the critical micelle concentration. An AL-type phase solubility curve was seen with Poloxamer and trend line followed a linear model (y=12.843x+3.0855, R² = 0.9978). This highest increase in solubility with Copovidone (Poly vinyl pyrrolidone with 40% vinyl acetate) can be attributed to better drug-polymer interaction owing to vinyl acetate moieties facilitating solubilization. An AL-type phase solubility curve was seen with Copovidone (Linear model, y=20.947x+6.6696, R² = 0.9869).
Based on this screening study data, only Poloxamer and Copovidone were selected for optimization studies.
Data analysis for polymer ratio and mfg. method optimization: The factorial design, a commonly used statistical approach for planning and optimization of experimental series, was used [18]. The experimental runs along with the factors, their levels studied and the output measured for a 2x3x2 full-factorial design used are shown in table 1.
Dissolution in 0.1N HCl containing 0.25% sodium lauryl sulphate was selected as a medium to study drug release. Drug/physical mixture/solid dispersion equivalent to 17 mg of Nisoldipine was used for the dissolution studies. Dissolution efficiency (DE) denotes the area under the drug release-time curve and its higher values indicates comparatively better dissolution enhancement [19]. T90 indicates the time required for 90% drug release. The lower the T90 value better is the dissolution enhancement. These parameters were selected since these provide clear-cut indication on the dissolution enhancement ability of the given drug-polymer system and method of preparation. T90 and DE were calculated from the dissolution data, using DD-Solver, an MS-Excel add-in software package, which is designed to analyse data obtained from dissolution experiments [17]. Dissolution rate constants were determined and T90 was calculated using first order rate constant [20]. The data analysis was carried out to understand the level of significance of factors and interactions between them to influence the responses (T90 and DE).
Table-1: Design of experiments for optimization of solid dispersion formula and process
Pattern Polymer
type Drug load (%)
Mfg. method
Dissolution Efficiency (%)
T90 (min)
221 Poloxamer 20 SE 72.2 125.0
121 Copovidone 20 SE 91.8 48.4
222 Poloxamer 20 Mel 68.8 147.9
231 Poloxamer 50 SE 50.4 326.2
132 Copovidone 50 Mel 54.4 281.4
112 Copovidone 10 Mel 92.3 25.0
232 Poloxamer 50 Mel 48.4 343.5
212 Poloxamer 10 Mel 80.5 90.8
122 Copovidone 20 Mel 86.7 60.9
211 Poloxamer 10 SE 83.9 74.9
131 Copovidone 50 SE 57.3 248.8
111 Copovidone 10 SE 96.3 14.9
SE-Solvent evaporation, Mel-Melting by HME, T90- Time corresponding to 90% dissolution
Table-2: Statistical observations from the data analysis of dissolution response (DE and T90)
Response Dissolution Efficiency (%DE) T90 Summary of Fit
R2 0.988 0.993
R2 Adj. 0.973 0.985
RMSE 2.874 14.66
ANOVA
DF-Model 6 6
DF-Error 5 5
F-Ratio 66.818 121.25
p-value 0.0001 <0.0001
Sorted parameter estimates
Term Estimate ± SE p-value Estimate ± SE p-value Polymer type (Copovidone) 6.21 ± 0.830 p =0.0007 -35.742 ± 4.232 P=0.0004 Drug polymer ratio -0.895 ± 0.049 p<0.0001 6.353 ± 0.249 p<0.0001 Mfg. method -1.733 ± 0.830 p=0.0910 9.275 ± 4.232 p=0.0799 Polymer type x DP ratio -0.102 ± 0.049 P=0.0919 -0.020 ± 0.249 p=0.9406 DP-ratio x Mfg. method 0.018 ± 0.049 p=0.7140 0.143 ± 0.249 p=0.5911 Polymer type x Mfg. method -0.267 ± 0.830 p=0.7609 -0.075 ± 4.232 p=0.9865
ANOVA-Analysis of variance, Adj.-adjusted, SE-Standard error, RMSE- Root mean square error, DF- Degrees of freedom F-ratio
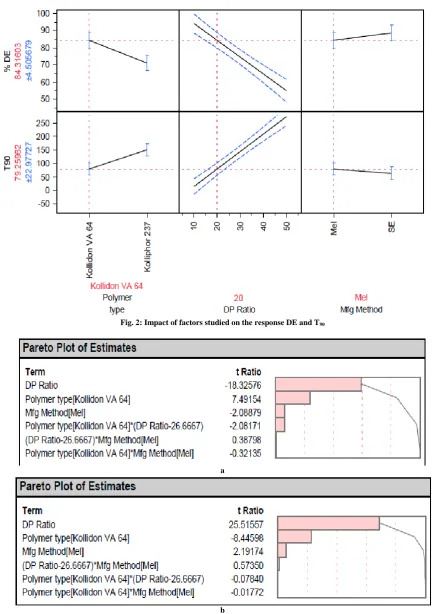
To understand the effect of changing polymer type, drug polymer ratio and method of solid dispersion preparation on the DE and T90, the data was plotted against the variables as shown in the least square-fit prediction profiler (fig. 2).
Fig. 2: Impact of factors studied on the response DE and T90
a
[image:6.595.99.516.384.677.2]b
Fig. 3: Effect screening by Pareto plot of estimates for (a) DE (b) T90
Influence of different drug: carrier ratios on DE and T90: The prediction profiler (fig. 2) indicates that drug polymer ratio have profound influence on the T90 and DE. Increasing the drug polymer ratio resulted in decrease in T90. The method of preparation did not significantly change the T90 and it was least with Copovidone among the polymers studied. The T90 value was as low as 15 minutes with 1:10 drug to Copovidone ratio. The dissolution efficiency increased as the polymer content with respect to drug was increased. However, it was >80% even for 1:4 drug-polymer ratio. This may be due to drug polymer interaction and solubilization of the drug in polymer dissolving microenvironment.
Influence of the method of preparation on the DE and T90: The method of preparation can impact the ability of polymer and drug to polymer ratio to influence the dissolution. This also has an impact on the industrial feasibility of the selected method [18] and therefore this was included in this screening study. However, the prediction profiler (fig.2) as well as the Pareto-plot of estimates (fig. 3) indicated that the impact of manufacturing method was not significant (p>0.05).
Physicochemical characterization of the solid dispersion formulation: The solid dispersion preparations were characterized for drug content which was found to be 97.5 to 102.8%. The optimized formulations were subjected to DSC, FTIR and SEM studies.
Differential scanning calorimetrical studies: In order to study the transformation of the drug, during solid dispersion preparation and to represent the thermal behaviour of the solid dispersion Differential scanning calorimetry (DSC) was used (fig. 4). The thermogram for pure drug shows a sharp endothermic peak at 154°C which corresponds to the melting point of crystalline nisoldipine. A similar peak was observed in the physical mixture indicating that the physical mixture does not alter the drug properties. The reduced heat of fusion (indicated by low peak area compared to pure drug), is due to the mixing of polymer in the physical mixture. The optimized solid dispersion formulation does not show any melting endothermic peak indicating that the drug exists in amorphous or molecular dispersion form in the solid dispersion formulation at 1:4 drug-polymer ratio with copovidone. Similar observations were reported earlier [13]. A very small and broader endotherm at 80-100°C is due to moisture evaporation.
Fig. 4: DSC thermogram of (a) solid dispersion with Copovidone (1:4) (b) drug (c) physical mixture (1:4)
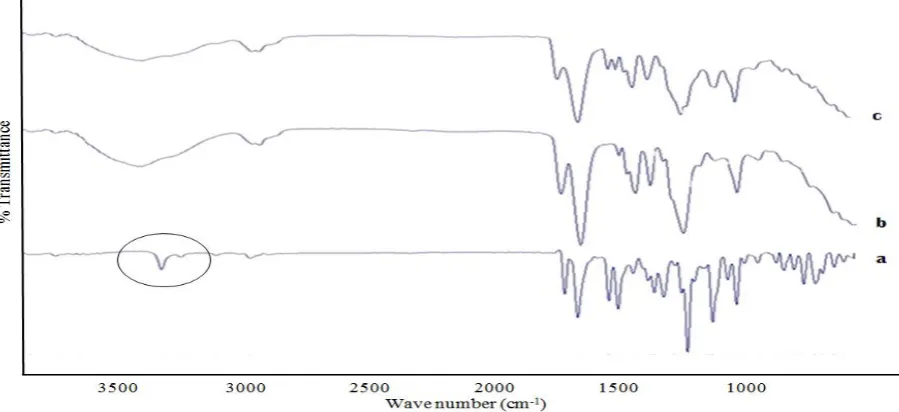
Fourier-transform infrared spectroscopy (FTIR):
Fig.7: FTIR spectra of (a) Nisoldipine (b) Copovidone (c) Solid dispersion with Copovidone (1:4)
Nisoldipine shows a sharp absorption band at 3321 cm-1 due to stretching of N-H group of the dihydropyrimidine (DHP) moiety as shown in chemical structure in fig. 6.
Nisodipine Copovidone Poloxamer
Fig. 6: Chemical structure for drug and polymers
The band at 2967 is due to Csp3-H stretching and the band at 3102 cm -1
can be attributed to Csp2-H stretching. The two strong absorption bands at 1656 and 1706 cm-1 can be attributed to the carbonyl groups of the two side chain in the structure of DHP (C =N and C=O stretching respectively). The N = O asymmetrical stretching produced band at 1531 cm-1 and N = O symmetrical stretching produced band at 1349 cm-1. The band at 1493 cm-1 is for aromatic C=C bond. The two bands at 1215 and 1116 cm-1 are due to C–O stretching. The FTIR spectrum of Poloxamer showed a broad band at 3460 cm-1 which is due to the O–H group and a strong band at 2880 cm-1 due to aliphatic C– H bond. The C–O bond stretching appeared at 1112 cm-1. This correlates well with the published spectrum for Poloxamer [23, 24]. The spectra of solid dispersion with Copovidone indicate peak broadening in the N-H stretching region. This can be attributed to the hydrogen boding between N-H group of the dihydropyrimidine moiety and the amide function / ester function of the Copovidone polymer.
Scanning electron microscope analysis (SEM):
a b c
Fig. 7 a. Microscopy of (a) Nisoldipine and SEM pictomicrograph of (b) Solid dispersion (1:4) with Copovidone (c) Solid dispersion (1:4) with Poloxamer
Dynamic Vapor Sorption: DVS is a robust and efficient throughput method for hygroscopicity determination and utilizes less sample and time. It involves determination of weight change for a sample purged with humid nitrogen under isothermal conditions. The equilibration time for water sorption in this method is much shorter than that in desiccators, which are used in the conventional methods. This is because of the small sample size and the continuous purge of gas to maintain a defined humidity level [25].
0 1 2 3 4 5 6 7 8 9 10
0 10 20 30 40 50 60 70 80
C
h
an
ge
in
m
ass %
-Dr
y
[image:9.595.123.490.308.508.2]Relative humidity (%RH)
DVS Isotherm plot
Fig. 8: Dynamic vapor sorption plot of (♦) Nisoldipine (▲) Poloxamer (■) Copovidone (×) Solid dispersion (1:4) with Poloxamer (●) Solid dispersion (1:4) with Copovidone
As seen in fig. 8, the % change in weight of Nisoldipine was less than 0.2% at 75% relative humidity indicating that it is non-hygroscopic drug. For Poloxamer, the % change in weight up to 50% RH is very less and there is a rapid increase at 75% RH. This might be due to moisture induced phase changes, an observation similar to literature reports [26]. The solid dispersion with Poloxamer showed similar observation indicating that humidity will not play a crucial role in determining the amorphous nature of Nisoldipine in the solid dispersion formulation. Copovidone absorbs moisture (approx. 9% increases in weight). However, the solid dispersion containing Copovidone, showed decreased moisture uptake. This might be due to the hydrogen bonding between Copovidone and drug due to which the potential water binding sites are occupied. The DVS data further guided in pack selection (heavy HDPE bottle) for storing solid dispersion preparations.
Evaluation of powder blends of solid dispersion for compression
Characterization of rapid release tablets
The tablets were compressed on a 16-station rotary using two standard round concave, 8mm punch and die sets. The composition is provided in the table 3.
Table 3: Composition and characterization data for rapid release tablets containing solid dispersion
INGREDIENTS CONTROL SD with Poloxamer SD with Copovidone
mg/tab mg/tab mg/tab Nisoldipine / Solid dispersion 17.0 85.0 85.0
Sorbitol 111.6 43.6 43.6
Sodium starch glycolate 97.1 97.1 97.1 Hydroxyethyl cellulose 17.0 17.0 17.0
Stearic acid 3.6 3.6 3.6
Aerosil-200 3.6 3.6 3.6
Tablet weight 250.0 250.0 245.5
Friability (%) 0.05 0.08 0.11
Assay (%) 99.8±1.5 99.2±1.5 101.5±1.4
Uniformity of dosage units (AV value) 9.8 4.7 5.2
The compressed tablets were uniform in weight with deviation from average weight less than 1%) indicating uniformity in dosage units. Due to low drug load in the formulation, blend and tablet properties were similar for the control and solid dispersion containing tablets.
Drug release studies from solid dispersion and tablets
The cumulative drug release of pure drug was 29% in 1 hour due to its hydrophobic nature and there is a need to make a dissolution enhanced delivery system. As shown in fig.9, the drug release increases as the polymer content in solid dispersion is increased.
0 20 40 60 80 100 120
0 50 100 150 200 250
%
Dr
u
g r
e
le
ase
Time (minutes)
[image:10.595.122.493.358.577.2]Effect of drug load on dissolution
Fig. 9 Effect of % drug load on dissolution (×) pure Nisoldipine (+) Physical mixture with copovidone [1:4] (■) solid dispersion copovidone-50% drug (●)solid dispersion copovidone-20% drug (▲)solid dispersion copovidone-10% drug
due to wetting or solubilizing affect of the polymer but it could be due to amorphization of the drug in solid dispersion.
The same was the observation with poloxamer, however, the extent of dissolution enhancement was higher for Copovidone compared to Poloxamer. The polymer content might have resulted in increase in conversion of more drug into amorphous form thereby producing a dissolution efficient solid dispersion. However, the size of the final dosage form might undergo a significant change if too much excipinets are used. An increased size of dosage form may result in difficulty in swallowing of dosage form. A comparison of dissolution efficiency between 1: 4 and 1:10 ratios of solid dispersion indicates that the difference is not significant (p>0.05) and a substantially rapid release dosage form can still be formulated with a lower drug to polymer ratio. Based on all these considerations, it was decided to formulate a dissolution enhanced tablet using solid dispersion at 1:4 ratio. Using this solid dispersion, various rapid release compositions were evaluated in the the tablet dosage form.
The dissolution enhancement was significantly higher for Copovidone system tablets compared to Poloxamer system. As shown in fig. 10, tableting did not affect the performance of solid dispersion system.
0 20 40 60 80 100 120
0 20 40 60 80 100 120 140
%
Dr
u
g r
e
le
ase
Time (minutes)
Drug release from rapid release tablet
Fig. 10: Comparison of drug release form (●) Control (▲) Poloxamer system tablet (■) Copovidone system tablet
Stability studies: The rapid release tablets were stored in a 40cc heavy HDPE bottles with 1g desiccant (silica gel sachet) and accelerated stability studies were carried out for 3 months 40°C/75% RH. The samples were analyzed for assay, water by Kf and dissolution. The was no significant change in water by kf data after 3 months indicating that the formulation design and packaging configuration prevents moisture uptake. Moreover, the dissolution was similar to the initial data indicating that the drug was in substantially amorphous form in the dosage form and the formulation was stable.
CONCLUSION
provide for data even at the ranges which were not part of experiment based on the equations derived. The incorporation of solid dispersion at 20% drug load into a tablet resulted in a rapid release tablet dosage form with enhances dissolution properties.
Acknowledgements
The authors are thankful to Sun Pharmaceutical Industries Limited, R&D Gurgaon for providing the opportunity and requisite resources required for this research work.
REFERENCES
[1]Y Kawabata; K Wada; M Nakatani; S Yamada; S Onoue, Int. J. Pharm., 2011, 420 (1), 1-10. [2]S Pinnamaneni; NG Das; SK Das, Pharmazie, 2002, 57(5), 291-300.
[3]S Stegemann; F Leveiller; D Franchi; HD Jong; H Lindén, Eur. J. Pharm. Sci., 2007, 31(5), 249-261 [4]H Karanth; VS Shenoy; RR Murthy, AAPS PharmSciTech, 2006, 7(4):E1-E8.
[5]A Sharma; CP Jain, Res. Pharm. Sci., 2010, 5(1), 49-56.
[6]US Syamala; RS Kumar; TA Pushkarajan; K Gowthamarajan, Curr. Drug Del., 2014, 11(4), 511-520. [7]TJ Shah; AF Amin; JR Parikh; RH Parikh, AAPS PharmSciTech, 2007, 8(2), E1-E7.
[8]JR Hughey; JM Keen; C Brough; S Saeger; JW McGinity, Int. J. Pharm., 2011, 419(1-2), 222–230. [9]S Verma; VS Rudraraju, AAPS PharmSciTech, 2014, 15(3), 641-657.
[10]Guidance for Industry, ICH Q8, Pharmaceutical development, U.S. Department of Health and Human Services, Food and Drug Administration Center for Drug Evaluation and Research (CDER) Center for Biologics Evaluation and Research (CBER), November 2009.
[11]Guidance for industry, ICH Q11, Development and Manufacture of Drug Substances, U.S. Department of Health and Human Services Food and Drug Administration Center for Drug Evaluation and Research (CDER) Center for Biologics Evaluation and Research (CBER), November 2012.
[12]HA Friedel; EM Sorkin, Drugs, 1988, 36(6), 682-731.
[13]GM El Maghraby; RN Elsergany, Pharm. Dev. Tech, 2014, 19(6), 641–650.
[14]V Marinkovic; D Agbaba; K Karljikovic-Rajic; J Comor; D Zivanov-stakic, Farmaco, 2000, 55(2), 128-33. [15]T Higuchi; KA Connors, Adv. Anal. Chem. Instr., 1965, 4, 117- 122.
[16]AA Enose; PK Dasan; H Shivaramakrishnan; SM Shah, J. Pharm., 2014, 2014, 1-13. [17]J Zuo; Y Gao; N Bou-Chacra; R Löbenberg, BioMed. Res. Int., 2014, 2014, 1-9. [18]RN Shamma; M Basha, Powder Technol., 2013, 237, 406-414.
[19]Y Zhang; M Huo; J Zhou; A Zou; W Li; C Yao; S Xie, AAPS J., 2010, 12(3), 263-271.
[20]S Chutimaworapan; GC Ritthidej; E Yonemochi; T Oguchi; K Yamamoto, Drug Dev. Ind. Pharm., 2000, 26(11), 1141-1150.
[21]F Jijun; X Lishuang; W Xiaoli; Z Shu; T Xiaoguang; Z Xingna; H Haibing; T Xing, Dev. Ind. Pharm., 2011, 37(8), 934–944.
[22]AA Badawi; MA El-Nabarawi; DA El-Setouhy; SA Alsammit, Am. J. Drug Dis. Dev., 2011, 1(3), 144-159. [23]R Kalaiselvan; GP Mohanta; PK Manna; R Manavalan, Ind. J. Pharm. Sci., 2006, 68(5), 599-607.
[24]R Kalaiselvan; GP Mohanta; S Madhusudan; PK Manna; R Manavalan, Pharmazie, 2007, 62(8), 604-607. [25]V Murkipudi; P Gupta; V Sihorkar, Pharm. Dev. Tech., 2013, 18(2), 348–358.


![Fig. 9 Effect of % drug load on dissolution (×) pure Nisoldipine (+) Physical mixture with copovidone [1:4] (■) solid dispersion copovidone-50% drug (●)solid dispersion copovidone-20% drug (▲)solid dispersion copovidone-10% drug](https://thumb-us.123doks.com/thumbv2/123dok_us/8747265.891079/10.595.122.493.358.577/dissolution-nisoldipine-copovidone-dispersion-copovidone-copovidone-dispersion-copovidone.webp)
