Speaker Identification using Vowels /i/ and /
ɑ
/ at Normal
Pitch and High Pitch
Sreeparna Sarkar
School of Modern Languages and Cultures, University of Leeds, United Kingdom
Copyright © 2016 by authors, all rights reserved. Authors agree that this article remains permanently open access under the terms of the Creative Commons Attribution License 4.0 International License
Abstract
In this paper, a speaker identification experiment is conducted where four male speakers are recorded in their normal pitch, uttering Cardinal Vowels 1 and 5, /i/ and /ɑ/ respectively. Out of these four speakers, one speaker is recorded in high pitch. The listeners are asked to identify the same speakers from lists of contrastive pairs of speakers in normal pitch in one set and normal and high pitch in another. This was done in order to study the effect of changing pitch on the listeners’ ability to identify same speakers accurately. We also change the vowels in certain tests to examine whether the change in vowels affects the efficiency of speaker identification more or change in pitch. The results indicate that it is indeed more difficult to identify speakers when they change their voice from normal pitch to high pitch. Change in vowel also shows drop in correct answers, but not as much as change in pitch does.Keywords
Acoustic Energy, Formants, Harmonics, High Pitch, Normal Pitch, Speaker, Speaker Identification, Vowels1. Introduction
Since voice disguising is something that the forensic department deals with very often, phoneticians play a very important role in forensic investigations, for expert analysis and to act as witness to audio recordings of speech says French [1]. The current paper focuses on pitch of voice, and tries to investigate the effects of varying pitch used for disguising voice. We are going to focus on speaker identification by using different pitch levels and examine how it affects their ability to identify speakers correctly. This study would indicate results which might tell us that it is more difficult to identify speakers when their voice is disguised from normal to high pitch and also see if the effect is more on /i/ or on /ɑ/.
2. The Research Questions
1. Keeping the pitch level constant, is it possible to correctly identify same voices when the vowels are same?
2. Is it more challenging to identify the same voices when the pitch is constant but the vowels are different?
3. Is it possible to identify the same speaker when they disguise their voice to a high pitched voice, when the vowel is same?
4. Is it more difficult to identify voices when both pitch and the vowel is different?
3. Experimental Investigation of
Speaker Identification
Why vowels /i/ and /ɑ/?
Rose [2] says that the vowels /i/ and /ɑ/ have good identifying potential. The two vowels are distinctly opposite in their characteristics: while producing /i/ the tongue position is front, mouth closed and lips unrounded, in producing / ɑ /, the tongue position is back, mouth open and the lips rounded. Vowel quality is also considered as a one of the ways in which speaker’s accent is attained as pointed out by Rose [2], this is important, since accents indicate the geographical location and the social group of a person. We will now take account of the difference in their acoustic structures which would help us make a clear distinction between the acoustic energy produced while uttering the two vowels.
Figure 1. The figure above is the spectrum of /i/ showing F0= 141Hz.
Figure 2. The figure above is the spectrum of /ɑ/ showing F0= 141Hz.
4. Data Collection
Four male speakers were asked to produce /i/ and /ɑ/ respectively, three times each in their normal pitch. The speakers did not have any language restrictions either. They could be native speakers of any language and in this experiment they were native speakers of English, Japanese, Dutch and the fourth speaker had two native languages, English and Zulu. The recording that was obtained after the recording session was not very loud as it was recorded using a regular microphone in natural environment because a recording studio with an ideal environment was not available. However, we did use the same recording for the experiment because of the fact that in a forensic case, ideal recordings are not easily available.
One out of the four speakers was asked to produce the same vowels in high pitch as well, for three times. The sounds were then separated using the software PRAAT and the best one of the three tokens was taken for making the sound files. This was followed by cutting each token produced by one speaker and joining it with the other token produced by the other speaker and hence forming a pair of sounds. The sounds were paired by permutations and combinations and were presented to the listeners in the same order as they would listen to while doing the task. 64 sound pairs were made in total and these pairs formed the options from which the listeners would have to choose from for selecting the same speaker.
The listeners were given 5 sound folders containing the
sound files which were arranged in exactly the same way as the questions in the response sheet followed. The respondents were asked to listen to the sounds at most four times and make a decision as to which pair consists of the same speaker. The number of times they could listen to the sound files were restricted to four times because listening to the sounds for longer would delay the task and would confuse the listener even more. Hence, a new set of questions were added to each question which asked them how confident they were while making a choice were. This question helped us find out how difficult selecting got with the changing pairs of sounds.
The speakers were male because the difference between a low pitch voices to high pitch voice is more apparent in male voice. Female voice is naturally high pitched compared to male voice; hence the change would not be as noticeable. The recording that was obtained was not very loud as it was recorded using a regular microphone in natural environment, which is similar to actual forensic situations.
4.1. The Subjects/Listeners
Subjects were adults between ages 22- 52 both males and females with different native languages. It was not necessary for them to be native speakers of English because these are only vowel sounds and these two vowels are common to most languages.
The experiment was designed in order to make the listeners compare normal pitch and normal pitch sounds as well as normal pitch and high pitch sounds, which serve as the control for the comparison between normal pitch and high pitch sounds. A fixed interval of time was allowed in between the two sounds in a pair, 0.1ms between each token. The pairs with the same speakers were placed at random without following a fixed pattern, so that the listeners don’t follow a similar pattern while identifying. The options which the respondents saw, for example had a pair of different speakers in the first two options, pair of same speakers in the third option and a pair of same speakers in the last option and so on for the rest of the questions.
The number of respondents was 17and generalization, all calculations and statistical tests were done based on the responses of these 17 respondents. Before starting the data measurement, the response sheet was answered by selecting answer choices alternately to check the chance results in order to be able to compare the deviation from the chance. More deviation from the chance results would indicate genuine responses which will show the degree of accuracy of the result. This method of testing respondents is appropriate for this experiment because it not only addresses each part of the research questions separately with the help of these16 questions but also measures the accuracy of the answers. The only limitation is that we cannot let the respondents listen to the recordings endless times because that might confuse the listener.
5. Results
First the number of correct answers and the number of wrong answers for each question were calculated. In order to find the correlation between the variables which are correctness of identification of same voices and vowel type, and correctness of identification of same voices and pitch type, a statistical analysis was performed using the SPSS software. The cross tabulation of the number of correct answers and the number of wrong answers for each questions, are presented below. We performed the Chi square test for the significance of correlation between the correct answers and vowel type. The table below shows the results of cross tabulation.
Table 1. Shows the significance of correlation between the correct answers and vowel type.
Crosstab Count
Vowel Type
Total Diff same
correct no 71 74 145
yes 31 96 127
Total 102 170 272
Therefore we can say that the difference between the numbers of correct answers when the vowels are same and
[image:3.595.311.553.205.291.2]the number of correct answers when the vowel is different is 65 which shows high statistical significance as confirmed by the chi square test (X=17.4, P<0.001 and DF=1). Next we will look at the correlation between the correctness of answers by respondents and pitch type, in the similar way as we did with vowel type. The table below shows the cross tabulation of the results as shown by SPSS based on the data that was obtained from the respondents.
Table 2. Shows the significance of correlation between the correct answers and pitch type.
correct * Pitch Type Crosstabulation Count
Pitch Type
Total Diff same
correct no 54 91 145
yes 14 113 127
Total 68 204 272
When pitch is different, only 14 are correct, while when pitch is same 113 are correct. The correlation between the correct answers by the respondents and pitch type is also highly significant as confirmed by the Chi- square test. (X=24.8, P<0.001, DF=1). A Chi square test was performed to check the significance of the correlation between listeners and the correct answers considering the fact that some listeners are better than the other listeners. The test confirms that the effect is highly significant (X= 40.7, p<0.001, DF= 16).
[image:3.595.313.552.485.754.2]Now let us see the number of correct answers for each question with the help of the following table. We will explain these results with the help of a graph as well.
Table 3. Shows a summary of the number of people who could identify the correct pair in each question correctly and the number of people who could not.
Question and the factors investigated. (Actual
Correct Speaker) Correct Wrong 1.same vowel /ɑ/ - same pitch (Speaker 1) 10 7
2.same vowel /ɑ/ - same pitch (Speaker 2) 12 5 3. same vowel /ɑ/ - same pitch (Speaker 3) 11 6 4.same vowel /ɑ/ - same pitch (Speaker 4) 12 5 5.same vowel /i/ -same pitch (Speaker 1) 13 4 6.same vowel /i/- same pitch (Speaker 2) 11 6 7.same vowel /i/- same pitch (Speaker 3) 10 7 8.same vowel /i/- same pitch (Speaker 4) 11 6 9.different vowel/ɑi/- same pitch (Speaker 1) 10 7 10. different vowel/ɑi/- same pitch (Speaker 2) 6 11 11. different vowel/ɑi/- same pitch (Speaker 3) 8 9
12. different vowel/ɑi/- same pitch(Speaker 4) 2 15 13. same vowel /i/- different pitch(Speaker 1) 3 14 14.same vowel /ɑ/ - different pitch (Speaker1) 5 12
15.different vowel /i/ /ɑ/- different
pitch(Speaker 1) 2 15 16. different vowel/ɑ/ /i/ - different pitch
[image:3.595.57.297.630.723.2]Graph 1. Shows the number of correct and incorrect answers The graph above shows the question numbers in the X-axis and Y- axis shows the number of correct and incorrect answers. The graph below shows the confidence of each listener while answering each question. In the response sheet the question following every option was to find how confident they were in their answers. They were given four choices ‘Very’, ‘Quite’, ‘A bit’, ‘Not at all’ from which they had to select one for every answer. These were converted to a scale of two while calculating the results in order to obtain the following graph. The answers ‘Very’ and ‘Quite’ were considered as ‘High Confidence’ and the answers ‘A bit’ and ‘Not at all’ were considered as ‘Low Confidence’.
Graph 2. Shows the confidence level of the listeners in identifying the same speakers.
6. Discussion
The table in the previous section which takes into account the number of respondents who correctly answered each question is the actual indicator of how the different variations made in the stimuli affected their response. We can see from the graph above, the number of correct answers decreases towards the last few questions compared to the first ones. Their level of confidence also shows a similar pattern.
In the first eight questions, we try to address the question whether the participants can identify the same speaker from the pairs of speakers uttering same vowels at normal pitch or not. In the first four questions, we investigate the vowel /ɑ/. In each question the listeners were supposed to find the same speaker from four pairs of speakers producing the same vowel /ɑ/ in their normal pitch. This task was repeated four times with each question having different pairs of same speakers as one of the four options. Each question had only one pair of same speaker but the pairs of same speakers were not the same stimuli, because we aim to see is whether the respondents can find the same pair from a list of different pairs of speakers. From the table above, we can see that in the first four questions an average of 11on 17 could find the correct pair of speakers. In the next four questions, the task was to find the same pair of speakers when they produced the vowel /i/ in their normal pitch. Each question had only one
correct pair out of four options and for each question the stimuli for the same pairs was different. From the table above we can see that the average was 11 of 17 respondents who could find the correct pair of sounds when the vowel was /i/. Therefore, we cannot say that the efficiency of identifying the same speaker is more in vowel /ɑ/ than vowel /i/ and vice-versa, in other words, vowel quality does not matter.
However, when the vowel was different /ɑ/ followed by /i/, in the next four questions, an average of only 7 respondents out of 17 could find the correct pair of speakers. Hence, when the vowels are different with same pitch, it is harder to identify the same speakers. Let us try to understand the spectrum of both the sounds /ɑ/ and /i/ and relate them to the responses that we have above for these questions.
Let us refer to Fig. 2 from section 3 which is the spectrum of [ɑ] normal pitch, F0 = 141Hz. Harmonics occur at 141Hz intervals and these harmonics contribute energy to each formant. Now, we will refer to Fig.1 from section 3 which is the spectra of /i/, in order to be able to distinguish between the formant structures of the respective vowels. The spectrum of /i/ normal pitch, F0= 141Hz also indicates that harmonics occur at 141Hz intervals. Here we can see that 3 or 4 harmonics contribute energy to each formant. While finding the same pairs of speakers, the listeners listen to these sound tokens which are nothing but these energies which contribute to each formant and based on that information, decide which speaker is same.
As we can see from the spectra,the formants F1 and F2 are close together for /ɑ/, giving a wide band of high amplitude acoustic energy for the listener to process, while in /i/ F1 and F2 are far apart and hence they cannot provide the listener with a wide band of acoustic energy. This could be one of the main reasons why /i/ generally gives lesser acoustic information to the listener hence making it more difficult to identify the same speaker when the two vowels are different / ɑ/ and then /i/. It means that first the listener gets to hear the vowel /ɑ/ and processes the information, while the next vowel /i/ does not give enough information as /ɑ/, and makes it difficult to decide which pair of sounds are the same. Questions 9 to 12 investigate whether keeping the pitch constant and changing the vowel has any effect on the responses. As we can see from Table 3 above, question 12 had the least number of correct answers compared to question 9, 10 and 11. However, there is no clear reason why no.12 got the least number of correct answers and need further investigation.
Figure 3. Spectrum of high pitch /i/.
The above spectrum is of high pitch /i/, F0 = 407Hz, therefore harmonics occur at 407Hz intervals. Since each formant is further apart from each other than it was for the normal pitch /i/, hence does not provide a wide band of acoustic energy for the listener to process and make an accurate judgment. This means the level of difficulty to identify the same speaker increases due to inadequate acoustic information and we can see the difference in the answers where average correct answers for same pitch same vowel was 11, here it is 3. Five respondents could identify the pair of same speakers when the vowel was /ɑ/ and the pitch was varied. The following spectrum will help us understand the effects on the listener when the pitch is varied.
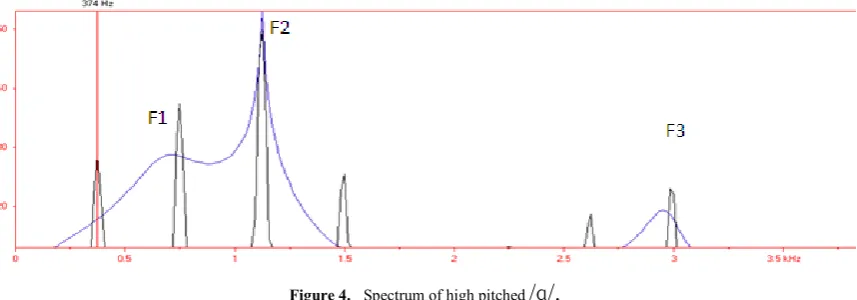
Figure 4. Spectrum of high pitched
/
ɑ
/.
The spectrum above shows the formant structures of highpitched /ɑ/ with F0= 374Hz. Compared to the one in normal pitch /ɑ/, the formants are further apart from each other which would mean that the band of high amplitude acoustic energy is not wide enough to give listeners enough information to process. Hence it affects the identification ability of speakers adversely, bringing down the number of correct answers from an average of 11 to 5. Hence when vowels are same but pitch is different, there is a notable difference in results from when the vowel and pitch both were same. The band for /ɑ/ is still wider than the band we see in the spectrum for high pitched /i/ which might be the reason behind two more correct answers for /ɑ/. Since, the vowel /ɑ/ still gives more acoustic information even when the speaker disguises his voice to high pitch, than high pitched /i/, hence, even though little difference in number is seen, it might be more for vowel /ɑ/ because of its acoustic properties, whereas the acoustic information conveyed for high pitch /i/ are much lesser making it even more difficult for the listeners to be able to identify. Therefore, we can say that when the pitch is same and normal, it is easier to identify the speaker, however when a person changes his voice by changing the pitch from normal to high, it becomes more
difficult to identify the speaker.
Furthermore, 2 respondents and 3 respondents could answer the 15th and the 16th questions respectively correctly, they selected ‘not at all’ confident as their answers, whereas in the first 8 questions where pitch was same and vowels were same most of them answered the question on confidence as ‘very confident’. This shows that change in pitch level along with the change in vowel affects the efficiency of identifying the same speaker. From the second graph which is for the question of confidence, we see a same pattern as the first graph, which is: most ‘high confidence’ answers are observed in the first eight questions when the answers are mostly correct and in the last six questions the answers were mostly ‘low confidence’ where most of the answers were incorrect.
6. Conclusions
1. First, we saw that it is easy for listeners to identify the same speaker when vowels are same and pitch is same for both the sounds /i/ and /ɑ/.
[image:5.595.92.521.320.470.2]keeping pitch same made it more difficult for the listeners to identify the same voice. We saw that it gets slightly more difficult.
3. Then we kept the vowel same but changed the pitch which showed a drop in correct answers compared to when pitch and vowel both were same. Hence voice disguise by changing the voice to high pitch is more difficult to identify.
4. Finally we changed both the vowel and the pitch and we found that it is most difficult to identify the same speaker when vowel is changed and pitch is raised from normal to high.
6.1. Further Developments
In this experiment we used only male voices for creating the stimuli; we can create stimuli with female voices and examine the results by comparing them with the results we found for the male voices. For these kinds of tests, a well designed control group can be very useful, in order to determine the exact effects of pitch variation.
Furthermore we can create stimuli using both male and female voices and see which is easier to recognize. We can first observe the timbre in each of their voices and then see the effect of change in pitch in both male and female voices in such an experiment. These extensions will require designing of suitable methods specially to adapt to the distinctiveness of the groups examined.
Appendix 1
Listener’s task.
The listeners will have to identify the speaker who is uttering the two vowels /i/ and /ɑ/ in high pitch by comparing the utterances with the other four speakers who utter the same vowels in their own normal pitch. In order to do this, the listeners will be asked to listen to the speech production by the speakers in a particular order which will lead them to the final test with pitch variance. They would be asked to listen to the sounds in sets, with difference in the arrangement of the sounds:
1. First they will hear 2 tokens of the same vowel in normal pitch but by different speakers, one pair will contain the same speaker. For example,
Set 1. Set 2. Set 3. Set 4.
(/ɑ/) (/ɑ/) (/ɑ/) (/ɑ/) (/ɑ/) (/ɑ/) (/ɑ/) (/ɑ/) Speaker 1 - speaker 2. Speaker 2 - speaker 1. Speaker 3 - speaker 1. Speaker4 – speaker 1 Speaker 1 - speaker 3. Speaker 2 - speaker 2. Speaker 3 - speaker 2. Speaker 4 – speaker 2 Speaker 1 - speaker 4. Speaker 2 - speaker 4. Speaker 3 - speaker 3. Speaker 4- speaker 3 Speaker 1 - speaker 1. Speaker 2 - speaker 3. Speaker 3 - speaker 4. Speaker 4 - speaker 4.
Set 1. Set 2. Set 3. Set 4.
(/i/) (/i/) (/i/) (/i/) (/i/) (/i/) (/i/) (/i/)
Speaker 1 - speaker 2. Speaker 2 - speaker 1. Speaker 3 - speaker 1. Speaker4 – speaker 1 Speaker 1 - speaker 3. Speaker 2 - speaker 2. Speaker 3 - speaker 2. Speaker 4 – speaker 2 Speaker 1 - speaker 4. Speaker 2 - speaker 4. Speaker 3 - speaker 3. Speaker 4- speaker 4 Speaker 1 - speaker 1. Speaker 2 - speaker 3. Speaker 3 - speaker 4. Speaker 4 - speaker 3. Note that the pairs are arranged in such a way that there is no repeated pattern to it by which the listener can guess when the same speaker is appearing together.
In the response sheet the listeners will have to circle the correct choice within a certain time. This test will investigate whether listeners can identify the same speaker when the vowel and the pitch are same.
2. In this test the vowels will be different but pitch will be same.
Set 1. Set 2. Set 3. Set 4.
(/ɑ/) (/i/) (/ɑ/) (/i/) (/ɑ/) (/i/) (/ɑ/) (/i/) Speaker 1 - speaker 2. Speaker 2 - speaker 1. Speaker 3 - speaker 1. Speaker4 – speaker 1 Speaker 1 - speaker 3. Speaker 2 - speaker 2. Speaker 3 - speaker 2. Speaker 4 – speaker 2 Speaker 1 - speaker 4. Speaker 2 - speaker 4. Speaker 3 - speaker 3. Speaker 4- speaker 4 Speaker 1 - speaker 1. Speaker 2 - speaker 3. Speaker 3 - speaker 4. Speaker 4 - speaker 3. Listeners will have to find out the same speaker when the pitch is same but the vowel is different. This test will investigate if it is more difficult to identify speakers when different vowels are uttered.
Set 1.
Speaker 1 Normal pitch (/i/) - High pitch (/i/). Speaker 2 Normal pitch (/i/) - High pitch (/i/). Speaker 3 Normal pitch (/i/) - High pitch (/i/). Speaker 4 Normal pitch (/i/) - high pitch (/i/). Set 2.
Speaker 1 Normal pitch (/ɑ/) - High pitch (/ɑ/). Speaker 2 Normal pitch (/ɑ/) - High pitch (/ɑ/). Speaker 3 Normal pitch (/ɑ/) - High pitch (/ɑ/). Speaker 4 Normal pitch (/ɑ/) - high pitch (/ɑ/).
In the response sheet listeners will have to circle the match they think is correct within a certain amount of time. This test will try to investigate whether it is possible for the listeners to identify the same person when they disguise their voice to a high pitched voice, even though the vowel spoken is same. Finally, in the last test listeners will have to compare the high pitch utterances with the normal pitched ones when the vowels uttered are different.
(/i/) (/ɑ/) Speaker 1 Normal pitch - High pitch. Speaker 2 Normal pitch- High pitch. Speaker 3 Normal pitch – High Pitch. Speaker 4 Normal pitch – high pitch
(/ɑ/) (/i/) Speaker 1 Normal pitch - High pitch. Speaker 2 Normal pitch- High pitch. Speaker 3 Normal pitch – High Pitch. Speaker 4 Normal pitch – high pitch.
Here the listeners will have to circle the correct option by matching the normal pitched speaker to the high pitched one. This test will try to find out if it is more difficult to identify the speaker if the vowel is different.
Appendix 2
Response sheet.
The aim of the experiment is to investigate similarities between voices.
You will hear 4 pairs of utterances. In some pairs, the speaker is the same person, and in some there are two different people. Identify the pair/s which you think have the same person and circle the number next to it. Please do not listen to the sounds more than 4 times.
Vowel (/ɑ/)
Which of these pairs of speakers consists of the same speaker? Indicate your choice by circling the number on the left, and also indicate how confident you are by underlining the appropriate word on the right..
1. Pair 1
How confident are you of your answer? Very, Quite, A bit, Not at all.
2. Pair 2
How confident are you of your answer? Very, Quite, A bit, Not at all.
3. Pair 3
How confident are you of your answer? Very, Quite, A bit, Not at all.
4. Pair 4
How confident are you of your answer? Very, Quite, A bit, Not at all..
Vowel (/ɑ/)
Which of these pairs of speakers consists of the same speaker?
5. Pair 1
How confident are you of your answer? Very, Quite, A bit, Not at all.
6. Pair 2 right
How confident are you of your answer? Very, Quite, A bit, Not at all.
7. Pair 3
How confident are you of your answer? Very, Quite, A bit, Not at all.
8. Pair 4
How confident are you of your answer? Very, Quite, A bit, Not at all.
Vowel (/ɑ/)
Which of these pairs of speakers consists of the same speaker?
9. Pair 1
How confident are you of your answer? Very, Quite, A bit, Not at all.
10. Pair 2
How confident are you of your answer? Very, Quite, A bit, Not at all.
11. Pair 3 right
How confident are you of your answer? Very, Quite, A bit, Not at all.
12. Pair 4
How confident are you of your answer? Very, Quite, A bit, Not at all.
Vowel (/ɑ/)
Which of these pairs of speakers consists of the same speaker?
14. Pair 2 How confident are you of your answer? Very, Quite, A bit, Not at all.
15. Pair 3 How confident are you of your answer? Very, Quite, A bit, Not at all.
16. Pair 4 right How confident are you of your answer? Very, Quite, A bit, Not at all.
Vowel (/i/)
Which of these pairs of speakers consists of the same speaker?
17. Pair 1 How confident are you of your answer? Very, Quite, A bit, Not at all.
18. Pair 2 How confident are you of your answer? Very, Quite, A bit, Not at all.
19. Pair 3 How confident are you of your answer? Very, Quite, A bit, Not at all.
20. Pair 4 How confident are you of your answer? Very, Quite, A bit, Not at all.
Vowel (/i/)
Which of these pairs of speakers consists of the same speaker?
21. Pair 1 How confident are you of your answer? Very, Quite, A bit, Not at all.
22. Pair 2 right How confident are you of your answer? Very, Quite, A bit, Not at all.
23. Pair 3 How confident are you of your answer? Very, Quite, A bit, Not at all.
24. Pair 4 How confident are you of your answer? Very, Quite, A bit, Not at all.
Vowel (/i/)
Which of these pairs of speakers consists of the same speaker?
25. Pair 1 How confident are you of your answer? Very, Quite, A bit, Not at all.
26. Pair 2 How confident are you of your answer? Very, Quite, A bit, Not at all.
27. Pair 3 right How confident are you of your answer? Very, Quite, A bit, Not at all.
28. Pair 4 How confident are you of your answer? Very, Quite, A bit, Not at all.
Vowel (/i/)
Which of these pairs of speakers consists of the same speaker?
29. Pair 1 How confident are you of your answer? Very, Quite, A bit, Not at all.
30. Pair 2 How confident are you of your answer? Very, Quite, A bit, Not at all.
31. Pair 3 How confident are you of your answer? Very, Quite, A bit, Not at all.
32. Pair 4 How confident are you of your answer? Very, Quite, A bit, Not at all.
2. In the next test, you will hear 4 pairs of 2 different vowels being uttered and you have to select the pairs which you
think has same speakers. Circle the number that you think contains same the speaker.
Set 1
33. Pair 1 How confident are you of your answer? Very, Quite, A bit, Not at all.
34. Pair 2 How confident are you of your answer? Very, Quite, A bit, Not at all.
35. Pair 3 How confident are you of your answer? Very, Quite, A bit, Not at all.
36. Pair 4 How confident are you of your answer? Very, Quite, A bit, Not at all.
Set 2
37. Pair 1 How confident are you of your answer? Very, Quite, A bit, Not at all.
38. Pair 2 right How confident are you of your answer? Very, Quite, A bit, Not at all.
39. Pair 3 How confident are you of your answer? Very, Quite, A bit, Not at all.
40. Pair 4. How confident are you of your answer? Very, Quite, A bit, Not at all.
Set 3
41. Pair 1 How confident are you of your answer? Very, Quite, A bit, Not at all.
42. Pair 2 How confident are you of your answer? Very, Quite, A bit, Not at all.
43. Pair3right How confident are you of your answer? Very, Quite, A bit, Not at all.
44. Pair 4 How confident are you of your answer? Very, Quite, A bit, Not at all.
Set 4
45. Pair 1 How confident are you of your answer? Very, Quite, A bit, Not at all.
46. Pair 2 How confident are you of your answer? Very, Quite, A bit, Not at all.
47. Pair 3 How confident are you of your answer? Very, Quite, A bit, Not at all.
48. Pair 4 How confident are you of your answer? Very, Quite, A bit, Not at all.
3. In the next test you will have to indicate which pairs have the same speaker when the speakers are contrasted with a high pitched speaker. Please indicate the number next to the option.
Set 1.
49. Pair 1right. How confident are you of your answer? Very, Quite, A bit, Not at all.
50. Pair 2. How confident are you of your answer? Very, Quite, A bit, Not at all.
51. Pair 3. How confident are you of your answer? Very, Quite, A bit, Not at all.
Set 2
53. Pair 1. How confident are you of your answer? Very, Quite, A bit, Not at all.
54. Pair 2. How confident are you of your answer? Very, Quite, A bit, Not at all.
55. Pair 3. How confident are you of your answer? Very, Quite, A bit, Not at all.
56. Pair 4. How confident are you of your answer? Very, Quite, A bit, Not at all.
4. In this test you will listen to pairs of speakers uttering vowels in normal pitch and high pitch, however this time the vowels will be different.
Set 1
57. Pair 1. How confident are you of your answer? Very, Quite, A bit, Not at all.
58. Pair 2. How confident are you of your answer? Very, Quite, A bit, Not at all.
59. Pair 3. How confident are you of your answer? Very, Quite, A bit, Not at all.
60. Pair 4. How confident are you of your answer? Very,
Quite, A bit, Not at all. Set 2
61. Pair 1. How confident are you of your answer? Very, Quite, A bit, Not at all.
62. Pair 2. How confident are you of your answer? Very, Quite, A bit, Not at all.
63. Pair 3. How confident are you of your answer? Very, Quite, A bit, Not at all.
64. Pair 4. How confident are you of your answer? Very, Quite, A bit, Not at all.
REFERENCES
[1] French, P. 1994. An overview of forensic phonetics with particular reference to speaker identification. The International Journal of Speech Language and the Law.1(2). Pp. 169-176.