Journal of Chemical and Pharmaceutical Research, 2015, 7(5):1213-1224
Research Article
ISSN : 0975-7384
CODEN(USA) : JCPRC5
Formulation design and development of SR matrix tablets of vildagliptin by using different
grades of carbopol and eudragit
Y. Ganesh Kumar*
1, J. Sreekanth
2and D. Satyavati
31, 3
Brilliant Group of Institutions (Integrated Campus), Abdullapurmet, Hayathnagar, R.R Dist,
Telangana, India.
2
Sr.General Manager, R&D Center, MSN Laboratories Pvt. Ltd, Hyderabad, Telangana, India.
____________________________________________________________________________________________ABSTRACT
Vildagliptin is an anti-diabetic drug of the dipeptidyl Peptidase-4 (DPP-4) inhibitor class of drug. The biological half-life of the drug is 1 .5 hours. Elimination half life is less so we can consider improving the bioavailability of the drug. The present research work was to develop sustained release tablets of vildagliptin to achieve a sustained drug release with reduced frequency of drug administration reduced side effects and improved patient compliance. Sustained Release tablets of vildagliptin by using different polymers like Carbopol and Eudragit grades. Drug Excipient Compatibility study was performed through FTIR revealed that there no interaction between drug and polymers. The tablets were prepared by wet granulation technique. The prepared SR Matrix tablets were evaluated for various physico chemical parameters. All the formulations resulted in acceptable Pharmacopoeia limits. In-vitro
drug release studies (USP dissolution rate test apparatus II, 50 rpm, 370C ±0.50C) using 0.1N hydrochloric
acid(1.2 PH) for first 2hrs and phosphate buffer (PH 6.8) as a dissolution medium (900ml) for the next 10 hrs. Among
all the formulation F-2 shows better result upto 12 hours of the drug release was found to be 99.37±0.87 % so it’s an Optimized formulation. Release kinetics were applied to optimized formulation shows that the pattern of release
was Zero order (R2 = 0.9917).
Key words: Vildagliptin, Wet granulation, SR Matrix, Carbopol, Eudragit
___________________________________________________________________________________________
INTRODUCTION
Oral drug delivery is the most widely utilized route of administration among all the routes that have been explored for the systemic delivery of drug via pharmaceutical products of different dosage form. Oral route is considered most natural, uncomplicated, convenient and safe due to its ease of administration, patient acceptance, and cost effective manufacturing process.
Sustained Release may be defined as “any drug or dosage form modification that prolongs the therapeutic activity of the drug”. It provides prolonged but not necessarily uniform release of drug. The Sustained Release Oral dosage forms have been demonstrated to improve therapeutic efficacy by maintaining steady state drug plasma concentration. Various types of modified release formulations have been developed to improve the patient compliance and also clinical efficacy of the drug. (1,2)
of one or more drugs with gelling agent. By the sustained release method therapeutically effective concentration can be achieved in the systemic circulation over an extended period of time, thus achieving better compliance of patients.(3,4)
Vildagliptin is an Oral anti-diabetic drug of the dipeptidyl Peptidase-4 (DPP-4) inhibitor class of drug. Vildagliptin inhibits the in activation of GLP-1 and GIP by DPP-4, allowing GLP-1 and GIP to potentiate the secretion of insulin in the beta cells and suppress glucagon release by the alpha cells of the islets of Langerhans in the pancreas.
Vildagliptin is rapidly absorbed with a median tmax of about 1.5 hr after oral dosing and has a mean absolute oral
bioavailability of 85%.(8,24)
EXPERIMENTAL SECTION
Vildagliptin was obtained from MSN Laboratories Ltd, Hyderabad.Carbopol-934, 940, Eudragit-S 100, L-100, RS-100, RL-100 was supplied by Yarrow Chem Products, Mumbai. PVP-K 30, IPA, Aerosil, Magnesium Stearate and Microcrystalline Cellulose was supplied by Signet Chem Mumbai.
METHODOLOGY Preformulation Studies:
Standardization of Vildagliptin by UV-Visible Spectrophotometry: a) In 0.1 N Hcl Solution:
i) Preparation of stock solution: Stock solution 100µg/ml Vildagliptin was prepared in 0.1N Hcl solution. This
solution was approximately diluted with 0.1N Hcl to obtain a concentration of 10µg/ml. The resultant solution was scanned in range of 200- 400nm using UV double beam spectrophotometer (Lab India UV-3000+).
ii) Standard calibration of Vildagliptin in 0.1N Hcl:
100mg of Vildagliptin was accurately weighed and dissolved in100ml of 0.1N Hcl to obtain a concentration of 1000µg/ml. From the above 10ml was withdrawn and diluted to 100ml to obtain a concentration of 100µg/ml. From this stock solution aliquots of 0.5ml, 1ml, 1.5ml, 2ml and 2.5ml were diluted in 10ml volumetric flask with phosphate buffer to give concentrations in range of 5µg/ml to 25µg/ml respectively, absorbance was measured at 232nm.
b) In pH 6.8 Buffer:
i) Preparation of stock solution: Stock solution 100µg/ml of Vildagliptin was prepared in phosphate buffer of pH
6.8. This solution was approximately diluted with phosphate buffer of pH 6.8 to obtain a concentration of 10µg/ml. The resultant solution was scanned in range of 200- 400nm using UV double beam spectrophotometer (Lab India UV-3000+).
ii) Standard calibration of Vildagliptin in phosphate buffer of pH 6.8:
100mg of Vildagliptin was accurately weighed and dissolved in100ml of pH 6.8 phosphate buffer to obtain a concentration of 1000µg/ml. From the above 10ml was withdrawn and diluted to 100ml to obtain a concentration of 100µg/ml. From this stock solution aliquots of 0.5ml, 1ml, 1.5ml, 2ml and 2.5ml were diluted in 10ml volumetric flask with phosphate buffer to give concentrations in range of 5µg/ml to 25µg/ml respectively, absorbance was measured at 227nm.
Evaluation of granules: Angle of repose:
The angle of repose of blends was determined by the funnel method. The accurately weighed blend was taken in funnel. The height of the funnel was adjusted in such a way that the tip of the funnel just touched the apex of the heap of the blend. The blend was allowed to flow from the funnel on the surface. The diameter and height of the heap formed from the blend was measured. The angle of repose was calculated using following formula.(5)
Tan Ѳ= h/r
Where, “h” is height of the heap and “r” is the radius of the heap of granules.
Carr’s compressibility index:
tapped volume of the blend. The bulk density and tapped density were calculated by using the bulk volume and tapped volume.
Carr’s compressibility index was calculated by using following formula.(6,7)
Carr’s compressibility index (%) = [(Tapped density-Bulk density) X100]/Tapped density Bulk Density (BD):
An accurately weighed powder blend from each formula was lightly shaken to break any agglomerates formed and it was introduced in to a measuring cylinder. The volume occupied by the powder was measured which gave bulk volume. The bulk densities (BD) of powder blends were determined using the following formula.(9)
Bulk density = Total weight of powder / Total volume of powder
Tapped bulk density (TBD):
An accurately weighed powder blend from each formula was lightly shaken to break any agglomerates formed and it was introduced into a measuring cylinder. The measuring cylinder was tapped until no further change in volume was noted which gave the tapped volume. The tapped bulk densities (TBD) of powder blends were determined using the following formula.(10)
TBD= Total weight of powder / Total volume of tapped powder
Preparation of matrix tablets:
Vildagliptin tablets with different concentrations of polymer were prepared by the wet granulation technique.
Wet granulation method: All the powders were passed through 80 mesh. Required quantities of all ingredients
were mixed thoroughly and a sufficient volume of granulating agent was added slowly. After enough cohesiveness was obtained, the mass was sieved through 22/44 mesh. The granules were dried at 40 C for 12hrs. Once, dry the granules retained on 44 mesh were mixed with 10% of fine granules that passed through 44 mesh. Talc and magnesium stearate were added as glidant and lubricant. In all formulations, the amount of the active ingredient is equivalent to 50 mg of Vildagliptin (Table 1)
Table 1: Composition of Vildagliptin Sustained Release Matrix Tablets
S.No Ingredients F1 F2 F3 F4 F5 F6 F7 F8 F9 F10 F11
1 Vildagliptin 50 50 50 50 50 50 50 50 50 50 50
2 Carbopol-934 50 --- --- --- --- --- --- --- --- --- ---
3 Carbopol-940 --- 50 75 100 --- --- --- --- --- --- ---
4 Eudragit-S 100 --- --- --- --- 50 --- --- --- --- --- ---
5 Eudragit-L 100 --- --- --- --- --- 50 75 100 125 --- ---
6 Eudragit-RS 100 --- --- --- --- --- --- --- --- --- 50 ---
7 Eudragit-RL 100 --- --- --- --- --- --- --- --- --- --- 50
8 PVP-K 30 12.5 12.5 12.5 12.5 12.5 12.5 12.5 12.5 12.5 12.5 12.5
9 IPA QS QS QS QS QS QS QS QS QS QS QS
10 Aerosil 5 5 5 5 5 5 5 5 5 5 5
11 Mg.Stearate 5 5 5 5 5 5 5 5 5 5 5
12 MCC 127.5 127.5 102.5 77.5 127.5 127.5 102.5 77.5 52.5 127.5 127.5
Total Weight(mg) 250 250 250 250 250 250 250 250 250 250 250
Evaluation of tablets: Hardness test:
Hardness indicates the ability of a tablet to withstand mechanical strength while handling. The hardness of the
tablets were determined using Monsanto Hardness tester. It is expressed in Kg/cm2. Three tablets were randomly
picked from each formulation and the mean and standard Deviation values were calculated.(11-13)
Friability test:
% F= (loss in weight / initial weight) x 100
% Friability of tablets less than 1% are considered acceptable.
Weight variation test:
The tablets were selected randomly from each formulation and weighed individually to check for weight variation. The U.S Pharmacopoeia allows a little variation in the weight of a tablet. To study weight variation, 20 tablets of each formulation were weighed using an electronic balance Aqua and the test was performed according to the official method.(16)
Drug Content (Assay):
Drug content of the tablets was determined by UV Spectrophotometrically.
Uniformity of thickness:
Thickness and diameter of tablets were important for uniformity of tablet size. Thickness and diameter was measured using vernier caliper.(17-19)
In-vitro dissolution studies:
In-vitro drug release studies from the prepared Vildagliptin SR matrix tablets were conducted using USP type II
apparatus at 37°C at 50rpm. Dissolution mediums used were 900ml of 0.1N Hcl and phosphate buffer of pH 6.8. The release rates from matrix tablets were conducted in Hcl solution (pH 1.2) for first 2hrs and changed to phosphate buffer (pH 6.8) for next 10 hrs time periods. The samples were withdrawn at desired time periods from dissolution media and the same were replaced with fresh dissolution media of respective pH. The samples were analyzed by UV-Visible Spectrophotometer (Lab India 3000+). The amounts of drug present in the samples were calculated with the help of appropriate calibration curves constructed from reference standards. Drug dissolved at specified time periods was plotted as percent release versus time curve.
Dependent-model method (Data analysis)
In order to describe the Vildagliptin release kinetics from individual tablet formulations, the corresponding dissolution data were fitted in various kinetic dissolution models: zero order, first order, Higuchi, Korsmeyer Peppas. When these models are used and analyzed in the preparation, the rate constant obtained from these models is an apparent rate constant. The release of drugs from the matrix tablets can be analysed by release kinetic theories. To study the kinetics of drug release from matrix system, the release data were fitted into Zero order as cumulative amount of drug release vs. time (Eqn.3), first order as log cumulative percentage of drug remaining vs. time (Eqn.4), Higuchi model as cumulative percent drug release vs. square root of time (Eqn.5). To describe the release behavior from the polymeric systems, data were fitted according to well known exponential Korsmeyer – Peppas equation as log cumulative percent drug release vs log of time equation (Eqn.6).(20-23)
(i) Zero order kinetics
Qt=K0t………Eqn.(3) Where,
Q= Amount of drug release in time t
K0 = Zero order rate constant expressed in unit of concentration /time t = Release time
(ii) First order kinetics
Log Q=Log Q0-kt/2.303…………Eqn.(4)
Where,
Q0= is the initial concentration of drug k= is the first order rate constant t =release time
(iii) Higuchi kinetics
Q=kt1/2………...…Eqn.(5) Where,
k= Release rate constant
(iv) Korsmeyer-Peppas
First 60% in vitro release data was fitted in equation of Korsmeyer et al. to determine the release behavior from controlled release polymer matrix system. The equation is also called as power law,
Mt /M∞ =Kt n ……… Eqn.(6)
Where,
Mt = amount of drug released at time t
M∞ = amount of drug released after infinite time
Mt /M∞ = fraction solute release
t = release time
K = kinetic constant incorporating structural and geometric characteristics of the polymer system
n = diffusional exponent that characterizes the mechanism of the release of traces. The magnitude of the release exponent “n” indicates the release mechanism (i.e. Fickian diffusion, Non Fickian, supercase II release). For matrix tablets, values of n of near 0.5 indicates Fickian diffusion controlled drug release, and an n value of near 1.0 indicates erosion or relaxational control (case II relaxational release transport, non Fickian, zero order release).Values of n between 0.5 and 1 regarded as an indicator of both diffusion and erosion as overall release mechanism commonly called as anomalous release mechanism.(25-28)
RESULTS AND DISCUSSION
Preformulation characteristics:
[image:5.595.139.420.372.511.2]Figure 1: λmax of Vildagilptin in 0.1N Hcl (232 nm)
Figure 2: Calibration curve of Vildagliptin in 0.1N Hcl
y = 0.0201x + 0.0004 R² = 0.9998
0 0.1 0.2 0.3 0.4 0.5 0.6
0 5 10 15 20 25 30
Standard Calibration Curve of Vildagliptin in 0.1N Hcl
A
b
so
rb
an
ce
Table 2: Absorbences of Vildagliptin in 0.1N Hcl
S.No Concentration(mcg/ml) Absorbance (nm)
1 0 0
2 5 0.098
3 10 0.203
4 15 0.306
5 20 0.399
[image:6.595.141.444.232.370.2]6 25 0.501
Figure 3: λmax of Vildagliptin in pH 6.8 Buffer (227nm)
[image:6.595.208.390.400.471.2]
Table 3: Absorbences of Vildagliptin in 6.8 pH Phosphate buffer
S.No Concentration(mcg/ml) Absorbance (nm)
1 0 0
2 5 0.13
3 10 0.262
4 15 0.381
5 20 0.516
6 25 0.648
Figure 4: Calibration curve of Vildagliptin in 6.8 pH Phosphate buffer
Drug Excipient Compatibility Studies- FTIR: Drug-Excipient compatibility studies by FTIR revealed no
interaction between drug and the polymers used in the formulation thus showing compatibility. y = 0.0258x + 0.0002
R² = 0.9998
0 0.1 0.2 0.3 0.4 0.5 0.6 0.7
0 5 10 15 20 25 30
A
b
so
rb
an
ce
Concentration (µg/ml)
[image:6.595.141.454.488.664.2]Figure 5: FTIR spectra of Vildagliptin
Figure 6: FTIR spectra of Vildagliptin + Carbopol-940
[image:7.595.89.521.95.417.2]Figure 7: FTIR spectra of Optimized Formulation (Vildagliptin+Carbopol-940+PVP-K 30+IPA+Aerosil+Mg.Stearate+MCC)
Table 4: Pre compression parameters
F.Code Bulk density (g/ml)
Tapped density (g/ml)
Hausner’s ratio
Carr’s Compressibility Index (%)
Angle of repose (Ө)
F1 0.46±0.18 0.523±0.69 1.259±0.32 18.59±0.37 24.42±0.34
F2 0.481±0.26 0.517±0.17 1.301±0.09 16.12±0.13 24.55±0.17
F3 0.512±0.19 0.489±0.25 1.225±0.17 20.65±0.05 25.87±0.29
F4 0.564±0.03 0.612±0.06 1.259±0.58 19.74±0.68 26.19±0.44
F5 0.409±0.17 0.559±0.13 1.298±0.16 21.98±0.36 22.58±0.06
F6 0.49±0.25 0.598±0.18 1.276±0.05 17.02±0.24 27.09±0.07
F7 0.533±0.29 0.656±0.05 1.251±0.11 18.15±0.47 23.03±0.16
F8 0.431±0.32 0.532±0.16 1.329±0.08 19.06±0.14 25.01±0.35
F9 0.472±0.11 0.619±0.13 1.312±0.23 21.77±0.03 24.42±0.53
F10 0.546±0.36 0.651±0.36 1.297±0.17 17.56±0.49 26.57±0.18
F11 0.454±0.21 0.701±0.29 1.267±0.14 20.69±0.53 27.13±0.53
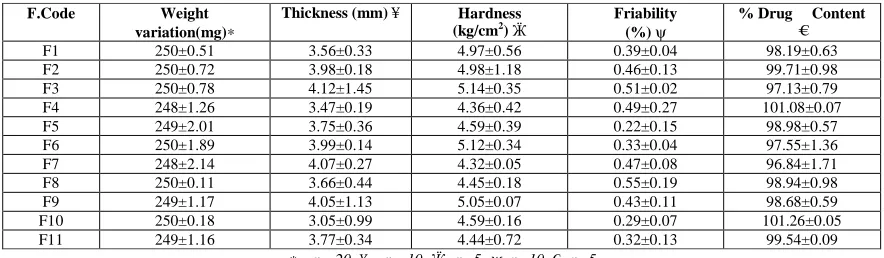
Physical characteristics of blends and tablets:
The blends of different formulations were evaluated for angle of repose, Carr’s compressibility index etc., the results of Angle of repose and Carr’s compressibility Index (%) ranged from 22-27.5 and 16-22, respectively which showed that blends from all the formulations having good flow property. The hardness and percentage friability ranged from
[image:8.595.77.519.194.323.2]4.0-5.25 kg/cm2 and 0.22-0.55% respectively.
Table 5: Post compression parameters
F.Code Weight
variation(mg)∗
Thickness (mm) ¥ Hardness (kg/cm2)
Ӝ
Friability (%) ψ
% Drug Content
€
F1 250±0.51 3.56±0.33 4.97±0.56 0.39±0.04 98.19±0.63
F2 250±0.72 3.98±0.18 4.98±1.18 0.46±0.13 99.71±0.98
F3 250±0.78 4.12±1.45 5.14±0.35 0.51±0.02 97.13±0.79
F4 248±1.26 3.47±0.19 4.36±0.42 0.49±0.27 101.08±0.07
F5 249±2.01 3.75±0.36 4.59±0.39 0.22±0.15 98.98±0.57
F6 250±1.89 3.99±0.14 5.12±0.34 0.33±0.04 97.55±1.36
F7 248±2.14 4.07±0.27 4.32±0.05 0.47±0.08 96.84±1.71
F8 250±0.11 3.66±0.44 4.45±0.18 0.55±0.19 98.94±0.98
F9 249±1.17 4.05±1.13 5.05±0.07 0.43±0.11 98.68±0.59
F10 250±0.18 3.05±0.99 4.59±0.16 0.29±0.07 101.26±0.05
F11 249±1.16 3.77±0.34 4.44±0.72 0.32±0.13 99.54±0.09
∗ = n= 20, ¥ = n =10, Ӝ=n=5, ψ=n=10, €=n=5
In-vitro dissolution studies:
Table 6: Dissolution release profiles of Formulations (F1-F6) The data are presented as mean value ± S.D. (n = 3)
Table 6.1: Dissolution release profiles of Formulations (F7-F11)
S.no Time(hrs)
CUMULATIVE % DRUG RELEASE
F7 F8 F9 F10 F11
1 0 0 0 0 0 0
2 1 12.81±0.35 10.98±0.78 12.60±0.32 11.08±0.47 10.85±0.34
3 2 15.44±0.41 12.29±0.69 16.99±0.47 15.86±0.59 13.07±0.27
4 3 21.59±046 19.41±0.17 25.45±0.56 23.38±0.52 25.75±0.45
5 4 36.58±0.59 28.57±0.43 32.21±0.45 30.77±0.48 30.71±0.34
6 5 49.76±0.33 37.65±0.65 44.07±0.48 39.65±0.36 38.07±0.29
7 6 56.57±0.64 49.16±0.77 57.02±0.63 46.28±0.55 50.52±0.16
8 7 69.83±0.48 54.03±0.65 58.63±0.45 50.78±0.64 61.15±0.37
9 8 77.42±0.52 66.95±0.52 66.65±0.67 54.37±0.13 64.65±0.25
10 9 83.94±0.37 72.63±0.49 72.13±0.58 66.54±0.29 72.84±0.55
11 10 89.05±0.64 84.37±0.57 77.54±0.69 70.08±0.63 79.33±0.64
12 11 93.26±0.46 89.86±0.61 81.48±0.75 77.73±0.14 86.26±0.73
13 12 96.98±0.68 92.19±0.58 86.56±0.79 83.89±0.15 94.18±0.27
The data are presented as mean value ± S.D. (n = 3)
S.no Time(hrs)
CUMULATIVE % DRUG RELEASE
F1 F2 F3 F4 F5 F6
1 0 0 0 0 0 0 0
2 1 4.88±0.72 2.09±0.56 4.85±0.24 3.52±0.53 12.64±0.39 9.62±0.47
3 2 8.42±0.36 8.67±0.24 8.49±0.48 12.62±0.57 18.66±0.46 15.70±0.16
4 3 16.95±0.12 17.09±0.41 14.06±0.63 19.53±0.71 24.09±0.57 28.73±0.39
5 4 23.61±0.48 24.35±0.62 18.67±0.57 25.40±0.53 29.91±0.28 34.49±0.41
6 5 31.97±0.63 33.19±0.73 19.28±0.38 30.01±0.47 38.39±0.81 47.51±0.54
7 6 44.36±0.75 44.98±0.46 25.36±0.59 35.07±0.56 46.01±0.53 56.01±0.45
8 7 51.49±0.71 53.37±0.57 38.33±0.79 42.66±0.54 53.08±0.62 65.18±0.68
9 8 59.66±0.43 66.53±0.61 45.17±0.71 54.65±0.63 67.29±0.47 72.26±0.61
10 9 64.28±0.61 74.69±0.13 59.89±0.42 60.09±0.39 69.11±0.63 79.40±0.59
11 10 72.31±0.87 82.87±0.59 68.12±0.48 66.08±0.58 75.56±0.79 86.09±0.71
12 11 84.57±0.18 94.26±0.75 78.91±0.54 75.64±0.41 80.03±0.57 89.21±0.55
Figure 8: Dissolution profiles of Formulations F1-F3
Figure 9: Dissolution profiles of Formulations F4-F7
[image:9.595.120.476.109.592.2]
Figure 10: Dissolution profiles of Formulations F8-F11 0
20 40 60 80 100 120
0 2 4 6 8 10 12 14
F1
F2
F3
IN-VITRO DISSOLUTION OF VILDAGLIPTIN
Time in hrs
%
D
ru
g
R
el
ea
se
0 20 40 60 80 100 120
0 2 4 6 8 10 12 14
F4
F5
F6
F7
IN-VITRO DISSOLUTION OF VILDAGLIPTIN
Time in hrs
%
D
ru
g
R
el
ea
se
0 20 40 60 80 100 120
0 2 4 6 8 10 12 14
F8
F9
F10
F11
%
D
ru
g
R
el
ea
se
Time in hrs
Release Kinetics for Optimized formulation F2:
y = 8.9627x - 7.51
R² = 0.9917
-20 0 20 40 60 80 100 120
0 5 10 15
C
u
m
u
la
ti
v
e
%
d
ru
g
r
el
a
se
Time
Zero order
y = -0.1356x + 2.3293
R² = 0.7072
-0.500 0.000 0.500 1.000 1.500 2.000 2.500
0 5 10 15
L
o
g
%
d
ru
g
r
em
a
in
in
g
Time
First order
y = 32.494x - 26.843
R² = 0.8732
-40 -20 0 20 40 60 80 100 120
0 1 2 3 4
Table 7: R2 value of drug release kinetics models
S. No. Model R2
1 Zero Order 0.9917
2 Firs t Order 0.7072
3 Higuchi 0.8732
4 Peppas 0.8715
CONCLUSION
The Present Research work was to formulate and evaluate SR Matrix tablets of Vildagliptin was prepared by wet granulation technique by using different polymers of Carbopol and Eudragit grades. Fourier Transforms Infrared Spectroscopy indicated the absence of probable chemical interaction between the drug and polymers used in different proportions. Formulations (F1-F11) fulfill the official limit for Physico Chemical parameters like weight Variation, hardness, friability and drug content uniformity. In-vitro dissolution studies showed that tablets of Vildagliptin in 1:1(Drug: Polymer) proportion, prepared by wet granulation method is the best to increase sustain effect due to the polymer concentration. Formulation F2 Shows sustained drug release of 99.37±0.87 % in 12 hours so it was selected as the best formulation among all the formulations. The Release Kinetics of drug was explained
by Zero order equation (R2 = 0.9917).
Acknowledgements
The author would like to sincerely gratitude to the MSN Laboratories Pvt. Ltd, Hyderabad, for providing all requirements for this Research work. I am also thankful to Yarrow Chem Products, Mumbai, for providing drugs and Polymers.
REFERENCES
[1]Ajaykumar Patil; Ashish Pohane; Ramya Darbar; Sharanya Koutika; Alekhya Pothanganti. Int. J. Appl. Bio.
Pharm. Tech., 2011, 2(3), 242-246.
[2]Ashraful Islam S.M; Asaduzzaman Md; Rezowanur Rahman; Saifur Rahman Khan. J. Appl. Pharm. Sci., 2011, 1(8), 131-136.
[3]Ashuthosh Kumar S; Vijaya kumar G;Karthikeyan M; Manidipa S;Ravisankar V; Arunachalam. Int. J. Pharm.
Bio. Arch., 2010, 1(5), 416-420.
[4]N.Sravan Kumar; Y.Ganesh Kumar; CH.Chandana; J.Kunal Kumar. Int. J. Pharm. and Tech., 2014, 6(1), 6224-6238.
[5]Barot N, Darshan M; Dr.Praful D. Int. J. Pharm. Res. and Bio. Sci., 2014, 3(2), 370-396.
[6]Bhavani B; Kamala Kumari P.V; Chowdary K.P.R. Int. J. of Pharm. and Biomed. Res., 2012, 3(1), 44-48. [7]Bhunia S.N; Sarkar B.K; Parwal M. Adv. Res. Pharm. Bio., 2012, 2(1), 95-103.
[8]Chaitanya B; Vishnu P; Shireesh kiran R; Naveenbabu K; Vijayavani Ch. Int. J. Pharm., 2013,3(3),587-593.
y = 95.572x - 19.012
R² = 0.8715
-40 -20 0 20 40 60 80 100 120
0.000 0.200 0.400 0.600 0.800 1.000 1.200
L
o
g
C
u
m
u
la
ti
v
e
%
d
ru
g
re
le
a
se
Log Time
Ghosh & Barik
[9]Chandana CH; Ganesh Kumar Y; Vamshi Vishnu Y; Minnu Madhuri M. Int. J. Pharm. Pharm. Sci.,
2014,6(7),481-486.
[10]Dinesh Kumar Mishra; Dinesh Kumar Jain. Bull. Pharm. Res., 2014, 4(2), 81-5.
[11]Divya P; Rajajayarao Y; Divyasree K; Manohar Babu S. Int. J. Res. Pharm Chem., 2014,4(1),34-45.
[12]Dhrupesh R.Panchal; Upendra patel; Bhavin Bhimani; Dhiren Daslaniya; Ghanshyam Patel. Int. J. Pharm. Res.
Bio. Sci., 2012, 1(4),75-101.
[13]Y.Ganesh Kumar; J.Sreekanth; D.Satyavati; P.Chaitanya, B.Swetha. Int. J. Pharm. Tech. Res., 2013, 5(3), 1332-1344.
[14]C.Kalyani; T.Rama Rao; G.Rajesh; K.Kalyan kumar. Asi.J.Pharm.Clini.Res., 2011,4(3),18-22. [15]Kamlesh J. Wadher; Rajendra B. Kakde; Milind J. Umekar. Int. J. Res. Cont. Rel., 2011, 1(1), 9-16.
[16]Kunal.J.Patil; Dr.Surajj M.Sarode; B.S.Sathe; Dr.P.V.Jain; B.V.Jain. World. J. Pharm. Pharm. Sci., 2014, 3(4), 857-869.
[17]P.Mahajan; S.C Mahajan; D.K Mishra. Int. J. Pharm. L. Sci., 2011, 2(1), 521-530.
[18]Manivannan Rangasamy;Venkata Krishna Reddy Palnati;Lakshmi Narayana Rao Bandaru. Int. Cur. Pharm. J.,
2013, 2(10), 165-169.
[19]A.Mohsen;O M Khoweysa;R A Shoukri. J. Pharm. Res. Opi., 2012, 2(1),12 – 22.
[20]K.Murali Krishna; S.Arunkumar. Res. J. Pharm, Bio. Che. Sci., 2012, 3(4), 1146-1158.
[21]Pamu.Sandhya; Hameeda Zareen Durani; Zaara Majeed; Y.Ganesh Kumar. Int. J. Sci. Res. Pub.,2014, 4(2),1-8. [22]Prakash B. Mote; Pavan K. Rawat; Shailendra K Singh; Nityanand S. Zadbuke, Amarjit A. Salunke, Vivek B. Rajendra. J. Dru. Del. Thera., 2013, 3(2),88-92.
[23]Prakash Rao R.B, Vijay K, Narendra C,Jitendra. Int. J. Pharmaceutics. Drug. Anal., 2014, 2(9), 710-718. [24]Priyanka D; Sravani K; Sravani R; Srinivas Reddy K; Vinay Kumar D. Int. J. Cur. Pharm. Res., 2014, 6(4), 69-75.
[25]Priyanka S; Shiva Kumar B; Ashraful Islam SM; Selim Reza Md; Santosh A. Res. J. Pharm, Bio. Chem. Sci.,
2014, 5(4), 811-825.
[26]Ramya Chakrahari; Shanmugam S; Sundarmoorthy K; Ayyappan T; Vetrichelvan T. Int. J. Pharm.Tech. Res.,
2011, 3(1), 526-534.