Numerical Study of Flow Separation and Pressure Drop for Flow past
Staggered Tube Bundles
Azmahani Sadikin
1,aand Norasikin Mat Isa
1,b1Centre for Energy and Industrial Environement Studies (CEIES), Faculty of Mechanical
Engineering and Manufacturing, Universiti Tun Hussein Onn Malaysia, 86400 Parit Raja, Malaysia
a
[email protected], [email protected]
Keywords: Flow separation, pressure drop, heat exchanger, staggered bundle, CFD
Abstract. The vertical single-phase flow was studied on the shell side of a horizontal tube bundle. In the present study, CFX version 14.0 from ANSYS was used to predict the flow regimes in the 19 mm diameter in staggered configuration with a pitch to diameter ratio of 1.32. The simulations were undertaken to inform on how the fluid flowed within the tube passages. The results show that the tube bundle arrangement in a heat exchanger does effect to the flow separation and re-attachment points. This is consistent with other published data.
Introduction
Computational Fluid Dynamics
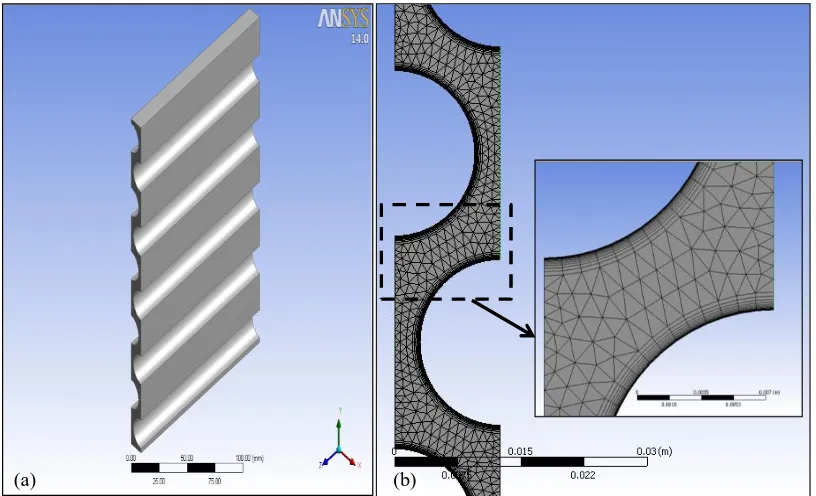
The flow in a tube passage is assumed to be symmetrical because the geometry and physical conditions causing it are symmetrical and because the flow in any passage between the tubes is likely to be the same as that in any other. So, in the simulations, only a symmetrical half of a flow passage between the tubes is used. The flow is simulated over ten tubes in the flow direction to ensure fully developed flow is achieved. The tube bundle was created in DesignModeler. Two dimensional model was produced in CFX-PRE for the symmetrical half of the water-only bundles. The tube bundle model and grids are shown in Fig. 1. The model was constructed with a grid 0.25 mm in length. The meshing gave a total of 336,000 nodes and had 1,000,000 elements that consisted of prisms, as shown in Fig. 1(b). The insert picture shows the tube surface inflation was set to rectangular nodes. The tubes were set to solid surfaces with no slip and the east, west, front and back surfaces set to the symmetrical boundary condition. The opening boundary condition at the top of the bundle was set to atmospheric pressure and the inlet boundary was set to a normal velocity of 6 m/s. An inflation layer of 1.0 mm thickness and containing 16 layers with an expansion factor of 1.3 was inserted between the tube walls and the bulk fluid to capture the effects near the wall. The simulation was run until the residual of the pressure and velocities were less than 0.00001.
Figure 1: The model (a) 19 mm in diameter staggered bundle (b) the grids and inflation
Results and Discussion
Fig. 2(a) shows the velocity vectors for the bundle. The fluid flow is high in the main stream and follow a more torturous path. As the fluid flows past the tubes, which was set to no slip at the wall, the fluid decelerates near the tube surface and creates a thin layer, called the boundary layer, due to viscous effects. The flow is attached to the tube surface until the formation of a wake, evident to the rear of the tube, where some of the fluid is flowing backward against the main flow. The maximum velocity occurs at = 90. Near = 180, the velocity is at a minimum or zero. This is where the circulation happens, see Fig. 2(b). The flow re-attaches at the front of the tube.
[image:2.595.103.511.324.572.2]Figure 2: (a) Main stream flow and re-circulation zone between the tubes (b) Separation point and re-attachment point
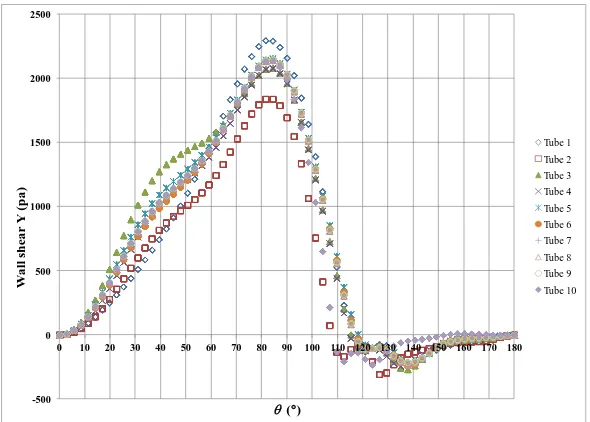
Flow separation occurs when the shear stress is zero as shown in Fig. 3. The flow separates at S =
[image:3.595.75.524.70.283.2]116. The flow re-attaches at the tube front, as seen in the Fig. 2(a) and Fig. 2(b), i.e. R = 0.
Figure 3: Wall shear Y distribution around the tube surface at various angles on the tubes. Separation flow is at S = 116 and re-attachment flow is at R = 0
The pressure drop is largest on the first row of tubes, as seen in Fig. 4. This is caused by fluid acceleration due to the reduction in flow area. The staggered alignment gives further reductions in pressure due acceleration and separation from the tube walls. As a result, the friction pressure loss is higher in the staggered tube bundle arrangement. As expected, the pressure is shown to gradually decrease and increase as the flow moves around the tubes. The pressure drop in these tubes is caused by the reduction in flow area as the flow moves towards the minimum gap. Pressure recovery occurs as the flow separates from the tube just after the minimum gap and expands to re-attach to the next tube. There is a net pressure drop across each tube due to friction.
-500 0 500 1000 1500 2000 2500
0 10 20 30 40 50 60 70 80 90 100 110 120 130 140 150 160 170 180
W
a
ll
s
h
ea
r
Y
(p
a
)
()
Tube 1
Tube 2 Tube 3 Tube 4
Tube 5 Tube 6 Tube 7 Tube 8
Tube 9 Tube 10 Main flows
Re-circulation
zones Separation point
Re-attachment point Re-attachment
point
[image:3.595.151.446.391.602.2]Figure 4: Variation of pressure with distance through the tube banks
The pressure distribution around the tubes for the staggered tube bundle is shown in Fig. 5. The pressure is highest at = 0 and decreases as the flow travels from = 0 to = 90, where the pressure reaches a minimum as the maximum velocity occurs at = 90, see Fig. 2(b) and Fig. 3. The pressure recovers a little up to the separation point at S = 115 where the flow separates from
the tube surface. The wake region at the rear of the tube will cause a low pressure region due to turbulent dissipation. The drag force results from boundary layer separation, the pressure on the rear half of each tube being considerably less than that on the front half ( = 90 to = 180). Overall, the loss of energy in the direction of flow is shown. As the fluid flows from = 0 to = 90, the pressure falls. The increase in pressure in the direction of flow along the rear half of the tube from = 90 to = 180 is seen in the figure for all tubes.
Figure 5: Pressure distribution around the tubes surface at various angles on the tubes
Comparisons with previous work
The velocity vectors for staggered arrangement are different when compared to in-line bundles in [8]. The separation and re-attachment flows are different too for both arrangments. Re-circulation flow is formed in every vertical minimum gap between the tubes for inline bundle, whereas for the
-200000 -100000 0 100000 200000 300000 400000 500000 600000 700000
0 50 100 150 200 250
P
re
ss
u
re
(
P
a
)
Distance through tube bank (mm)
-300000 -200000 -100000 0 100000 200000 300000 400000 500000 600000 700000
0 10 20 30 40 50 60 70 80 90 100 110 120 130 140 150 160 170 180
P
re
ss
u
re
(P
a
)
()
Tube 1 Tube 2 Tube 3
Tube 4 Tube 5 Tube 6
Tube 7 Tube 8 Tube 9
[image:4.595.151.448.478.691.2]staggered bundle, the re-circulation flow is formed at the top of the tubes, as shown in Fig. 2(b). The water creates a significantly bigger re-circulation zone for both in-line bundles [8], in comparison to the staggered bundle, where the fluid only creates a small re-circulation zone. However, the in-line and staggered arrangements both have a high velocity in the minimum gaps where the water flow is not separated from the walls. Flow separation is delayed in the staggered arrangement, when compared to inline bundles in [8] where the separation point is at S = 116 and the re-attachment
point occurs at R = 0 as shown in Fig. 3.
Conclusion
The re-attachment angle in single-phase flow suggests it is smaller than two-phase flow, whereas the separation angle in single-phase flow suggests that it is larger than two-phase flow. The re-attachment and separation angles are important because they control the size of the form loss and drag force created by the wakes at the rear of the tubes. The re-attachment point is at R = 0 and
separation point is at S = 90 for staggered bundle. These values are chosen to best fit to the data,
supported by the single-phase CFD simulations presented in this paper. Therefore, prediction of flow separation for other working fluid and geometry is warranted.
Acknowledgement
The author would like to thank the Universiti Tun Hussien Onn Malaysia (UTHM) and Ministry of Higher Education of Malaysia (MoHE) for financial support. This work was also supported by Research Acculturation Grant Scheme (RAGS) (No. R028).
References
[1] Kumar S., 2003, Recirculation model of kettle reboiler, International Journal of Heat and Mass Transfer, 46(15), 2899-2909.
[2] Jensen M.K., 1998, Model for the recirculating flow in a kettle reboiler, in: Proceedings, Houston, TX, USA, Publ by AIChE, New York, NY, USA.
[3] Bamardouf K.H., McNeil D.A., Experimental and numerical investigation of two-phase
pressure drop in vertical cross-flow over a horizontal tube bundle, Journal of Applied Thermal
Engineering, 29, (2009) 1356-1365.
[4] Sadikin A., McNeil D.A., Bamardouf K.H., 2010, Two-phase flow on the shell side of a shell
and tube heat exchanger, In: Proc. of the 14th Int. Heat Transfer Conference, August 8-13,
Washington DC, USA.
[5] McNeil D.A., Bamardouf K.H., Burnside B.M., Almeshaal M., 2010, Investigation of flow
phenomena in a kettle reboiler. International Journal of Heat and Mass Transfer, 53, 836-848.
[6] Grant I.D.R., Chisholm D., 1979, Two-phase flow on the shell side of a segmentally baffled
shell-and-tube heat exchanger, Journal of heat transfer, Transaction ASME, 101(1), 38-42.
[7] McNeil D.A., Sadikin A., Bamardouf K.H., 2012, A mechanistic analysis of shell-side
two-phase flow in an idealized in-line tube bundle, International Journal of Multiphase Flow, 45, 53-69.
[8] Sadikin A., Mat Isa N., 2014, Flow separation prediction in a single-phase flow in an inline tube