International Journal of Emerging Technology and Advanced Engineering
Website: www.ijetae.com (ISSN 2250-2459, Volume 2, Issue 11, November 2012)130
Surface Modification of Nanotitania Using High Energy
Electron Beam Irradiation
Priyanka KP
1, Sunny Joseph
2, Anu Tresa Sunny
3, Jaseentha OP
4, Thomas Varghese
51,2,4,5
Nanoscience Research Centre (NSRC), Department of Physics, Nirmala College, Muvattupuzha – 686 661, Kerala, India
3School of Chemical Sciences, Mahatma Gandhi University, Kottayam, 686 560, Kerala, India
Abstract - Nanocrystalline TiO2 particles were prepared
using a low temperature sol-gel synthesis route, and were characterized by X-ray diffraction, transmission electron microscopy, UV-Visible spectroscopy and photoluminescence spectroscopy. Using high energy electron beam the surface modification of TiO2 was carried out. The optical properties
of the synthesized nanocrystalline TiO2 samples and the
electron beam irradiated samples were investigated in context of the band gap. The band gap obtained from the absorption spectra of irradiated sample shows a slight increase as compared to the pure samples, which might occur due to size reduction. The photoluminescence intensity of the irradiated sample was much larger as compared to the non-irradiated samples, which has been attributed to defects and particle size variation. The present investigation found that the beam irradiation is a new efficient method to enhance the optical absorption performance and photo-activity of TiO2
nanoparticles.
Keywords - Band gap, Electron beam irradiation, Nanotitania, Optical properties, Photoluminescence.
I. INTRODUCTION
Nanocrystalline TiO2 particles are of great interest due to
their unique optical and electronic properties, and several potential technological applications such as photocatalysis,
sensors, solar cells and memory devices [1-4]. TiO2 exists
in three polymorphic phases: rutile (tetragonal, density =
4.25 g/cm3), anatase (tetragonal, 3.894 g/cm3) and brookite
(orthorhombic, 4.12 g/cm3). The low-density solid phases
are less stable and undergo transition to rutile in the solid state. The transformation is accelerated by heat treatment and occurs at temperatures between 450 and 1200oC. This transformation is dependent on several parameters such as initial particle size, initial phase, dopant concentration, reaction atmosphere and annealing temperature [5-9].
Anatase phase is metastable and exhibits large
photocatalytic activity; rutile has a high chemical stability but is less active. The absorption spectrum of a semiconductor defines its possible uses. The useful semiconductors for photocatalysis have a band gap comparable to the energy of the photons of visible or ultraviolet light, having a value of Eg < 3.5 eV.
It has been reported in the literature that the value of Eg ranges from 2.86 to 3.34 eV for the anatase phase. The variations may be due to differences in the stoichiometric of the synthesis, the impurities content, the crystallite size and the type of electronic transition [10-15].
Control of the size, shape and structure of the colloidal precursor is an important factor in determining the properties of the nanomaterial. Titania powders can be synthesized using various methods such as sulfate process [16], chloride process [17], impregnation [18], co-precipitation [19], hydrothermal method [20-22], direct
oxidation of TiCl4 [23] and metal organic chemical vapor
deposition method [24]. Sol-gel method [25-27] is one of the most suitable routes to synthesize various metal oxides due to low cost, ease of fabrication and low reaction
temperatures. This method is widely used to fabricate TiO2
for films and particles. In general, the sol gel process involves the transition of a system from a liquid “sol” (mostly colloidal) into a solid “gel” phase. The homogeneity of the gels depends on the solubility of reagents in the solvent, the sequence of addition of reactants, the temperature and the pH. The optimum fabrication conditions are provided for the narrow size
distribution of the nanocrystalline TiO2.
In the present investigation, as-prepared TiO2
nanoparticles are characterized by X-ray diffraction (XRD), transmission electron microscopy (TEM), UV-Visible absorption spectroscopy and photoluminescence (PL) spectroscopy. In addition, absorption and PL spectra of the electron beam irradiated sample are evaluated in context of the band gap.
II. EXPERIMENTAL
Titanium (IV)-n-butoxide (Ti(OBu)4) (98%, Alfa Aesar),
isopropyl alcohol (99%, Fisher Scientific) and HNO3
(Merck) were used for the synthesis of nanocrystalline
TiO2. Distilled water was used in all synthesis process.
A. Preparation of the Samples
In this work, the precursor solution was a mixture of 5 cc
titanium (IV)-n-butoxide (Ti(OBu)4) and 10 cc isopropyl
International Journal of Emerging Technology and Advanced Engineering
Website: www.ijetae.com (ISSN 2250-2459, Volume 2, Issue 11, November 2012)131
The mixture solution was then added drop wise into another solution whose pH value was suitably adjusted to
2.0 by adding HNO3. The reaction was performed at room
temperature while stirring for 3 hours. After complete
hydrolysis of Ti(OBu)4, the solution was refluxed at 700C
for 20 hours and a sol was formed. Finally, the as-prepared
sol was dried at 600C for 36 hours to obtain TiO2 powders.
The obtained powder samples were calcined for 3 hours in
a furnace at temperature ranging from 150 to 400 0C in an
ambient atmosphere.
The as-prepared TiO2 nanoparticles were irradiated with
an electron beam of 8 MeV energy obtained from a variable energy Microtron, Department of Physics,
Mangalore University, Mangalore. Samples of TiO2
nanoparticles were irradiated at a dose rate of 2.0, 2.5, 3.0 and 3.5 kGy, and characterized by absorption and PL spectra. However, the samples with 3.5 kGy dose rate only have made significant modifications on the measured spectra.
B. Characterization
The structural characteristics of the synthesized
titania nanoparticles have been studied by X-ray
powder diffraction using Bruker D8 Advance
X-ray diffractometer (
= 1.5406 Å) with Cu-Kα
radiation in 2θ range from 20º to 70º. From the
X-ray diffraction patterns, it is observed that all the
X-ray peaks of the pure TiO
2are well matching
with the X-ray pattern of JCPDS Card No.
21-1272. X-ray diffraction analyses were carried out
for the identification of the crystal phase and the
estimation of the average crystallite size. The
crystallite size was estimated from the Debye–
Scherrer equation [28]. The Debye–Scherrer
equation is given by
t= 0.9 λ/β cosθ, (1)
Where λ is the X-ray wavelength, β is the full width at half maximum (FWHM) of the peak and θ is the Bragg’s angle.
Transmission electron microscopy is a unique tool to get direct image of nanoparticles. It can give a real space image on the atom distribution in the nanocrystal and on its surface.
High magnification imaging with lattice contrast allows the determination of individual crystal morphology. For
TEM studies, the TiO2 powder was dispersed in ethanol
using an ultrasonic bath. A drop of suspension was placed on a copper grid coated with carbon film. After drying, the copper grid containing nanoparticles was placed on the holder for the imaging process. TEM photographs of the as
prepared nanocrystalline anatase TiO2 powder samples
were taken from a Tecnai 30 G2 S-twin (model), FEI make
300 KV High Resolution Transmission Electron
Microscope (HRTEM). The TEM images provide good reviews of the sample surface.
[image:2.612.327.560.373.608.2]The absorption spectra of the pure and irradiated samples were recorded with a Shimadzu UV-Visible Spectrophotometer-UV 2600 model with ISR. For the measurement, the nanoparticles were pressed into thick pellet, and placed at the entrance port of the integrating sphere. Calibration of the absorption scale was done by standard reference material. The wavelength varies from 200 to 800 nm.
International Journal of Emerging Technology and Advanced Engineering
Website: www.ijetae.com (ISSN 2250-2459, Volume 2, Issue 11, November 2012) [image:3.612.55.282.136.508.2]132
Fig. 2. TEM photograph of TiO2 nanoparticles calcined at 400 0C.
Photoluminescence spectrum is an effective way to investigate the electronic structure and optic characteristics of semiconductor nanomaterials, by which the information such as surface oxygen vacancies, defects, separation and recombination of photo-induced charge carriers can be obtained [29]. Photoluminescence spectra were measured at room temperature by Fluoromax-3 Spectrophotometer. The effect of electron beam irradiation on PL spectra was investigated.
III. RESULTS AND DISCUSSION
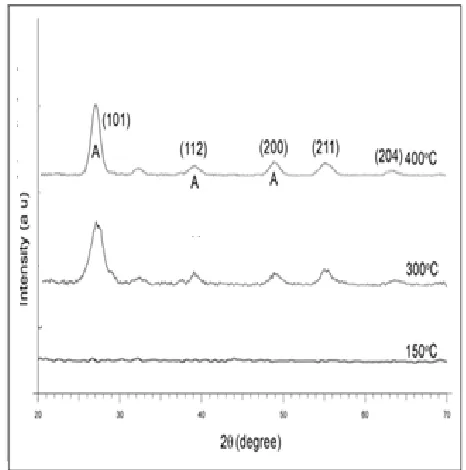
Figure 1 shows the X-ray diffraction patterns of as
prepared and calcined TiO2 samples. The XRD pattern of
the sample calcinated at 300 0C revealed the presence of
the anatase phase and was most complete at 400 0C.
The crystallite size obtained using equation (1) was 6 nm
for TiO2 calcined at 400 0C. Figure 1 also shows that the
diffraction peaks become intense and their FWHM
gradually decreases with increasing calcinations
temperature, verifying the increase in particle size and increase in pertinent phase.
TEM was used to further examine the particle size, crystallinity and morphology of samples. TEM bright field
images of TiO2 nanoparticles in anatase phase are shown in
figure 2. The TEM image reveals that particles are spherical or going to be spherical in shape. As can be seen from the TEM image that the average particle size is less than 8 nm, which is in agreement with the crystallite size obtained from XRD pattern.
Figure 3 shows the absorbance spectra of pure and
irradiated samples of anatase TiO2 nanoparticles. Although
the curve shape of the absorbance spectrum of TiO2
nanoparticles did not show large change after the electron beam irradiation, it could be found that the absorbance spectrum shifted to the blue region, attributed to the quantum size effect [30]. The band gap obtained from the
graph for pure and irradiated anatase TiO2 samples were
2.85 eV and 2.91 eV respectively. This increase of band gap might occur due to size reduction of the nanoparticles caused by the electron beam irradiation. An additional advantage due to size reduction is that the large surface area to volume ratio makes possible the timely utilization of photogenerated carriers in interfacial processes [31]. Moreover, it could be seen that beam irradiation improved
the optical absorption performance of TiO2 nanoparticles.
Hence, they can be better suited for the fabrication of efficient solar cells.
[image:3.612.337.547.510.694.2]International Journal of Emerging Technology and Advanced Engineering
Website: www.ijetae.com (ISSN 2250-2459, Volume 2, Issue 11, November 2012)133
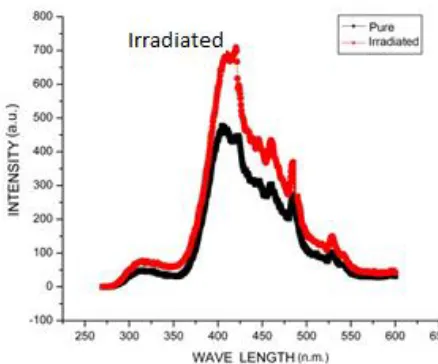
Figure 4 shows the room temperature photolum-inescence emission spectra of pure and irradiated samples
of anatase TiO2 nanoparticles. The TiO2 nanoparticles
could exhibit a strong and wide PL signal at the range from 400 to 500 nm with the excited wavelength of 300 nm and has two obvious PL peaks at about 420 and 480 nm respectively, possibly the former mainly resulting from band edge free excitons and the latter mainly resulting from
binding excitons [31,32]. In addition, it is found that pure
and irradiated TiO2 nanoparticles both could exhibit
obvious PL signal with similar curve shape. However, there was a small blue shift in the case of irradiated sample because the electron beam irradiation might result a slight reduction in particle size. It is obvious that decrease in particle size increase the surface energy, which can be attributed to the quantum confinement [33]. As a result, a slight blue shift (≈0.015 eV) in emission peak was observed. Besides, it is noted that the intensity of PL spectra of irradiated samples are much larger as compared to the non-irradiated samples. However, Jun and his co-workers reported that PL intensity decreased with beam irradiation [34].
[image:4.612.54.273.479.661.2]The increase in PL intensity for irradiated sample is attributed to the self-trapped excitons recombination which is a combined effect of defect centers generated from oxygen vacancies, formation of small size particle, growth of the brookite phase and increased absorption over the UV and visible range [35]. The increase in PL intensity is an indication of higher photocatalytic activity.
Fig. 4.Room temperature PL spectra of TiO2 samples.
IV. CONCLUSION
Nanocrystalline titania was synthesized by sol-gel
synthesis route, and was characterized by XRD, TEM, UV-Visible and PL spectroscopy. The optical properties of the pure and the beam irradiated samples were investigated in context of the band gap. The absorbance spectra of irradiated samples shifted to the blue region, attributed to the quantum size effect. The band gap obtained for
irradiated TiO2 samples were larger as compared to the
pure sample. This increase of band gap might occur due to size reduction of the nanoparticles caused by the beam irradiation. The PL intensity of the irradiated sample was more, which has been attributed to defects and particle size variation. Moreover, the electron beam irradiation is found to be a new efficient method for the enhancement of the photo-response and improvement of the photo-activity of
TiO2 nanoparticles.
Acknowledgments
The authors acknowledge their thanks to Nirmala College, Muvattupuzha and Microtron Centre, Mangalore University, Mangalore, Karnataka State for providing the opportunity to undertake this study. The financial support by KSCSTE, Thiruvananthapuram, Kerala is gratefully acknowledged.
REFERENCES
[1 ] Li, W., Shah, S.I., Huang, C.P., Jung, O. and Ni, C. 2002. Mater. Sci.Eng. B, 96, 247.
[2 ] Remillard, J.T., McBride, J.R., Nietering, K.E., Drews, A.R. and Zhang, X. 2000. J.Phys.Chem.B,104, 4440.
[3 ] Traversa, E. 1995. J.Am.Ceram.Soc.78, 2625.
[4 ] Kingon, A.I., Maris, J.P. and Steiffer, S.K. 2000. Nature 406, 1032.
[5 ] Tsevis, A., Spanos, N., Koutsoukos, P.G., Van der Linde and Lyklema, J. 1998. J. Chem.Soc, Faraday Trans. 94(2), 295. [6 ] Zhang, H.Z. and. Banfield, J.F.1998. J. Mater.Chem, 8, 2073. [7 ] Zhang, H.Z. and. Banfield, J.F.2000. J. Phys.Chem.B, 104, 3481. [8 ] Ranade, M.R., Navrotsky, A, Zhang, H.Z., Banfield, J.F., Elder,
S.H., Zaban, A., Borse, P.H.. Kulkarni, S.K., Doran, G.S. and Whitfield, J.H. 2002. PNAS 99, 6476.
[9 ] Arbiol, J., Cerda, J., Dezanneau, G., Cirera, A., Peiro, F., Cornet, A. and Mornate, J.R. 2002. J. Apply.Phy. 92, 853.
[10 ]Jing, L., Li, S., Song, S., Xue, L. and Fu, H. 2008. Solar Energy Mater Solar Cells 92, 1030-6.
[11 ]Wang, G. 2007. J. Mol.Catal. A: Chem. 274, 185-91.
[12 ] Sahni, S., Reddy, B. and Murty, B. 2007. Mater. Sci. Eng. A,; 452, 758-62.
International Journal of Emerging Technology and Advanced Engineering
Website: www.ijetae.com (ISSN 2250-2459, Volume 2, Issue 11, November 2012)134
[14 ]Hidalgo, M., Aguilar, M., Maicu, M., Navio, J. and Colon, G. 2007. Catal. Today 129, 50-8.
[15 ]Hossain, F., Sheppard, L., Nowotny, J. and Murch, G. 2008. J. Phys. Chem. Solids 69, 1820-8.
[16 ]Howe.Grant M. 1997. Encyclopedia of Chemical Technology, vol.24, p.225, John Wiley & Sons, Inc (1997)
[17 ]Litter, M.I. and Navio, J.A. 1994. J. Photochem.Photobiol.A.Chem. 84, 183.
[18 ]Palmisano, L., Augugliaro, V, Sclafani, A. and. Schiavello, M. 1998. J. Phys.Chem. 92, 6710.
[19 ]Wang,Y., Cheng, H., Hao, Y., Ma, J., Li, W. and Cai, S. 1999. J. Mater.Sci. 34, 3721.
[20 ]Cheng, H., Ma, J., Zhao, Z. and Qi, L.1995. Chem.Mater. 7, 663. [21 ]Wang, Y., Hao, Y. , Cheng, H., Ma, J., Xu, B., Li, W. and Cai, S.
1999. J. Mater. Sci. 34, 2773.
[22 ]Akhtar, M.K., Xiong, Y. and Pratsinis, S.E. 1991. AIChE J. 37, 1561.
[23 ]Ding, Z., Hu, X., Lu, G.Q., Yue, P.L. and Greenfield, P.F. 2000. Langmuir 166,216.
[24 ] Wang, C.C., Zhang, Z. and Ying, J.Y. 1997.NanoStructured Mater. 9, 583.
[25 ]Varghese, Thomas and Balakrishna, K.M. 2011. Nanotechnology: An introduction to synthesis, properties and applications, Atlantic Publishers, New Delhi.
[26 ]Burns, A., Hayes, G., Li, W., Hirvonen, J., Demaree, J.D. and Shah, S.I. 2004. Mat. Sci. and Eng, BXXX MSB, 9793, 1-6. [27 ]Mahshid, S., Ghamsari, M.S., Askari, M., Afshar, N. and Lahuti,
S. 2006. Semicond. Phys., Quant. Electronics & Optoelectronics V. 9, 65-68.
[28 ]Gabaland, M.A., and Angari, Y.M. 2009. Mat. Chem. & Phys. 115, 578-584.
[29 ]Zhang, W.F., Zhang, M.S., Yin, Z and Chen, Q. 2000. Appl. Phys. B 70, 261–265.
[30 ]Jing, L.Q., Xu, Z.L. and Sun, X. J. 2001. Appl. Surf. Sci. 180, 308–314.
[31 ]Kingon, A.I., Maris, J.P. and Steiffer, S.K. 2000. Nature (London) 406, 1032.
[32 ]Li, W., Ni, C., Lin, H., Huang, C.P. and Ismat S.2004. J. of Appl. Phys. 96 (11), 6663.
[33 ]Liqiang, J., Xiaojun, S., Baifu, X., Baiqi, W., Weimin, C. and Honggang , F. 2004. J. Solid State Chem. 177, 3375–3382. [34 ]Jun, J., Shin, J.H., Choi, J.S. and Dhayal, M. 2006. J. Biom. Nano.
2(2), 152-156.