CORRELATION PROPERTIES AND MULTIPLE-ACCESS
PERFORMANCE OF GOLD CODES
Olanrewaju Bola Wojuola, Stanley Henry Mneney and Viranjay Srivastava
School of Engineering, University of KwaZulu-Natal, South Africa E-mail: [email protected]
ABSTRACT
Significance of properties of spreading codes in the performance of CDMA-based systems cannot be overemphasized. This paper investigates correlation properties and multiple-access performance of some m-sequences and Gold codes. The Gold codes were generated from appropriate combinations of preferred pairs of m-sequences, obtained from software implementation of linear feedback shift registers. The correlation properties of the codes were tested prior to their deployment in a multi-user spread-spectrum communication system. Software simulations were carried out on the system bit-error-rate performance for transmission of random QPSK symbols through the channel. Transmitted data were encoded using 31, 127, 511 and 2048-chip Gold codes. The system bit-error-rate was computed and analysed for increasing number of interfering users. Results show that under increasing load, bit-error-rateof the Gold codes exhibited no error floor or significant system saturation. The results show that certain Gold codes have better properties that make them excellent for multiple access applications.
Keywords: code division multiple access (CDMA), multiple-access interference, gold codes, error floor.
1. INTRODUCTION
Traditionally in wireless communications, there are three basic multiple-access techniques: time-division access (TDMA), frequency-division multiple-access (FDMA) and code-division multiple-multiple-access (CDMA). The advent of CDMA dates back to the 1940s. It was developed originally for military applications as a means of establishing secure, jam-resistant communications. Over the years, CDMA technology has found its way into the larger society because of some other properties that makes it attractive for commercial and civil applications. It became a significant worldwide communication technique not only in wireless telephony, but also in global positioning systems. Viterbi [1] indicates that as at 2002, over one hundred million consumers use devices that employ CDMA technology to provide wireless personal communication or position-location or both. Statistics [2] also show that the number of CDMA subscribers grew from about 7.8 millions in 1997, to about 577 millions in 2010.
Recently, a relatively new technique called interleave division multiple access (IDMA) was proposed in literature [3-6] as an alternative to CDMA. The technique (IDMA) has been attracting much attention because it is commonly believed to be a promising candidate for future wireless technology. In IDMA, signal spreading and matrix multiplication are avoided, thereby minimising transmission bandwidth and computational requirements [6-9]. Because of these important benefits of IDMA, CDMA is sometimes considered as being outdated and irrelevant to future wireless systems. A careful consideration shows that this is not the case. This is briefly explained as follows.
CDMA has certain important characteristics which are absent in IDMA. For example, CDMA possesses jam-resistant properties not available in IDMA. Apart from this,CDMA has covert transmission capability not obtainable in IDMA. Furthermore, CDMA signals are
low-level signals, spread out over a wideband. This makes it possible for CDMA systems to co-exist over the same bandwidth alongside with other transmission technologies like the FDMA whose energy is concentrated over a narrowband. CDMA remains a major technology not only in wireless telephony, but also in global positioning systems
We are aware of the existence of certain transmission enhancement techniques like the orthogonal frequency division multiplexing (OFDM), orthogonal frequency division multiple access (OFDMA), multiple-input multiple-output (MIMO) technology, space-time coding, etc. However, these are not the focus of this paper.
Properties of spreading codes are important factors affecting the performance of CDMA systems. The type and properties of the codes set bounds on the capability of the system. Imperfect code properties are known to be a cause of multiple-access interference, which is a major limiting factor on the system performance. This fact applies not only to basicCDMA systems, but also other emerging technologies like the multi-carrier CDMA system and its space-time coded counterparts[10, 11].
The significance of spreading codes to the system performance has made them important research subject. Related themes in existing works include: analysis of properties of spreading sequences[12], study of multiple-access performance of spreading codes[10, 13-15], design and search for better spreading codes[13, 16-24].In this paper, we investigate correlation properties and the multiple-access performance of maximal linear sequences and Gold codes. For selected sets of codes, effects of multiple-access interference (MAI) on the system bit-error-rate (BER)in a multi-user environment, ranging from a few users to tens of users, are considered.
simulations carried out are presented and discussed in Sections 4and 5 respectively. The paper concludes with a summary in Section 6.
2. SYSTEM MODEL
Maximal linear code sequences, or m-sequences for short, represents a linear feedback shift registers (LFSR) sequence with its maximum possible period, which is 2n- 1, where n is the length of the shift register. M-sequences have excellent autocorrelation function. However, they have poor and non-deterministic cross-correlation properties with relatively large peaks between pairs of m-sequences, and these make them unsuitable for multiple-access applications.
Gold codes are a type of pseudo-noise (PN) sequences which are believed to have periodic cross-correlation properties that make them appropriate for multiple-access applications. They are derived from combination of certain pairs of m-sequences called preferred sequences. Magnitudes of Gold codes exhibit triple-valued cross-correlation function [25-27] with values {-1, -t(n), t(n)-2}, where
= { �+ /�+ / + , odd
+ , even.
At zero shift, autocorrelation function of the codes has the value N, where N = 2n– 1; at all other phase lags, the codes’ autocorrelation takes on one of the values predicted by its cross-correlation function.
Autocorrelation and cross-correlation of code sequences indicate the number of agreements minus the number of disagreements when the code or codes are compared chip by chip. Mathematically, periodic cross-correlation function for sequences xiand yi can be
represented as
, � = ∑ +
�−
=
.
Hence, autocorrelation function may be expressed as
, � = ∑ +
�−
=
.
Autocorrelation functions ofm-sequences are double-valued, with a peak at zero shift point only.
The PN-code ck(t) for a user k can be denoted as
1
( ) ( ) 1,1
N
i i
k k c c k
i
for
c t c P t iT c
, (4)where N is length of the code, and Pcis a rectangular pulse
with a duration Tc. If bk(t) is a binary data, spreading is
accomplished by multiplying ck(t) with bk(t), after which
the resulting signal is used to modulate a carrier, to give
( ) ( ) ( ) cos( )
k k k c k
s t Ac t b t t
, (5)
where ωc is carrier frequency. The multiplication of the
code ck(t) with the data bits bk(t) results in bandwidth
expansion. The bandwidth expansion or spreading factor Bc is given by = � /� = �, where Tb is the data bit
interval, and N is the length of the user’s code. It is assumed that Tb/Tc = N, so that one code sequence fits into
one data bit interval.
Let the wireless communication channel be represented by multiple paths having a real positive gain
l, propagation delay τl and phase shift l, where l is path
index. The channel impulse response hk(t) for a user k and
L independent paths can be modelled as
ℎ = ∑ � � � − � . 6 �
=
At the receiving end, the received signal rk(t) for
the user k is obtained by convolving sk(t) with hk(t) and
adding noise so that
= ∫−∞∞ � ℎ − � � + , (7)
where n(t) represents the channel noise. Substituting the expressions for sk(t) and hk(t) into this integral, and using
relevant properties of the Dirac delta δ(t) gives
= ∑ � �
�
=
− � − � � − � − � + .
(8)
For a multi-user system comprising K users, the received signal r(t) is a linear superposition of the signals for the users, and is given by
.(9)
Correlating the received signal with the code for a certain user de-spreads (decodes) the signal for the user.
3. METHODOLOGY
Different sets of m-sequences and Gold codes were generated, after which their correlation properties were tested, prior to their deployment in the design of a multi-user DS-CDMA communication system.
Software simulations were carried out on the system BER performance for transmission of random QPSK symbols in an additive white Gaussian noise (AWGN) channel having a mean of zero and a unit variance. Transmitted data were encoded using Gold codes in turn for code lengthN = 31, 127, 511 and 2048 chips. Independent data symbols were used for the users. For the simulations, perfect synchronization and perfect power control were assumed.
1 1
( ) kl ( ) ( ) cos( ) ( ) K L
j
lk k lk k lk c lk
k l
r t A e c t b t t n t
4. RESULTS
Results on the correlation properties of the m-sequences and the Gold codes shall now be presented.
A. Correlation of 31-chip m-sequences
Autocorrelation and cross-correlation of different sets of codes were tested. Figure-1shows auto-correlation plotsfor three different 31-chip m-sequences. Clearly, these plots show the periodicity of codes’ auto-correlation; also in line with properties of m-sequences, the autocorrelation plots double-valued, having a magnitude of N at zero shift and -1 for all other phase lags.
Figure-2 shows the results of cross-correlating one m-sequence with another. At first sight, these results appear to contradict expectation, making them to deserve a close look. This is explained as follows. Cross-correlation function of m-sequences is generally believed to be random-valued. In contrast, this happened not to be the case with Figure-2. Rather than being random-valued, the magnitudes of the cross-correlation plots look deterministic. The magnitudes of the plots are
triple-valued, corresponding to those predicted for Gold codes. This indicates that each pair of the m-sequences constitutes a preferred pair. (Preferred pairs have the same auto-correlation function with m-sequences, but the cross-correlation function of Gold codes.)
B. Results for 31-chip Gold codes
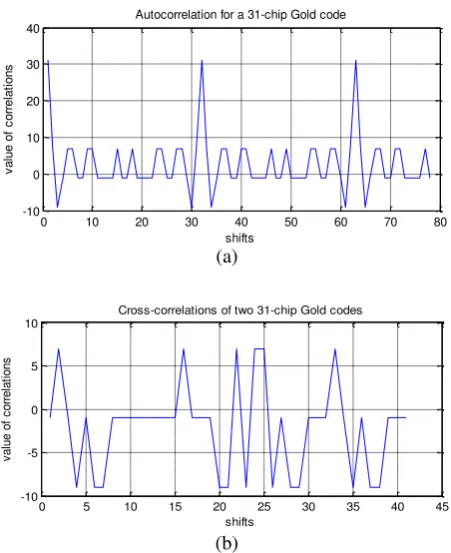
Using appropriate combination of a preferred pair of 31-chipm-sequences, a set of 33 Gold codes were generated. Figure-3(a) shows the autocorrelation of one of the Gold codes. It is obvious that this autocorrelation plot is quadruple-valued, in consistency with the theory of Gold codes. Figure-3(b) shows the cross-correlation plot for two of the Gold codes. Clearly, these plots are triple-valued, also in agreement with the theory.
It should be noted that the cross-correlation plot for the Gold codes, as shown by Figure-3b, is simply a sample. For the set of Gold codes being considered, there are 528 possible cross-correlation plots, all of which cannot be included here.
Figure-1. Autocorrelation of three 31-chip m-sequences. Figure-2. Pairwise cross-correlation of the three m-sequences.
0 10 20 30 40 50 60 70 80
-10 0 10 20 30 40
shifts
v
a
lu
e
o
f
c
o
rr
e
la
ti
o
n
s
autocorrelation for m-sequence 1
0 10 20 30 40 50 60 70 80
-10 0 10 20 30 40
shifts
v
a
lu
e
o
f
c
o
rr
e
la
ti
o
n
s
autocorrelation for m-sequence 2
0 10 20 30 40 50 60 70 80
-10 0 10 20 30 40
shifts
v
a
lu
e
o
f
c
o
rr
e
la
ti
o
n
s
autocorrelation for m-sequence 3
0 5 10 15 20 25 30 35 40 45
-10 -5 0 5 10
shifts
v
a
lu
e
o
f
c
o
rr
e
la
ti
o
n
s
Cross-correlations of m-sequences 1 and 2
0 5 10 15 20 25 30 35 40 45
-10 -5 0 5 10
shifts
v
a
lu
e
o
f
c
o
rr
e
la
ti
o
n
s
Cross-correlations of m-sequences 1 and 3
0 5 10 15 20 25 30 35 40 45
-10 -5 0 5 10
shifts
v
a
lu
e
o
f
c
o
rr
e
la
ti
o
n
s
(a)
(b)
Figure-3. (a) Autocorrelation plot for a 31-chip Gold code; (b) Cross-correlation plot for two Gold codes.
C. Results for 127-chip m-sequence
[image:4.595.55.281.95.372.2] [image:4.595.62.539.414.716.2]127-chip codes were also generated and tested. Figure-4 gives samples of results on the codes’ correlation, showing plots for 127-chip m-sequences. The plots on this Figure involve four different codes (numbered 1 to 4), each being 127-chip long, generated using seven-stage shift registers. The first four plots are autocorrelation plots, while the remaining are cross-correlation plots. A look at these plots show that the autocorrelation plots are double-valued, as it is expected of m-sequences. A close look at the cross-correlation plot between each pair of the m-sequence shows that all the plots are triple-valued, the values being those predicted by theory of Gold codes. This indicates that all the code pairs are preferred pairs. Hence, if appropriately combined, any pair of these codes would produce a set of 127-chip long Gold codes.
D. Results for 511-chip spreading codes
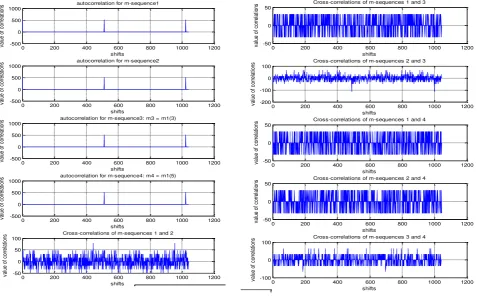
Similar simulations were carried out for 511-chip long codes. Figure-5 shows the results, involving four different codes (numbered 1 to 4), each being 511-chip long, generated using nine-stage shift registers. The first four graphs are autocorrelation plots, while the remaining are cross-correlation plots. A look at the figures shows that the magnitude of the autocorrelation plots are double-valued, which confirms that the codes are m-sequences.
.
Figure-4. Auto-correlation and cross-correlation plots for 127-chip m-sequences.
0 10 20 30 40 50 60 70 80 -10 0 10 20 30 40 shifts v a lu e o f c o rr e la ti o n s
Autocorrelation for a 31-chip Gold code
0 5 10 15 20 25 30 35 40 45
-10 -5 0 5 10 shifts v a lu e o f c o rr e la ti o n s
Cross-correlations of two 31-chip Gold codes
0 50 100 150 200 250 300 350
-100 0 100 200 shifts va lu e of c or re la tio
ns autocorrelation for m-sequence 1
0 50 100 150 200 250 300 350
-100 0 100 200 shifts va lu e of c or re la tio
ns autocorrelation for m-sequence 2
0 50 100 150 200 250 300 350
-100 0 100 200 shifts va lu e of c or re la tio
ns autocorrelation for m-sequence 3: m3 = m1(3)
0 50 100 150 200 250 300 350
-100 0 100 200 shifts va lu e of c or re la tio
ns autocorrelation for m-sequence 4: m4 = m1(5)
0 50 100 150 200 250 300 350
-20 0 20 shifts va lu e of c or re la tio
ns Cross-correlations of m-sequences 1 and 2
0 50 100 150 200 250 300 350
-20 0 20 shifts va lu e of c or re la tio
ns Cross-correlations of m-sequences 1 and 3
0 50 100 150 200 250 300 350
-20 0 20 shifts va lu e of c or re la tio
ns Cross-correlations of m-sequences 2 and 3
0 50 100 150 200 250 300 350
-20 0 20 shifts va lu e of c or re la tio
ns Cross-correlations of m-sequences 1 and 4
0 50 100 150 200 250 300 350
-20 0 20 shifts va lu e of c or re la tio
ns Cross-correlations of m-sequences 2 and 4
0 50 100 150 200 250 300 350
-20 0 20 shifts va lu e of c or re la tio
Figure-5. Autocorrelation and cross-correlation plots for 511-chip m-sequences.
The cross-correlation plot between m-sequence 1 and 3, as well as 1 and 4 are triple-valued, thus indicating that the pairs are preferred sequences. The cross-correlation plot between m-sequence pair 2 and 4 is also triple-valued, which indicate that they are preferred pairs with respect to one another. That is, m-sequence-4 is a preferred pair of both m-sequence 1 and 2. The cross-correlation plot between sequence 1 and sequence 2 is random-valued, which indicates that the two sequences are not preferred pairs. The same fact is applicable to pairs 2 and 3, as well as 3 and 4
E. Multiple-access performance of the codes
Using appropriate combinations of preferred pairs of m-sequences, different sets of Gold codes were generated. Following this, multiple-access performance of the codes in a DS-CDMA system was investigated. This section presents the results, starting with a single user.
E1. Bit-error-rate for a single user
After experimenting on the correlation properties of the spreading codes, multiple-access performance of different sets of codes was investigated. Figure-6 shows simulation results for a single user. The right-most curve on this figure is that of uncoded data transmission. The figure shows the close agreement between analytic and simulation results for the uncoded data transmission. For reference purposes, this curve will be retained on all results to be presented in this paper.
A close look at Figure-6 clearly shows that longer Gold codes give better error-rate performance. The figure
also shows that with reference to uncoded data transmission, at a BER of 10-4, the codes provide coding gain of about 15.6, 21.7, 27.8 and 33.9 dB when N = 31, 127, 511 and 2048 respectively. From this, we see that there is a constant 6.1-dB-step in coding gain between adjacent code lengths, which can be explained in terms of the ratio of the process gain of the codes.
E2. Bit-error-rate for five users
Next, we shall consider the results for five simultaneous users, as shown by Figure-7. Comparing this figure with the previous one show that increase in the number of interferers worsens the system BER. That is, MAI worsens with increasing system load. This is expected. The results show, for example, that for the code length N = 31 chips, at an SNR of -5 dB, BER is 1.1 x 10⁻³ for a single user (Figure-6) and 1.1 x 10⁻¹ for five users. The BERs for the other code lengths (N = 127, 511 and 2047) show a similar trend.
0 200 400 600 800 1000 1200
-500 0 500 1000 shifts va lu e of c or re la tio
ns autocorrelation for m-sequence1
0 200 400 600 800 1000 1200
-500 0 500 1000 shifts va lu e of c or re la tio
ns autocorrelation for m-sequence2
0 200 400 600 800 1000 1200
-500 0 500 1000 shifts va lu e of c or re la tio
ns autocorrelation for m-sequence3: m3 = m1(3)
0 200 400 600 800 1000 1200
-500 0 500 1000 shifts va lu e of c or re la tio
ns autocorrelation for m-sequence4: m4 = m1(5)
0 200 400 600 800 1000 1200
-50 0 50 100 shifts va lu e of c or re la tio
ns Cross-correlations of m-sequences 1 and 2
Correlation plots for 511-ch
0 200 400 600 800 1000 1200
-50 0 50 shifts va lu e of c or re la tio
ns Cross-correlations of m-sequences 1 and 3
0 200 400 600 800 1000 1200
-200 -100 0 100 shifts va lu e of c or re la tio
ns Cross-correlations of m-sequences 2 and 3
0 200 400 600 800 1000 1200
-50 0 50 shifts va lu e of c or re la tio
ns Cross-correlations of m-sequences 1 and 4
-sequences.
0 200 400 600 800 1000 1200
-50 0 50 shifts va lu e of c or re la tio
ns Cross-correlations of m-sequences 2 and 4
0 200 400 600 800 1000 1200
-100 0 100 shifts va lu e of c or re la tio
[image:5.595.62.540.101.397.2]Figure-6. Bit-error-rate for a single user.
Figure-7. Bit-error-rate for five users.
E3. Bit-error-rate for higher number of users
We shall now consider simulation results for higher number of users. Figures 8 and 9 show the results for 10 and 30 users respectively. As with the previous results, these figures show that as the number of users increase, the system BER becomes worse, resulting from increasing MAI. For the code length N = 31 chips, for example, the results show that at an SNR of 8 dB, BER is 3.13 x 10⁻⁴ for 10 users and 1.45 x 10⁻² for 30 users. Because of the MAI, obtaining the same BER for a system involving a higher number of simultaneous users requires higher SNR. For example for the 31-chip code, obtaining a BER of 10-4 requires an SNR of about -3.3 dB for a single user, 4.01dB for five users , 7.28dB for 10 users and 14.32 dB for 30 users.
5. DISCUSSION
Results that have just been presented confirm that as the number of users increases, the system BER becomes worse, which is expected. However, a closer look reveals that the results have some surprises. This is explained as
Figure-8. Bit-error-rate for 10 users.
Figure-9. Bit-error-rate for 30 users.
The results show that as the number of users increase, the system BER degrades at similar rates for all the different code lengths: in general, the BER curves for all the code lengths shift together, with all possessing similar slopes at high SNRs. In contrast to this, as the number of users increase, system BER is expected to degrade faster for shorter Gold codes. A reason for this is that shorter codes have higher peak cross-correlation coefficient, as could be seen in Table-1. Also, by the virtue of their length, shorter codes approach full-load condition earlier than longer codes.
Apart from this, for a given code length, BER is expected to increase rapidly as full-load is approached. For example, the BER for a 31-chip Gold code is expected to increase rapidly, to flatten out and to exhibit an error floor as the number of users approaches 31.In connection with this, the slopes of the BER curves for different code lengths are expected to become increasingly different when the number of users increases. In contrast, the results give no indication of this: even under full load, the 31-chip Gold code does not show any error floor.
-30 -20 -10 0 10 20 30 40 10-4
10-3 10-2 10-1 100
SNR (dB)
BER
CDMA in AWGN channel for 1 users
uncoded (analytic) uncoded (simulation) N = 31
N = 127 N = 511 N = 2047
-30 -20 -10 0 10 20 30 40 10-4
10-3 10-2 10-1 100
SNR (dB)
BER
CDMA in AWGN channel for 5 users
uncoded (analytic) uncoded (simulation) N = 31
N = 127 N = 511 N = 2047
-30 -20 -10 0 10 20 30 40
10-4 10-3 10-2 10-1 100
SNR (dB)
BER
CDMA in AWGN channel for 10 users
uncoded (analytic) uncoded (simulation) N = 31
N = 127 N = 511 N = 2047
-30 -20 -10 0 10 20 30 40 10-4
10-3 10-2 10-1 100
SNR (dB)
BER
CDMA in AWGN channel for 30 users
uncoded (analytic) uncoded (simulation) N = 31
adjacent code lengths are expected to become increasingly unequal, as opposed to a single-user case, where the coding gain is a constant. In contrast to this, the simulation results show no significant difference in coding gain between BERs of adjacent code lengths. The set of curves appear to maintain similar slopes at high SNR, with no visible difference in their coding gain.
The Gold codes perform surprisingly better than expected. One might think that the surprising results could be due to erroneous spreading codes. However, this possibility is ruled out, based on the fact that the spreading codes were tested, and found to be well-behaved, prior to their being used in the communication system. One might also think that the surprising performance could be due to programming errors. This also is not the case, explained as follows.
At first sight, the absence of error floor and system saturation, even when the system was heavily loaded might raise a question on the validity of the results. Concerning this, further investigation reveals that the outstanding performance reported here is peculiar to the sets of Gold codes considered in this paper. Additional results show that some other sets of Gold codes lack such excellent performance. Figure-10 shows examples of these. Looking at this figure, it is clear that the BER performance of these codes has error floor when the system was significantly loaded. These results indicate the need for careful choice of spreading codes when designing a CDMA-based system.
Table-1. Peak cross-correlation of Gold codes*.
n N t(n) t(n)/φ(0)
3 7 5 0.7143
4 15 9 0.6000
5 31 9 0.2903
6 63 17 0.2698
7 127 17 0.1339
8 255 33 0.1294
9 511 33 0.0646
10 1023 65 0.0635
11 2047 65 0.0318
12 4095 129 0.0315
*In the last column, peak cross-correlation function, t(n), for Goldcode
sequence is normalised by peak autocorrelation function φ(0).
(a)
(b)
Figure-10. Samples of results showing inferior performance of some other sets of Gold codes for (a) 10 users and (b) 30 users. These codes exhibited error floor and system saturation when the system was significantly
loaded.
CONCLUSION
This work presented results of investigation carried out on the correlation properties of m-sequences and Gold codes, as well as multiple-access performance of the codes. The bit-error-rate of the Gold codes considered in this paper exhibited no visible error floor or system saturation even when the system was heavily loaded. The outcome of this work showed that in a multi-user environment, certain sets of Gold codes perform significantly better than others, making them ideal for multiple-access applications.
-30 -20 -10 0 10 20 30 40
10-4 10-3 10-2 10-1 100
SNR (dB)
BER
CDMA in AWGN channel for 10 users
uncoded (analytic) uncoded (simulation) N = 63
N = 255 N = 1023 N = 4095
-30 -20 -10 0 10 20 30 40
10-4 10-3 10-2 10-1 100
SNR (dB)
BER
CDMA in AWGN channel for 30 users
uncoded (analytic) uncoded (simulation) N = 63
REFERENCES
[1] A. J. Viterbi. 2002. Spread spectrum communications: myths and realities. IEEE Commun Mag. 40: 34-41.
[2] The CDMA Development Group. 2016, 27 Jan.
CDMA History. Available:
https://www.cdg.org/resources/cdma_history.asp.
[3] W. K. Leung, L. Lihai and P. Li. 2003. Interleaving-based multiple access and iterative chip-by-chip multiuser detection. IEICE T Commun. 86: 3634-3637.
[4] L. Ping. 2005. Interleave-division multiple access and chip-by-chip iterative multi-user detection. IEEE Commun Mag. 43: S19-S23.
[5] P. A. Hoeher and H. Schoeneich. 2006. Interleave-division multiple access from a multiuser theory point of view. in 4th International Symposium on Turbo Codes and Related Topics; 6th International ITG-Conference on Source and Channel Coding (TURBO-CODING), Munich, Germany. pp. 1-5.
[6] P. Li, L. Lihai, W. Keying and W. K. Leung. 2006. Interleave division multiple-access. IEEE T Wirel Commun. 5: 938-947.
[7] R. Gupta, B. Kanaujia, R. Chauhan and M. Shukla. 2010. Prime number based interleaver for multiuser iterative IDMA systems. in International Conference on Computational Intelligence and Communication Networks (CICN), Bhopal, India. pp. 603-607.
[8] K. Kusume, G. Bauch, and W. Utschick. 2012. IDMA vs. CDMA: Analysis and Comparison of Two Multiple Access Schemes. IEEE T Wirel Commun. 11: 78-87.
[9] P. Li, G. Qinghua and T. Jun. 2007. The OFDM-IDMA approach to wireless communication systems. IEEE Wirel Commun. 14: 18-24.
[10]H. H. Chen and Y. C. Yeh. 2005. Capacity of space-time block-coded CDMA systems: comparison of unitary and complementary codes. IEE Proceedings – Communications. 152: 203-214.
[11]W. M. Jang, L. Nguyen and P. Bidarkar. 2005. Multiple access and inter-carrier interference in OFDM-CDMA with random sequences. Journal of Communications and Networks. 7: 21-28.
[12]D. Kedia, M. Duhan and S. Maskara. 2010. Evaluation of correlation properties of orthogonal spreading codes for CDMA wireless mobile communication. in 2010 IEEE 2nd International Advance Computing Conference (IACC). pp. 325-330.
[13]A. Aye, N. Boon Poh and S. Rahardja. 2007. Performance of SCHT Sequences in Asynchronous CDMA System. IEEE Communications Letters. 11: 641-643.
[14]H. Ganapathy, D. A. Pados, and G. N. Karystinos. 2011. New Bounds and Optimal Binary Signature Sets - Part II: Aperiodic Total Squared Correlation. IEEE Transactions on Communications. 59: 1411-1420.
[15]H. Ganapathy, D. A. Pados and G. N. Karystinos. 2011. New Bounds and Optimal Binary Signature Sets - Part I: Periodic Total Squared Correlation. IEEE Transactions on Communications. 59: 1123-1132.
[16]C. Kwonhue and L. Huaping. 2010. Quasi-Synchronous CDMA Using Properly Scrambled Walsh Codes as User-Spreading Sequences. IEEE Transactions on Vehicular Technology. 59: 3609-3617.
[17]H. Su, L. Zilong, G. Yong Liang, X. Wenhui, B. Guoan, and L. Shaoqian. 2014. Sequence Design for Cognitive CDMA Communications under Arbitrary Spectrum Hole Constraint. IEEE Journal on Selected Areas in Communications. 32: 1974-1986.
[18]C. Kwonhue and L. Huaping. 2012. Polyphase Scrambled Walsh Codes for Zero-Correlation Zone Extension in QS-CDMA. IEEE Communications Letters. 16: 429-431.
[19]T. Yifeng, F. Pingzhi, H. Li, and T. Xiaohu. 2010. A Simple Method for Generating Optimal Periodic Complementary Sequence Set Based on Phase Shift. IEEE Signal Processing Letters. 17: 891-893.
[20]A. N. Akansu and R. Poluri. 2007. Walsh-Like Nonlinear Phase Orthogonal Codes for Direct Sequence CDMA Communications. IEEE Transactions on Signal Processing. 55: 3800-3806.
Communications. IEEE Signal Processing Letters. 14: 900-903.
[22]K. Young-Sik, J. Ji-Woong, N. Jong-Seon and C. Habong. 2006. New Design of Low-Correlation Zone Sequence Sets. IEEE Transactions on Information Theory. 52: 4607-4616.
[23]B. Natarajan, S. Das and D. Stevens. 2005. An evolutionary approach to designing complex spreading codes for DS-CDMA. IEEE Transactions on Wireless Communications. 4: 2051-2056.
[24]V. V. Barinov, V. S. Kuznetsov and M. V. Lebedev. 2005. Spreading ensembles with improved correlation properties for multiple access. in Personal, Indoor and
Mobile Radio Communications, 2005. PIMRC 2005. IEEE 16th International Symposium on. 2: 1081-1085.
[25]R. Gold. 1966. Characteristic Linear Sequences and Their Coset Functions. SIAM Journal on Applied Mathematics. 14: 980-985.
[26]R. Gold. 19967. Optimal binary sequences for spread spectrum multiplexing (Corresp.). Information Theory, IEEE Transactions on. 13: 619-621.