R E S E A R C H
Open Access
Characteristics of men responding to an
invitation to undergo testing for prostate
cancer as part of a randomised trial
Eleanor I. Walsh
1*, Emma L. Turner
1, J. Athene Lane
1, Jenny L. Donovan
1, David E. Neal
2, Freddie C. Hamdy
2,
Richard M. Martin
1, and the CAP & ProtecT Trial Groups
Abstract
Background:Sociodemographic characteristics are associated with participating in cancer screening and trials. We compared the characteristics of those responding with those not responding to a single invitation for prostate-specific antigen (PSA) testing for prostate cancer as part of the Cluster randomised triAl of PSA testing for Prostate cancer (CAP).
Methods:Age, rurality and deprivation among 197,763 men from 271 cluster-randomised primary care centres in the UK were compared between those responding (n= 90,300) and those not responding (n= 100,953) to a prostate cancer testing invitation.
Results:There was little difference in age between responders and nonresponders. Responders were slightly more likely to come from urban rather than rural areas and were slightly less deprived than those who did not respond.
Conclusion:These data indicate similarities in age and only minor differences in deprivation and urban location between responders and nonresponders. These differences were smaller, but in the same direction as those observed in other screening trials.
Trial registration:ISRCTN92187251. Registered on 29 November 2004.
Keywords:Prostate cancer, Screening, Randomised controlled trial, PSA testing, Prostate specific antigen testing
Background
Screening for prostate cancer (PCa) has been shown to reduce disease-specific morbidity and mortality through early detection, but at the expense of overdiagnosis and overtreatment of indolent cancer [1–3]. The UK National Screening Committee (UKNSC) does not currently rec-ommend population screening for PCa, although testing can be performed on request [4]. The UKNSC awaits the results of ongoing nationwide trials to further inform UK PCa screening policy. The Cluster randomised triAl of PSA testing for Prostate cancer (CAP) is an effectiveness trial comparing PCa-specific mortality in men invited (intervention arm) and men not invited (control arm) to prostate-specific antigen (PSA) testing in primary care [5]
and the Prostate testing for cancer and treatment (ProtecT) randomised controlled trial (RCT), which evaluates the effectiveness and cost-effectiveness of treatment for localised, PSA-detected PCa [6].
Material and social deprivation is associated with lower rates of attending cancer screening programmes for both men [7–9] and women [10–14], as well as RCT participation [15]. Failure to enroll participants who are representative of the target population can compromise the generalisability of trial findings [16], for example, due to a healthy volunteer effect (HVE) [17] with youn-ger, healthier, more-educated individuals taking part compared with nonattendees [18]. Here we compare the characteristics of those who responded to the invitation to take part in the intervention arm of the CAP trial with those who did not, using routine data available from primary care centres.
* Correspondence:[email protected]
1School of Social and Community Medicine, University of Bristol, Canynge
Hall, 39 Whatley Road, Bristol BS8 2PS, UK
Full list of author information is available at the end of the article
Methods
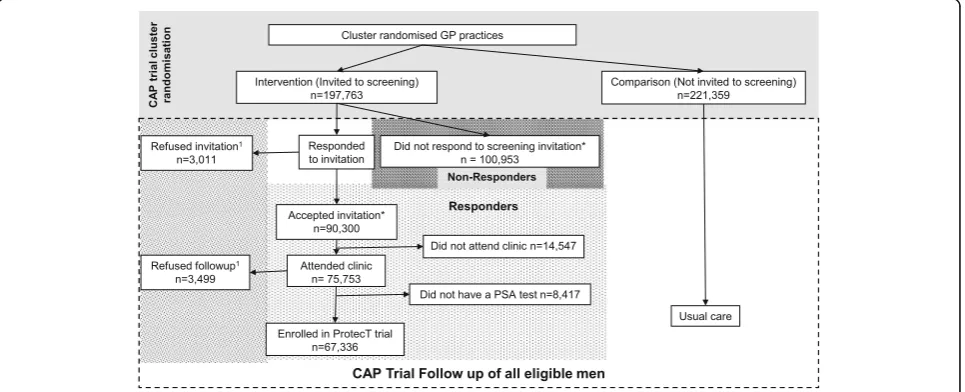
Men aged 50–69 years from 271 primary care (GP) prac-tices in England and Wales were cluster-randomised to receive the intervention in the CAP trial (Fig. 1) of a postal invitation to attend a one-off appointment for a PSA test screening for PCa. Those who returned a reply slip by post accepting this invitation (i.e. ‘responders’) were given an appointment and invited to participate in the screening and diagnostic stage of the ProtecT trial [6]. Responders who were ineligible or decided not to participate in the ProtecT study were followed up as part of the CAP trial (discussed in full elsewhere; [5]). Those who declined the initial invitation (i.e ‘nonresponders’) were also followed up as part of the CAP trial [5].
Data
Date of birth and postcode were provided by the pri-mary care practices for all men who were invited to screening for recruitment purposes. These are the only demographic data items available for both responders and nonresponders due to governance and ethical per-missions. Postcode was used to calculate the Index Multiple Deprivation (IMD) score and the Rural and Urban Area Classification (RUAC).
Index Multiple Deprivation (IMD)
The IMD is a widely used measure of area deprivation in England and Wales and has been shown to represent deprivation appropriately for both urban and rural areas [19]. The IMD is an overall composite score of weighted domains with higher scores indicating more deprivation encompassing aspects of socioeconomic status including unemployment, claiming financial support from the state, poor health, low educational attainment, criminal victimisation, household condition and overcrowding.
English 2004 and Welsh 2005 IMD scores are not directly comparable and are, therefore, analysed separately [20].
Rural and Urban Area Classification (RUAC)
The RUAC (2004) is a measure of population density and sparseness in the UK. For RUAC, areas of more than 10,000 people are considered to be urban, otherwise they are classified as rural (i.e. less than 10,000 people).
Statistical analysis
A ttest was used to compare mean age and deprivation in responders and nonresponders. Odds ratios (ORs) were used to compare the proportion of responders and nonresponders living in an urban location. Gartner et al. [19] found that deprivation accounted for the differences they found in outcomes by urban-rural location, and we therefore adjusted this analysis by IMD score. Analyses were conducted in STATA version 13.
Results
Of 197,763 men registered at primary care practices who were randomised to receive invitations to the PSA testing clinic, 46 % (n= 90,300) accepted the invitation (responders) and 51 % did not respond (n= 100,953; i.e. nonresponders). The remaining men either explicitly refused the invitation (1.5 %; n= 3,010) or, having attended, refused to take part in the trial (1.8 %;n= 3,499). Eighty-four percent (n= 75,753) of responders ultimately attended the clinic, of which 98 % (n= 65,836) reported themselves as being of White ethnic origin.
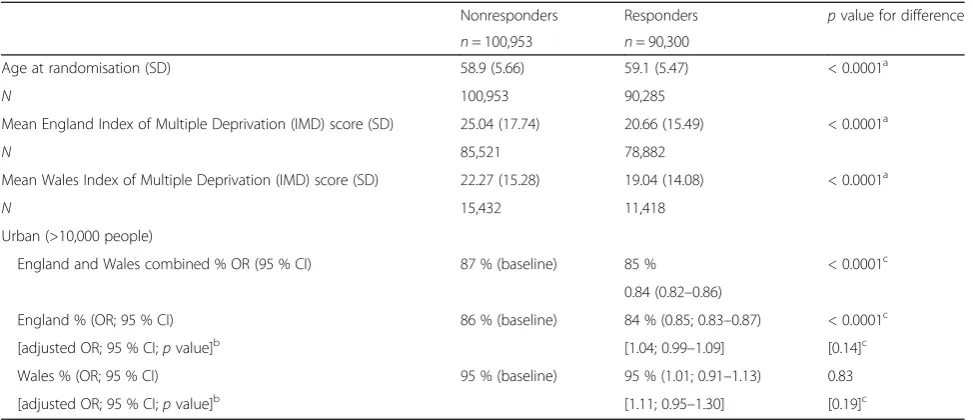
The mean age of both responders and nonresponders was 59 years (5.47 and 5.66 standard deviations (SDs), respectively; see Table 1). Responders in England and Wales were less deprived on average compared to non-responders (IMD 20.66 (SD 15.49) versus 25.04 (SD
[image:2.595.58.541.519.715.2]17.74);p< 0.001 and 19.04 (SD 14.08) versus 22.27 (SD 15.28); p< 0.001, respectively). The distribution of IMD scores between responders and nonresponders are com-parable (see Fig. 2a and b), as demonstrated by the inter-quartile range (IQR) of both IMD scores in England (responders’ IQR 9.3–28.5 versus nonresponders’ IQR 10.9–37.2) and Wales (responders’ IQR 8.2–26.9 versus nonresponders’IQR 10.3–31.8).
Responders were also slightly less likely to live in urban areas with a population of more than 10,000 than nonresponders (85 % [95 % confidence interval (CI) 0.85 to 0.86] versus 87 % [95 % CI 0.87 to 0.87]; p< 0.001), and slightly more likely to be from urban locations when controlling for deprivation, in both England (crude OR 0.85, 95 % CI 0.83 to 0.87 compared with adjusted OR 1.04, 95 % CI 0.99 to 1.09) and Wales (crude OR 1.01, 95 % CI 0.91 to 1.13 compared with adjusted OR 1.11, 95 % CI 0.95 to 1.30).
There was no difference in the results when classifying those who accepted the invitation, but did not ultimately attend the clinic or undergo a PSA test (n= 22,964), as nonresponders rather than responders.
Discussion
[image:3.595.56.543.98.308.2]There were very small differences between those who responded and those who did not respond to a single in-vitation to receive a PSA test as the intervention in the CAP trial. Responders and nonresponders were similar in age. Responders were only slightly less deprived than the nonresponders, and there were negligible differences in urban-rural location. Although we report small p values, these reflect the large numbers in the study as the absolute differences are very small in magnitude.
Table 1Demographics of responders and nonresponders to screening invitation
Nonresponders Responders pvalue for difference n= 100,953 n= 90,300
Age at randomisation (SD) 58.9 (5.66) 59.1 (5.47) < 0.0001a
N 100,953 90,285
Mean England Index of Multiple Deprivation (IMD) score (SD) 25.04 (17.74) 20.66 (15.49) < 0.0001a
N 85,521 78,882
Mean Wales Index of Multiple Deprivation (IMD) score (SD) 22.27 (15.28) 19.04 (14.08) < 0.0001a
N 15,432 11,418
Urban (>10,000 people)
England and Wales combined % OR (95 % CI) 87 % (baseline) 85 % < 0.0001c
0.84 (0.82–0.86)
England % (OR; 95 % CI) 86 % (baseline) 84 % (0.85; 0.83–0.87) < 0.0001c
[adjusted OR; 95 % CI;pvalue]b [1.04; 0.99–1.09] [0.14]c
Wales % (OR; 95 % CI) 95 % (baseline) 95 % (1.01; 0.91–1.13) 0.83
[adjusted OR; 95 % CI;pvalue]b [1.11; 0.95–1.30] [0.19]c
a
ttest,b
English and Welsh IMD scores are adjusted for separately because they are derived differently and should not be combined,c
Logistic regression
CIconfidence interval,ORodds ratio
0
.01
.02
.03
.04
Density
0 5 10 15 20 25 30 35 40 45 50 55 60 65 70 75 80
Welsh IMD score
Responders to invite (n=11,418) Non responders to invite (n=15,479)
0
.01
.02
.03
.04
Density
0 5 10 15 20 25 30 35 40 45 50 55 60 65 70 75 80 85
English IMD score
Responders to invite (n=78,886) Non responders to invite (n=85,644)
a
b
Fig. 2aFrequency distribution of Welsh Index Multiple Deprivation
[image:3.595.305.539.373.663.2]The CAP trial gained consent after randomisation to receive or not receive an invitation to screening and, by analysing on this intention-to-screen basis, reduces the risk of self-selection bias influencing the representative-ness to the target population. This is compared to other trials where consent was gained prior to randomisation [21]. However, differences between men who did and did not actually undergo a PSA test is a key issue for policy-makers and cannot be ruled out as having an im-pact on the effectiveness of screening.
It was only possible to derive age, urban/rural location and an ecological measure of deprivation from the avail-able data because of ethical and governance regulations. The large randomly allocated cohort and intention-to-screen analysis in the CAP trial helps to mitigate the effect of unmeasured factors on generalisability of the trial. While the responders and nonresponders were similar ac-cording to the characteristics measured, it cannot be ruled out that there were other differences between the groups. Important differences in comorbidities, education, income and decision-making between attendees and nonattendees have been shown elsewhere [32, 33] and remain key factors for policy-makers.
We are unable to comment on the impact of any post-randomisation differences between the groups on mor-tality and PCa incidence. Previous trials have suggested that nonparticipation in the screening arm is associated with higher mortality [22] and that controlling for ‘healthier’attenders in the screening arm is important to avoid overestimating the effect of screening on mortality [18]. This is something that could be investigated in the future once the median 10-year intention-to-screen ana-lyses have been reported.
This RCT invited over 190,000 patients to attend a one-off blood test from different geographical regions across the UK. According to these characteristics, those who responded to the invitation were representative of the population who were invited as a whole and compar-able with those enrolled in other screening trials [23, 24]. Compared to other PCa screening trials, considerably more men were invited in this trial and overall response rates were studied [6]. Other trials have not consistently reported the numbers initially invited (cf. [25–31]) or have reported on a sample of participant uptake of invitations to testing prior to publication of the primary analysis [21].
Group-level data (i.e. postcode) limits the sensitivity of deprivation data at an individual level, and area measures of deprivation are an average of the overall deprivation of the population, which arguably cannot represent the level of deprivation in the age- and gender-specific group in-cluded in this trial [34]. Further, without ethnicity infor-mation for all those invited we cannot investigate the lack of ethnic diversity among attenders (more than 90 % of whom are of White ethnicity). Although, this figure does
reflect the 2001 UK Census, which reported that 89 % and 97 % of English and Welsh residents, respectively, from urban areas were classified as of ‘White’ethnicity [35].
Despite changes in the most recent Consolidated Stan-dards of Reporting Trials (CONSORT) guidelines, there are very few trials that report the figures required to assess the impact of trial participation on health outcomes and survival [36]. It is difficult to assess who is likely to attend screening if trials do not publish prerecruitment figures and the details of those who are being enrolled remain under-reported [37, 38]. Without adequate reporting of the groups who do and do not participate potential external validity and barriers to screening and treatment cannot be properly assessed. Describing the characteristics of those enrolled and those not enrolled in trials, to ascertain the generalisability of the trial results and to assess the validity of the recruited sample, has been recommended [39].
Conclusions
We have reported key characteristics that describe those who did and those who did not respond to a single invi-tation to undergo a PSA test in the ProtecT and CAP RCTs. Overall, there were only minor differences in area-deprivation measures and urban-rural location be-tween those who responded and did not respond to the invitation. Therefore, this is unlikely to affect the general-isability of the ProtecT and CAP trials. Despite restricted access to routine data limiting the comparisons that could be made between responders and nonresponders, this ana-lysis suggests that those who are likely to engage with screening do not differ from those who would not in a meaningful way. Moreover, the characteristics of those who responded are comparable to those observed in other screening trials and add to knowledge about who might accept an invitation to PCa screening, if a programme were to be initiated in England and Wales.
Abbreviations
CAG:Confidentiality Advisory Group; CAP: Cluster randomised triAl of PSA testing for Prostate cancer; CI: Confidence interval; GP: General practitioner; HVE: Healthy Volunteer Effect; IMD: Index Multiple Deprivation; IQR: Interquartile range; MREC: Multicentre Research Ethics Committee; OR: Odds ratio; PCa: Prostate cancer; PIAG: Patient Information Advisory Group; ProtecT: Prostate testing for cancer and treatment; PSA: Prostate-specific antigen; RCTs: Randomised controlled trials; RUAC: Rural and Urban Area Classification; SD: Standard deviation; UKNSC: UK National Screening Committee
Acknowledgements
Bonnington, Malcolm Mason, Jon Oxley, Richard Martin, Jenny Donovan, David Neal, Freddie Hamdy, Emma Turner and Athene Lane. Data Monitoring Committee: Lars Holmberg (chair), Robert Pickard, Simon Thompson and Usha Menon. Cause of Death Committee: Peter Albertsen (chair), Colette Reid, Jon McFarlane, Jon Oxley, Mary Robinson, Jan Adolfsson, Michael Baum, Anthony Zeitman, Amit Bahl and Anthony Koupparis. Administrative staff: Marta Tazewell and Genevieve Hatton-Brown.
We acknowledge the tremendous contribution of all the ProtecT study participants, investigators, researchers and the Steering and Data Monitoring Committees. The views and opinions expressed therein are those of the authors and do not necessarily reflect those of the Department of Health.
Funding
The CAP trial is funded by Cancer Research UK and the UK Department of Health (C11043/A4286, C18281/A8145, C18281/A11326 and C18281/A15064). The ProtecT study is funded by the UK National Institute for Health Research (NIHR) Health Technology Assessment Programme (96/20/06, 96/20/99).
Availability of supporting data
The dataset supporting the conclusions of this article cannot be shared with third parties due to conditions within the Section 251 approval that governs this research.
Authors’contributions
JAL, JD, FCH, DN and RMM were involved in the trial design and concept. EW and ET were involved in the date collection, preparation and statistical analysis. EW, ET and RMM were responsible for interpreting the data and drafting the manuscript. All authors critically revised the manuscript and approved the final version.
Competing interests
The authors declare that they have no competing interests.
Consent for publication
Not applicable.
Ethical approval and consent to participate
Ethical approval to access information about all those in the CAP study was obtained from UK Trent Multicentre Research Ethics Committee (MREC/03/4/093). The CAP study was exempt from gaining individual consent to participant having obtained Section 251 approval from the UK Patient Information Advisory Group (PIAG) (now the Confidentiality Advisory Group, CAG), under Section 251 of the NHS Act 2006 (PIAG 4-09 (k)/2003). The CAP study is sponsored by the University of Bristol and is registered at Current Controlled Trials (ISRCTN92187251). Individual consent to participate was gained from those enrolled in the ProtecT trial. Trent MREC in the UK also provided ethical approval for the ProtecT trial (01/4/025) with the University of Oxford as trial sponsor. The ProtecT trial is registered at Current Controlled Trials (ISRCTN20141297) and at ClinicalTrials.gov (NCT00632983).
Author details 1
School of Social and Community Medicine, University of Bristol, Canynge Hall, 39 Whatley Road, Bristol BS8 2PS, UK.2Nuffield Department of Surgical
Sciences, John Radcliffe Hospital, Oxford OX3 9DU, UK.
Received: 11 May 2016 Accepted: 24 September 2016
References
1. Andriole GL, et al. Prostate cancer screening in the randomized Prostate, Lung, Colorectal, and Ovarian Cancer Screening Trial: mortality results after 13 years of follow-up. J Natl Cancer Inst. 2012;104(2):125–32.
2. Buzzoni C, et al. Metastatic prostate cancer incidence and prostate-specific antigen testing: new insights from the European Randomized Study of Screening for Prostate Cancer. Eur Urol. 2015;68(5):885–90.
3. Schröder FH, et al. Screening for prostate cancer decreases the risk of developing metastatic disease: findings from the European Randomized Study of Screening for Prostate Cancer (ERSPC). Eur Urol. 2012;62(5):745–52. 4. UKNSC. Screening for Prostate Cancer Review 2014 Update: review against
programme appraisal criteria for the UK National Screening Committee
(UKNSC). 2015. Available from: http://legacy.screening.nhs.uk/prostatecancer. Accessed 12 Oct 2016.
5. Turner EL, et al. Design and preliminary recruitment results of the Cluster randomised triAl of PSA testing for Prostate cancer (CAP). Br J Cancer. 2014;110(12):2829–36.
6. Lane JA, et al. Active monitoring, radical prostatectomy, or radiotherapy for localised prostate cancer: study design and diagnostic and baseline results of the ProtecT randomised phase 3 trial. Lancet Oncol. 2014;15(10):1109–18. 7. Morgan RM, et al. Socioeconomic variation and prostate specific antigen
testing in the community: a United Kingdom based population study. J Urol. 2013;190(4):1207–12.
8. Moss SM, et al. Performance measures in three rounds of the English bowel cancer screening pilot. Gut. 2012;61(1):101–7.
9. Williams N, et al. Prostate-specific antigen testing rates remain low in UK general practice: a cross-sectional study in six English cities. BJU Int. 2011;108(9):1402–8. 10. Banks E, et al. Comparison of various characteristics of women who do and
do not attend for breast cancer screening. Breast Cancer Res. 2002;4(1):R1. 11. Hansen BT, et al. Factors associated with non-attendance, opportunistic
attendance and reminded attendance to cervical screening in an organized screening program: a cross-sectional study of 12,058 Norwegian women. BMC Public Health. 2011;11:264.
12. Johns LE, Moss SM, Trial Management Group. Randomized controlled trial of mammographic screening from age 40 (‘Age’trial): patterns of screening attendance. J Med Screen. 2010;17(1):37–43.
13. Moser K, Patnick J, Beral V. Inequalities in reported use of breast and cervical screening in Great Britain: analysis of cross sectional survey data. BMJ. 2009;338:b2025.
14. Ouedraogo S, et al. European transnational ecological deprivation index and participation in population-based breast cancer screening programmes in France. Prev Med. 2014;63:103–8.
15. Ford JG, et al. Barriers to recruiting underrepresented populations to cancer clinical trials: a systematic review. Cancer. 2008;112(2):228–42.
16. Sheikh A. Why are ethnic minorities under-represented in US research studies? PLoS Med. 2005;3(2):e49.
17. Burnell M, et al. Impact on mortality and cancer incidence rates of using random invitation from population registers for recruitment to trials. Trials. 2011;12(1):1–10.
18. Kranse R, et al. Excess all-cause mortality in the evaluation of a screening trial to account for selective participation. J Med Screen. 2013;20(1):39–45. 19. Gartner A, et al. Rural/urban mortality differences in England and Wales and
the effect of deprivation adjustment. Soc Sci Med. 2011;72(10):1685–94. 20. ONS. Similarities and differences between the Indices of Deprivation across
the UK. 2016. Available from: http://www.neighbourhood.statistics.gov.uk/ dissemination/Info.do?m=0&s=1472057104682&enc=1&page=
analysisandguidance/analysisarticles/indices-of-deprivation.htm&nsjs=true&nsck= false&nssvg=false&nswid=1920. Accessed 12 Oct 2016.
21. Otto SJ, Schröder FH, de Koning HJ. Low all-cause mortality in the volunteer-based Rotterdam section of the European randomised study of screening for prostate cancer: self-selection bias? J Med Screen. 2004;11(2):89–92. 22. Kilpelainen TP, et al. The Finnish prostate cancer screening trial: analyses on
the screening failures. Int J Cancer. 2015;136(10):2437–43.
23. Andriole GL, et al. Mortality results from a randomized prostate-cancer screening trial. N Engl J Med. 2009;360(13):1310–9.
24. Green BB, et al. Nonparticipation in a population-based trial to increase colorectal cancer screening. Am J Prev Med. 2012;42(4):390–7.
25. Berenguer A, et al. The Spanish contribution to the European Randomized Study of Screening for Prostate Cancer. BJU Int. 2003;92:33–8.
26. Ciatto S, et al. Specific features of the Italian section of the ERSPC. BJU Int. 2003;92:30–2.
27. Finne P, et al. The Finnish trial of prostate cancer screening: where are we now? BJU Int. 2003;92:22–6.
28. Hugosson J, et al. Population-based screening for prostate cancer by measuring free and total serum prostate-specific antigen in Sweden. BJU Int. 2003;92:39–43.
29. Kwiatkowski M, et al. Features and preliminary results of prostate cancer screening in Canton Aargau, Switzerland. BJU Int. 2003;92:44–7. 30. Nelen V, et al. ERSPC: features and preliminary results from the Antwerp
study centre. BJU Int. 2003;92:17–21.
32. Nijs HG, et al. Randomised trial of prostate cancer screening in The Netherlands: assessment of acceptance and motives for attendance. J Med Screen. 1997;4(2):102–6.
33. Nijs HG, et al. Why do men refuse or attend population-based screening for prostate cancer? J Public Health Med. 2000;22(3):312–6.
34. Zarrouk M, et al. The importance of socioeconomic factors for compliance and outcome at screening for abdominal aortic aneurysm in 65-year-old men. J Vasc Surg. 2013;58(1):50–5.
35. ONS. Census 2001. 2014. Available from: http://www.ons.gov.uk/ons/guide-method/census/census-2001/index.html. Accessed 12 Oct 2016. 36. Vist GE, et al. Systematic review To determine whether participation in a
trial influences outcome. BMJ: Br Med J. 2005;330(7501):1175–9.
37. Kane RL, Wang J, Garrard J. Reporting in randomized clinical trials improved after adoption of the CONSORT statement. J Clin Epidemiol. 2007;60(3):241–9. 38. Mills EJ, et al. The quality of randomized trial reporting in leading
medical journals since the revised CONSORT statement. Contemp Clin Trials. 2005;26(4):480–7.
39. Wright JR, et al. The importance of reporting patient recruitment details in phase III trials. J Clin Oncol. 2006;24(6):843–5.
• We accept pre-submission inquiries
• Our selector tool helps you to find the most relevant journal
• We provide round the clock customer support
• Convenient online submission
• Thorough peer review
• Inclusion in PubMed and all major indexing services
• Maximum visibility for your research
Submit your manuscript at www.biomedcentral.com/submit