IRREGULARITY DETECTION IN ARTIFICIAL SIGNAL USING
TIME-FREQUENCY ANALYSIS
A. Malik Hamat
1, M. Fairusham Ghazali
2, Makeen Amin
2and Fatihah Adnan
21Faculty of Mechanical Engineering, Universiti Teknikal Malaysia Melaka, Hang Tuah Jaya, Durian Tunggal, Melaka, Malaysia 2Faculty of Mechanical Engineering, Universiti Malaysia Pahang, Pekan, Pahang, Malaysia
E-Mail: [email protected]
ABSTRACT
A typical time signal contain overwhelming amounts of data and some of the signal components represent for irregularity such as crack and leak which greatly important to be identified precisely instead of using traditional method. The strategy can be done using signal processing method through high-quality time-frequency representation (TFR) for analysing such time dependent signals to accurately discover these superposition signal components. A few popular TFR methods such as wavelet transform analysis and relatively new, synchrosqueezed wavelet transform were applied in current study using artificial signal. From the result, both methods successfully discover an irregularity in the signal with different degree of accuracy and it is shown that synchrosqueezed wavelet transform provide the best and detailed time-frequency representation.
Keywords: irregularity, time-frequency analysis, synchrosqueezed wavelet transform.
INTRODUCTION
For frameworks of enthusiasm to researchers and engineers, examining the changing properties of a framework is normally performed by investigating signal information from the framework, instead of direct investigation of every part. Propelled time-frequency analysis give an arrangement of exploratory approaches for investigating changing frequency content in a signal, which can then be connected with anomalies forms in a framework.
Methods of signal transforming are major in comprehension signals from a wide mixed bag of fields. Raw time-amplitude signal that was transformed into frequency domain distinguishes the frequency substance of the signal, which is regularly more helpful than time space data for examination of dynamic properties. A fourier transform of a time period arrangement, for example a data signal of tremor record, contains data in regards to the frequency substance, however it can't resolve the accurate onset of changes in natural frequency, as time of transient data is carried just in the phase of the change.
Time-frequency analysis is a technique for changing from a time arrangement into a two-dimensional representation of frequency substance as for time. A TF analysis, by communicating frequency content at distinctive segments of a record, takes into consideration examination of developing signs. Numerous application or specialized works were directed utilizing TFR device for instance as a part of mechanical shortcoming analysis (Li et al., 2013) and (Dong and Chen, 2012), speech (Tantibundhit et al., 2010), biomedical (Abdulla and Wong, 2011) and (Musselman and Djurdjanovic, 2012), electronic framework (Castillejos et al., 2012), seismic (Zhao et al., 2014) and (Zheng et al., 2013), geotechnical (Sudha et al., 2009), etc., in which different
TFR techniques have been employed to extract significant physical parameters from the raw signals.
In this paper we show the probability of the time frequency representation to identify inconsistency in artificial signal. First and foremost, utilizing a couple of TFR strategies, we extract the instantaneous frequency to make a comparison then determine the best representation in time-frequency plane. At that point we apply that TFR strategy to identify irregularity in artificial signal.
TIME-FREQUENCY ANALYSIS STRATEGY
Introduction of time-frequency analysis
Time-frequency representations are more generally utilized for non stationary signal examination which a robust strategy to transform a one-dimensional signal x(t) into a two-dimensional function of time and frequency, TFR (x;t, ω) to concentrate pertinent data. There exist numerous sorts of TFR algorithms which most of these instruments fall into two classifications: linear and quadratic techniques (Flandrin, 1999), each of which has its own particular qualities and shortcomings.
In the first method known as linear methods, the signal to be investigated is portrayed by its inner products with a preassigned group of layouts, created from one (or a couple of) essential format by basic operations. Cases are the windowed fourier transform, where the group of formats is produced by translating and modulating an essential window capacity. Another example is wavelet transform, where the layouts are gotten by translating and dilating the basic or so called mother wavelet.
giving better concentration in the time-frequency plane. Even so, the representation of a multi-segment signal is rendered more muddled by the vicinity of interference between the TF representations of the individual segments; these impacts additionally cause the time-frequency density to be negative in a few sections of the TF plane. These negative sections however can be uprooted by some additional operation.
In summary, the linear methods are normally effective and simple to remake, however give lacking resolution. While the quadratic methods give comparatively better resolution yet need higher computational expense due to extra works for signal reconstruction. Among the methodologies proposed to treat this issue, the reallocation (or reassignment) methods (Auger and Flandrin, 1995), (Chassande-Mottin et al., 2003), (Chassande-Mottin et al., 1997) and (Daubechies and Maes, 1996) can be seen as linear strategies, accompanied by reassigning estimations of the TFR. Example of such methods is the synchrosqueezed wavelet transform, which was introduced in (Daubechies and Maes 1996) and given thorough legitimization for a critical class of signals (Daubechies et al., 2011).
Synchrosqueezed wavelet transform (SWT), initially presented in the speech signals (Daubechies and Maes, 1996) has demonstrated to be a distinct option for the EMD method (Daubechies et al., 2011), giving contribution of enhancing spectral resolution. This method is basically a combination of wavelet analysis and time-frequency reallocation method that relatively new approach to enhance the nature of time-frequency representation. SWT has well capability to decompose non-stationary and noisy signals into its components and gives an appealing distinct option for EMD. Its fundamental focal points are: vigor in the vicinity of noise and no prerequisites of band pass filtering or discontinuity measure.
Numerical example
As discussed above regarding to TFR of a sign x(t), TFR(t, ω ), the objective is to figure out the intensity of the frequency ω at time t. As the vulnerability guideline blocks an immaculate concurrent portrayal of time and frequency, all TF representations are by need close estimations to instantaneous frequency. These estimations vary in exactness, and there exist additional obstructions to translating a general TFR as vitality dispersion in the TF plane.
As a sample of calculation, let us consider a blend of one sinusoid and one AM-FM type signals. This can be outlined by an illustration as demonstrated in Figure 1a where a signal x(t) is characterized by
� = { cos cos � + .5� , 5 ≤ ≤� + sin � , ≤ ≤ 5 (1)
The synthetic signal x(t) has a 15 Hz component modulated by a 1 Hz sinusoid from 0 to 5s and a constant harmonics of 15 Hz from time 5 to 10s. Figure-1b shows the instantaneous frequencies for both components.
a
b
Figure-1. Numerical signal. a) Synthetic signal with four sinusoidal components, b) Instantaneous frequencies obtained as the derivative of each one of the independent
components.
As such, wavelet analysis is one of the best appropriate and favourite types of TFR by most researchers for analysing non stationary and non linear signal data. The bump wavelet type analysis as plotted in the Figure-2a able to identify both local frequency components before and after the switch point as well as the position of the frequency switch at 5s. The frequency resolution however is not all that great particularly for the high frequency range and there is extra vertical line at the switching point at 5s. Second type of wavelet known as lognorm (Figure-2b), demonstrates a superior frequency resolution contrasted with bump type in which more sharpened. In general observation of wavelet analysis, it can be seen that there is leakage energy to neighbouring modes. In this way, the selection of wavelet type assumes a critical part with a specific end goal to get helpful and exact results from the analysis. Accordingly from this figure, we can see that the wavelet-based TFR is excessively ambiguous for us, making it insufficient to perceive the TF information of the signal.
To get clearer TF mapping, the synchrosqueezed wavelet transform algorithm is utilized as demonstrated in Figure-2c. The synchrosqueezed has the capacity impeccably depict every individual segment and to determine the instantaneous frequencies near to the theoretical value, including modulated amplitude signal. The overlapping point additionally gives a superior representation contrast with wavelet analysis.
synchrosqueezed which is more concentrate and enhancing fundamentally the frequency resolution to show signs of improvement result as demonstrated in Figure-2c.
a
b
c
Figure-2. Time-frequency representation; a) Bump wavelet type. b) Lognorm wavelet type. d)
Synchrosqueezed wavelet transform.
IRREGULARITY DETECTION
In numerous reasonable applications, in an extensive variety of fields for example manufacturing and seismology, one is confronted with signal that have a few components, all sensibly very much confined in time-frequency space, at distinctive positions. The components which frequently non-stationary, as in they can present jumps or changes in conduct, might be vital to extract as precisely as could reasonably be expected. In engineering application, for instance in manufacturing industrial, there constantly mechanical failure happen that at last impact the production or profit of the company. The more regrettable case perhaps happen if the failure will give more prominent harm to individuals encompassing furthermore awful impact to environment, for example, contamination. It was happened more often than not begin from the minor harm that can be forestalled in case if it was identified at right on time stage. That was solid motivation behind why all the mechanical part ought to be checked and services frequently. One of the strategies is by doing abnormality discovery at right on time phase of failure and this can be done using signal analysis approach.
For preliminary study, this work will perform signal analysis to detect irregularity using artificial signal. Employing time-frequency representation, wavelet transform and synchrosqueezed wavelet transform analysis will be utilized in this work.
has two different frequencies f1 and f2 is characterized by
the Equation
� = { �� �� + � = . 5 , .5 ≤ ≤ .�� �� , ≤ ≤ .5 (2)
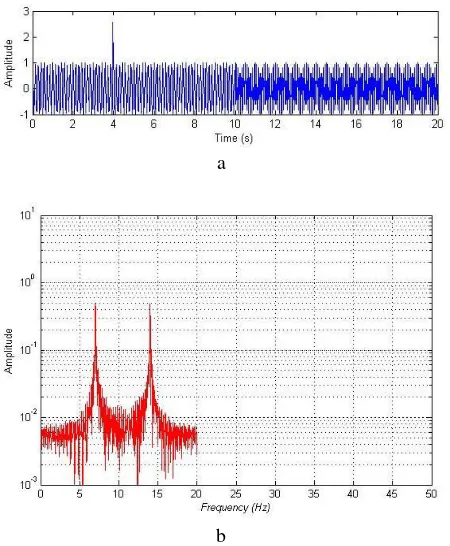
where f1 and f2 have the value of 7Hz and 14Hz
individually. This signal has been chosen so as to demonstrate the capacity of the time frequency analysis strategy to isolate the distinctive frequency components and also to recognize the abnormalities exhibit in the signal. Figure-3a demonstrates the time domain of the signal alongside its Fourier spectrum.
As we can see from Figure-3b, the two frequencies components are very much displayed in the fourier spectrum anyway it neglects to recognize the spike of the anomaly in the signal.
a
[image:4.595.312.542.161.578.2]b
Figure-3. Representation of signal v(t). a) Time domain, b) frequency spectrum.
Figure 4a and 4b demonstrate the lognorm type wavelet transform analysis and synschrosqueezed wavelet transform analysis separately. As should be obvious in the first strategy, wavelet transform ready to distinguish the two segments signal including the impulse which correspond to abnormality in the signal however relatively give a poor resolution with a spread normal frequency range.
On the other hand, the synschrosqueezed wavelet (Figure-4b) has the capacity consummately portray every individual segment and additionally the abnormality near to the theoretical value. Contrasted with wavelet, the
synschrosqueezed has the capacity delineate smooth and sharp changes in the frequency lines, which is enhancing fundamentally the frequency resolution.
a
[image:4.595.58.283.316.589.2]b
Figure-4. Irregularity detection using artificial signal. a) Lognorm type wavelet transform analysis. b) Synschrosqueeze wavelet transform analysis.
CONCLUSIONS
From this study, it can be summarised that the irregularity in the signal is successfully identified using a time frequency analysis. An approached introduced by Daubechies et al., (2011) (Daubechies et al. 2011) known as synchrosqueezed wavelet transform give the best representation compare to wavelet transform analysis. Using this method, it’s able to perfectly delineate each individual component as well as the irregularity in the signal close to the theoretical value. The time frequency components sharper and more condensed along the time and frequency lines in which overally improving significantly the maping resolution. Therefore, synchrosqueezed wavelet transform analyses have been shown to provide better identification of the irregularity in the signal compare to currently well-known wavelet transform.
ACKNOWLEDGMENTS
The support from the Ministry of Higher Education Malaysia via FRGS grant RDU 130111 is gratefully acknowledged. The authors would like to thank the team members of Advanced Structural Integrity and Vibration Research (ASIVR) group under Faculty of Mechanical Engineering, Universiti Malaysia Pahang for their support and beneficial idea to improve the content of the paper.
REFERENCES
Abdulla, W. and Wong, L. 2011. Neonatal EEG signal characteristics using time frequency analysis. Physica A: Statistical Mechanics and its Applications. 390(6), pp. 1096-1110.
Auger, F. and Flandrin, P. 1995. Improving the readability of time-frequency and time-scale representations by the reassignment method. IEEE Transactions on Signal Processing. 43(5), pp. 1068-1089.
Castillejos, H., Ponomaryov, V., Nino-De-Rivera, L. and Golikov, V. 2012. Wavelet transform fuzzy algorithms for dermoscopic image segmentation. Computational and Mathematical Methods in Medicine, 2012.
Chassande-Mottin, E., Daubechies, I., Auger, F. and Flandrin, P. 1997. Differential reassignment. IEEE Signal Processing Letters. 4(10), pp. 293-294.
Chassande-Mottin, E., Auger, F. and Flandrin, P. 2003. Time-frequency/time-scale reassignment. In Wavelets and signal processing. Birkhäuser, Boston, MA, pp. 233-267.
Daubechies I., Lu J. and Wu H.T. 2011. Synchrosqueezed wavelet transforms: An empirical mode decomposition-like tool. Applied and Computational Harmonic Analysis. 30(2): 243-261.
Daubechies I. and Maes S. 1996. A nonlinear squeezing of the continuous wavelet transform based on auditory nerve models. In Wavelets in Medicine and Biology. CRC Press. pp. 527-546.
Dong G. and Chen J. 2012. Noise resistant time frequency analysis and application in fault diagnosis of rolling element bearings. Mechanical Systems and Signal Processing. 33, pp. 212-236.
Flandrin P. 1999. Time-Frequency/Time-Scale Analysis, Wavelet Analysis and Its Applications. In San Diego, CA, Academic Press Inc.
Li B., Mi S.S., Liu P.Y. and Wang Z.J. 2013. Classification of time-frequency representations using improved morphological pattern spectrum for engine fault diagnosis. Journal of Sound and Vibration. 332(13): 3329-3337.
Musselman M. and Djurdjanovic D. 2012. Time– frequency distributions in the classification of epilepsy from EEG signals. Expert Systems with Applications. 39(13): 11413-11422.
Sudha K., Israil M., Mittal S. and Rai J. 2009. Soil characterization using electrical resistivity tomography and geotechnical investigations. Journal of Applied Geophysics. 67(1): 74-79.
Tantibundhit C., Pernkopf F. and Kubin G. 2010. Joint time-frequency segmentation algorithm for transient speech decomposition and speech enhancement. IEEE Transactions on Audio, Speech and Language Processing. 18(6): 1417-1428.
Zhao Y., Liu Y., Li X. and Jiang N. 2014. Time-frequency domain SNR estimation and its application in seismic data processing. Journal of Applied Geophysics. 107, pp. 25-35.