An Analysis of the Effects of Inventory Management on
the Performance of the Procurement Function of Sugar
Manufacturing Companies in the Western Kenya Sugar
Belt
Cynthia Mito Mukopi1, Dr. Amuhaya Mike Iravo2
1
Master of Science in Procurement and Logistics, Jomo Kenyatta University of Agriculture and Technology
2
Supervisor, Jomo Kenyatta University of Agriculture and Technology
Abstract- The research project examined the effect of inventory management on performance of the procurement function of sugar manufacturing companies in the western sugar belt. The first objective established the significance of a lean inventory system on the performance of the procurement function of sugar manufacturing companies in the western sugar belt. The second objective found out how strategic supplier partnerships in inventory management affect the performance of the procurement function of sugar manufacturing companies in the western sugar belt. The third objective investigated the effect of information technology in inventory management on the performance of the procurement function of sugar manufacturing companies in the western sugar belt. The fourth objective examined the effect of the legal policies on inventory management in the sugar industry on the performance of the procurement function of sugar manufacturing companies in the western sugar belt. Descriptive research design, specifically a survey study was employed in carrying out the research. The target population of the study consisted of a sample of procurement personnel of Mumias Sugar Company, West Kenya Sugar Company, Nzoia Sugar Company and Butali Sugar Mills which was 30 procurement personnel out of the total target population that was 100 procurement personnel. The research instrument was structured questionnaires that were self administered to the respondents. Data was analyzed using SPSS and presented in tables and charts. The response rate was 87%. The ANOVA result for all variables indicated that there was a highly significant relationship between the variables at F = 2.727 and P = 0.000. This means that there is a strong relationship between the four variables; lean inventory systems, strategic supplier partnerships, information technology, legal policies and the effect of inventory management on performance of the procurement function of sugar manufacturing companies in the western sugar belt.
Index Terms- Inventory management, Procurement Function, Performance
I. INTRODUCTION
nventory management is a critical management issue for manufacturing companies. Inventories are vital to the successful functioning of manufacturing organizations.
According to Buffa and Sarin (2007) there are several reasons for keeping inventory. Too much stock could result in funds being tied down, increase in holding cost, deterioration of materials, obsolescence and theft. On the other hand, shortage of materials can lead to interruption of products for sales; poor customer relations and underutilized machines and equipments. Inventories may consist of raw materials, work-in-progress, spare parts/consumables, and finished goods. It is not necessary that a company has all these inventory classes. But, whatever may be, the inventory items, need management as, generally, a substantial share of an Organization’s funds is invested in them. Different departments within the same organization adopt different attitude towards inventory. For example, the sales department might desire large stock in reserve to meet virtually every demand that comes. The production department similarly would ask for stocks of materials so that the production system runs uninterrupted. On the other hand, the finance department would always argue for a minimum investment in stocks so that the funds could be used elsewhere for other better purposes, (Vohra, 2008:427). Inventory represents an important decision variable at all stages of product manufacturing, distribution and sales, in addition to being a major portion of total current assets of many organizations.
The procurement function is responsible for managing the purchasing activity for the company (Lysons, 2012). There are two types of purchasing or procurement departments: centralized and decentralized. In a centralized model, all requests for materials or goods are center to this department. In a decentralized model, individual departments can process their own purchases. Regardless of the organizational model used procurement is subject to more scrutiny and review than any other process. The use of company resources to purchase goods and services must be based on adherence to specific policies and procedures to reduce the chance of fraud and theft. The main purpose of the procurement function is to manage the process used for the purchase of goods and services by the organization. Inventory Management encompasses processes that ensure product availability while reducing investment costs (Krautter, 2009; Schroeder, 2000). For most companies, there are two forms of inventory: Physical and Logical. Physical inventory includes all the materials that are tangible and required to fabricate the final product (Toomey, 2000). On the other hand, examples of logical inventory are databases, inventory tracking
software, et al. Proper synchronization of these two inventories is essential for proper management of company assets. Inventory management also involves identifying the most effective source of supply for each item in each stocking location. Forecasting and replenishment are also integral to inventory management. Koumanakos (2008) studied the effect of inventory management on firm performance 1, 358 manufacturing firms operating in three industrial sectors in Greece, food textiles and chemicals were used in the study covering 2000 – 2002 period. The findings suggested that the higher the level of inventories preserved by a firm, the lower the rate of return. Agus and Noor (2006) did measure the perception of managers about the impact of inventory management practices on financial performance of manufacturing firms in Malaysia. However, circumstances in Malaysia could be different from those in Kenya.
In the past, inventory management was not seen to be necessary. In fact excess inventories were considered as indication of wealth. Management by then considered over stocking beneficial. But today firms have started to embrace effective inventory management (Susan & Michael, 2000). Managers, now more than ever before, need reliable and effective inventory control in order to reduce costs and remain competitive (Closs,1989).According to Dobler and Burt (2006), inventory alone account for as much as 30% of the organization invested capital. It’s for this reason that the Government of Kenya through its Supplies manual (2007) instituted procedures and techniques for the purpose of effective inventory management.
There are 3 sugar belts in Kenya, namely the Nyando, the Western sugar belt and the South Nyanza sugar zone. The western sugar belt occupies the western part of Kenya formerly the western province of Kenya in the counties of Kakamega, Bungoma and Busia. The sugar manufacturing companies in the Western Sugar belt are Mumias sugar company, West Kenya Sugar Company, Nzoia Sugar Company and Butali Sugar Mills. Mumias Sugar Company Limited is the largest sugar manufacturer in Kenya producing about 250, 000 metric tonnes (42%) of the estimated 600, 000 metric tonnes annual national output. The company maintains is located in the town of Mumias, in Kakamega County, near the sugar plantations.
West Kenya Sugar Company Limited is the fastest growing sugar company in Kenya located in Shamberere along the Kakamega –Webuye road in Kakamega County. West Kenya, the second largest sugar producer in the country after Mumias, crushes 3,000 metric tonnes of raw cane daily. Nzoia Sugar Company Limited is one of the key players in Kenya’s Sugar Industry. Nzoia Sugar Company is located in Bungoma County. The company serves over 67, 000 farmers in the larger Bungoma, Kakamega, Lugari and Malava Districts. Butali Sugar Company is an ultra modern sugar factory sugar factory within the heart of Kakamega County in the Western part of Kenya. The company is set in a rural peasant community. Its major objective is to promote and represent the interests of sugarcane farmers within the Butali sugar zone in the larger Western sugar belt.
A study on the effect of inventory management on performance of the procurement function of sugar manufacturing companies cannot be overlooked. Problems of inventory management and control in the procurement function have been around for a very long time. We usually think of stocks being
held by organizations to allow efficient and continuous operations. Procurement managers are aware of the vital roles inventory plays in the activities of the purchasing function in organizations. Effective inventory management is essential in the operation of any business (Bassin, 2014). It is therefore very important for the procurement function in a company to successfully manage their inventory and use all techniques that they see fit for their type of business. By doing this they can lower overhead costs and increase their customer satisfaction by having goods available when the customer demands them thus improving the performance of their procurement function. Both Physical and Logical inventory needs to be assessed and managed in a way in which the information is true and accurate so that there is no overstocking and minimal shortages are realized. Good inventory management by the procurement function also means having accurate forecasting and accurately timed replenishments (Onwubolu & Dube, 2006). In most companies, inventories represent up to 50% of the total product cost, the money entrusted on inventory, thereby affecting the performance of the procurement function and the overall performance of the company.
Sugar manufacturing companies do not manage and control their inventory holding, resulting in under stocking of the cane causing the companies to stay off production and stock outs of the sugar thereby resulting to poor performance of the procurement function. This therefore creates relationship problems between inventory management and the performance of the procurement function. The inventories under study are the raw materials: cane and the finished goods: sugar. The aim of this study will be to establish the effect of inventory management on the performance of the procurement function of sugar manufacturing companies in the western sugar belt.
The general objective of this study was to examine the effect of inventory management on the performance of the procurement function of sugar manufacturing companies in the western sugar belt. The specific objectives were to establish the significance of a lean inventory system on the performance of the procurement function of sugar manufacturing companies in the western sugar belt, to find out how strategic supplier partnerships in inventory management affects the performance of the procurement function of sugar manufacturing companies in the western sugar belt, to investigate the effect of information technology in inventory management on the performance of the procurement function of sugar manufacturing companies in western sugar belt and to examine the effect of the legal policies on inventory management in the sugar industry on the performance of the procurement function of sugar manufacturing companies in the western sugar belt.
inventory control and better performance of the procurement function in the sugar manufacturing companies. Inventory management will result to prudent utilization of resources resulting to improved services to the stakeholders by the procurement function. This will improve the economy of the country and also improve the people’s standard of living. The researcher will not only fulfill the partial requirement for the award of a degree of Masters of Science in Procurement and Logistics but will also serve as a basis for further research in the field of inventory management in relation to the performance of the procurement function.
The research focused on the effect of inventory management on performance of the procurement function of sugar manufacturing companies in the Western sugar belt. The study involved procurement officers of Mumias Sugar Company, West Kenya Sugar Company, Nzoia Sugar Company and Butali Sugar Company.
II. LITERATUREREVIEW
2.1 Theoretical Framework
This will give an evaluation of the research by other scholars and will help make logical sense of the relationship between inventory management and the performance of the procurement function in sugar manufacturing companies.
2.1.1 Economic Order Quantity Theory
Economic order quantity is the cost of inventory that minimizes the total cost of inventory management. Dave Plasecki (2001) defines Economic Order Quantity as an accounting formula that determines the point at which the combination of order costs and inventory costs are the least. Economic order quantity is the number of units that a company should add to inventory with each order to minimize the total cost of inventory, such as holding costs, ordering costs and stock out costs.EOQ is used as part of continuous review system in which the level inventory is monitored at all times and fixed quantity is ordered each time the inventory reaches a specific reorder point (Lysons, 2012). Muckstadt et al., (2010) discussed that EOQ model was determined by minimizing the total annual cost incurred by the company by virtue of its ordering cost and carrying cost. The expression for total annual cost is:
TC= q/2 h +D/Q s Where,
TC=total annual cost Q=order quantity D=annual demand S=ordering cost
H=annual carrying cost per unit
Muckstadt et al., (2010) also said that the first component of this equation represented the inventory management costs and the second component represents the ordering cost. EOQ minimizes the sum of holding and setup costs. Differentiating with respect to order quantity, the expression for EOQ was obtained as indicated in the equation below. Q = 2DCo/Ch
D = annual demand Co = ordering/setup costs
Ch = cost of holding one unit of inventory
2.1.2 Resource Dependency Theory
According to resource dependence theory (RDT), firms seek to reduce uncertainty and manage dependence by purposely structuring their exchange relationships, establishing formal and semiformal linkages with other firms. Through interdependence, firms can synergistically combine their own resource sets with the complementary resources of their partners and thus develop a resource bundle that is unique and hard to imitate (Harrison et al., 2001). By cultivating such relationship-specific capabilities that become superior to what the organizations may possess on their own firms can obtain sustainable competitive advantage and improved procurement performance (Sambharya & Banerji, 2006; Paulraj & Chen, 2007). In this aspect, RDT is a relevant theory to SCM because it can help elaborate organization-environment boundary spanning activities, implying that a single firm can hardly achieve sustainable growth. Therefore, firms need to depend on the buyer-supplier relationship which helps improve cooperation and coordination among supply chain members (Dyer, 2000).
For SCM to be strategic in nature, it is imperative that buyer firms adopt strategic initiatives, that is, implementation of GSCM practices that foster an effective relationship to provide mutual benefits (Paulraj & Chen, 2007).In the context of GSCM, inter-organizational collaboration is even more important for managing the internal and external coordination and cooperation to have the system successfully implemented throughout the whole supply chains (Zhu et al., 2010). Handfieldet al. (2002) developed a decision model to measure environmental practice of suppliers using a multi-attribute utility theory approach. Kainuma and Tawara (2006) proposed the multiple attribute utility theory method for assessing a supply chain including re-use and recycling throughout the life cycle of products and services.
2.2 Conceptual Framework
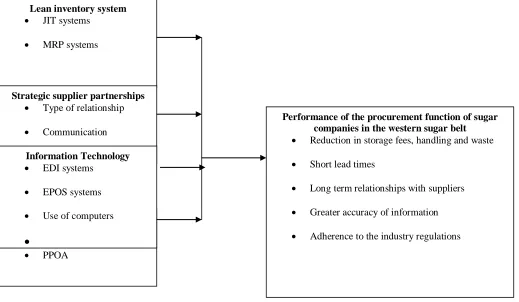
The conceptual framework for this research brings forth the independent and dependent variables of the study. The independent variables are thevariables that I will manipulate in order to determine their effect or influence on the dependent variable. They will help me predict the amount of variation that occurs in the dependent variable (Kothari, 2008).The value of the dependent variable depends on the independent variables. The independent variables will include: lean inventory system, strategic supplier partnerships, information technology and the legal policies on inventory management in the sugar industry. The dependent variable is the performance of the procurement function of sugar manufacturing companies in the western sugar belt. The relationship between independent variables and the dependent variable is of profound importance as it will clearly stipulate the effect of inventory management on the performance of the procurement function of the sugar manufacturing companies in the western sugar belt in Kenya.
2.2.1 Lean Inventory System
(Brigham & Gapenski, 2010). Lean Management is getting more and more attention in today’s highly competitive environment. The proponents of Lean Inventory system argue that excess inventory will adversely affect the net cash flows of a firm. On the cost side, most obvious are the costs of holding inventory, which include the capital costs (interest or opportunity) and the physical cost (storage, insurance and spoilage). In recent years, a number of systems have been developed in the field of operations management to deal with excess inventory problem. Management–oriented systems include the Just-In-Time (JIT) and Materials Requirements Planning systems (MRP).
Just-In-Time refers to a collection of practices that eliminate waste. These organization wide practices encompass the entire supply chain. The elements of JIT include shared product design with suppliers and customers, movement towards single sourcing proximate suppliers, reduced machine set- up times and total preventive maintenance. It is an inventory strategy that is implemented to improve the return on investment of a business by reducing inventory and its associated carrying costs. In order to achieve JIT, the process must have signals of what is going on everywhere within the process. JIT can lead to dramatic improvements in a manufacturing organization’s return on investments, quality and efficiency. It emphasizes that production should create items that arrive when needed, neither earlier nor later.
Quick communication of the consumption of old stock, which triggers new stock to be ordered, is key to JIT and inventory reduction. This saves warehouse space and costs. The basic philosophy of JIT is that inventory is defined as waste. The technique was first used by Ford motor company. It was subsequently adopted and publicized by Toyota Motor Corporation of Japan in the 1950s.
MRP system is defined as product- oriented computerized technology aimed at minimizing inventory and maintaining delivery schedules. It relates the dependent requirements for materials and components comprising an end product to time periods over planned horizon on the basis of forecasts provided by marketing and sales and other input information (Lysons and Gillingham, 2003). This system is based on the recognition that demands for an item may be dependent on the demand for other inventory items. The emphasis is on the end product into which related parts are incorporated. The inventory quantities required are specified on the basis of future demand. The demand for inventory items is precisely determined from the master production schedule for the end products. The operation of a lean inventory system such as JIT and MRP result in relatively low inventory levels. The warehousing costs and material handling costs are significantly reduced. This increases return on assets through decreased conversion costs.
2.2.2 Strategic supplier partnerships
Lysons and Gillingham (2003) define strategic partnering as a commitment by both customers and suppliers, regardless of size, to a long term relationship based on clear, mutually agreed objectives to strive for world class capability. The emphasis is on good working relations between customers and suppliers. The concept of strategic supplier partners developed strongly in the 1980s as a result of the movement towards just- in–time (JIT) manufacturing. JIT emphasizes reduction in waste, shortening of
lead times, improvement and simplicity. These are also the goals of strategic supplier partnerships (Bicheno, 2004). The philosophy is that through co-operation rather than confrontation both parties benefit. In strategic partnership, long term table relationships are sought rather than short term and adversarial relations. The contracts are long term in order to give the supplier confidence and the motivation to invest and improve. For partnership to work, proper communication is an important factor. The suppliers and customers who communicate clearly and directly are judged to be more effective. Personal connections with supplier’s representatives remain important despite the increasing use of electronic communication of all kinds. There is also need to embrace the principle of early supplier involvement in design. This reduces the chances to defective items and the risk of obsolescence because the supplier is involved in the design process (Brownell, 2005).
Vendor Managed Inventory (VMI) is a new feature of supplier partnerships. In a VMI relationship, the supplier holds inventory on site or near the customer, allowing the customer’s instant access to the inventory. This immediate access allows the customer to pull inventory as needed and only pay for that which is consumed, thus reducing inventory investment and increasing inventory turns. In VMI arrangements the supplier has a responsibility for replenishing stock, which would include ordering, managing the logistics to ship the material and counting inventory. By passing these costs normally managed by the customer on the supplier, the customer is able to reduce the overall cost of their product and increase their margins. The supplier benefits from a higher share of the purchaser’s total purchase requirements (Loughrin, 2008).
machine breakdowns and machine fluctuations which necessitate increased inventories
2.2.3 Information Technology
Carter and Price (2010) assert that information is the life blood of all organizations. An Inventory manager needs information technology in order to succeed in his work. Computers can assist in stock control in calculating the optimum amount of stock to hold and dispatch in order to satisfy the user requirements. The computer can do this by comparing inventory variables (stock levels, demand and delivery dates). The Electronic Data Interchange, EDI is a system which enables direct communication between organizations without there being any human intervention. This technology has revolutionized inventory management. EDI is the name given to the transmission and receipt of structured data by the computer systems of trading partners, often without human intervention. The international Data interchange association defines EDI as “the transfer of structured data, by agreed message standards from one computer system to another, by electronic means (Jessop, 2006). With the EDI system linking the buying organization with its suppliers, the replenishment can be triggered at the instant the need arises and the message is transferred from the original destination without further possibility of corruption en route.
An EDI link also enables the computers of suppliers and customers to interrogate each other about stock levels, production plans and similar information so that activities are appropriately synchronized. This brings potential benefits in form of reduced paper work, greater accuracy of information, reduced staff costs and shorter lead times arising from instantaneous communication.
Electronic point of sale, EPOS is another technology used in inventory management. The purpose of EPOS is to scan and capture information relating to goods sold. An EPOS system verifies checks and provides instant sales reports, charges transactions and sends out intra- and inter- stores messages. The EPOS technology allows substantial cost savings and gives “real time” information on sale of goods, patterns of stores traffic, and popularity and profitability of every line carried. It enables stock to be limited to demand, reduces the risk of obsolescence and deterioration of stocks, reduced chances of theft and provides information to buyers. This leads to improved customer service and hence improved financial performance (Lysons, 2012).
2.2.4 Legal policies
The Kenya Sugar Board (KSB) is the regulatory body of the Sugar Industry in Kenya. The mandate of the Kenya Sugar Board as stipulated in Section 4 (1) and 4 (2) of the Sugar Act 2001 is as follows: regulate, develop and promote the Sugar Industry; co-ordinate the activities of individuals and organizations within the industry; Facilitate equitable access to the benefits and resources of the industry by all interested parties. The Kenya Sugar Board is charged with the responsibility of regulating, developing and promoting the Kenya Sugar Industry. Its specific roles are to: Co-ordinate the activities of individuals and organizations within the industry; Facilitate the equitable access to the benefits and resources of the industry by all interested parties; Formulate and implement overall policies and plans for
the development of the industry; Act as an intermediary between the Government and the industry; Facilitate the flow of research findings to interested parties; Monitor the domestic market in order to identify and advice on any distortions in the sugar market; Facilitate the arbitration of disputes among interested parties; Facilitate the export of Local sugar; Promote and encourage the use of environment friendly technologies in the industry; Provide advisory services to growers and millers; Facilitate an equitable mechanism for the pricing of sugar-cane and appropriation of proceeds from the disposal of the by-products of sugar production between growers and millers; Represent the industry in other organizations that are relevant to the promotion of the industry; Oversee the formulation of standard provisions governing the mutual rights and obligations of growers and millers; Collect and analyze industry statistics and maintain a database for the industry; and promote the efficiency and development of the industry through the establishment of appropriate institutional linkages.
The service delivery of the Kenya Sugar Board include: Competitiveness: Theyare committed to engaging in practices that ensure competitiveness in a global setting; Teamwork: In order to meet their goals, they practice teamwork to optimize the synergies of individual and collective human resources, talent and capacity; Integrity:They uphold virtues of integrity through honesty, confidentiality and fairness in discharging their responsibilities; Efficiency: With highly motivated staff, they ensure optimum utilization of all resources available to deliver quality and timely services to all their stakeholders; Accountability:They endeavor to manage the resources entrusted to them in a professional and transparent manner; Social Responsibility:They endeavor to be socially responsible to their stakeholders and society and pursue their goals through socially acceptable practices that preserve the environment, promote socio-economic development and add value to our country. The Public Procurement Oversight Authority oversees all the procurement activities in public entities. It was created in 2005 under the Public Procurement and Disposal Act was enacted. It is mandated with the responsibility of ensuring that all procurement procedures established under the Act are complied with, monitoring the procurement system and reporting its overall functioning, initiating public procurement policy and assisting in the implementing and operation of the public procurement system (PPOA, 2008). Public entities should draft procurement policies that are compatible with procurement regulations and all employees should be made aware of the formulated policies. The PPOA directives should be put in mind while formulating procurement policies.
2.2.5 Performance of the procurement function
materials to the factory and distribution of finished goods. If inventory management is not adequately maintained, production cannot meet the aspirations of customers which are loss of revenue to the organization. Right from procurement to the time of processing, quality of raw material is the chief determinant of the productive efficiency of any manufacturing concern.
Lawson (2008), views that the most effective measurement systems assess performance in the entire length of the Organization’s procurement function, from suppliers through internal processes to customers. The measures are divided in five major categories which include cost measures, quality measures, time measures, supplier performance measures and customer satisfaction measures. The metrics that are used in performance measurement should be those that truly capture the essence of the
procurement function performance. A measurement system should facilitate the assignment of metrics to where they would be most appropriate. For effective performance measurement, measurement goals must represent the goals of the function and metrics selected should reflect a balance between financial and non-financial measures that can aid in decision making.
The performance of the procurement function encompasses the financial performance and market performance. Business profitability is a justification of its good performance and loss is a justification of poor performance. Profits are an indication of good performance. A higher percentage of the return on assets shows how profitable a company’s assets are generating revenue.
Legal
[image:6.612.21.540.232.534.2]Independent variables Dependent variable
Fig. 2.1 Conceptual Framework
2.3 Empirical Review
An important factor in inventory management relates to production scheduling. Continuous process manufacturers often produce a mix of products, one at a time, using the same equipment and facilities. Each time a different product is to be produced, it is necessary to stop the production process and make adjustments before proceeding (Ritzman et.al, 2003).
The costs of shutdown and adjustments, which are referred to here as changeover costs, can be rather high. Production time is lost while the facilities are closed down, and labor costs must be expended to make the necessary adjustments (Ritzman et.al, 2003). As a consequence of the changeover costs, businesses try
to find ways to minimize the number of changeovers. One of the principle ways of achieving this goal is through the use of inventory. Simply put, a company can choose to make many short production runs on each product in the mix, thereby incurring many changeovers and having smaller lots in inventory or it can opt for long production runs and very few changeovers and increasing inventory lots.
In 1880 there was a change in manufacturing practice from companies with relatively homogeneous lines of products to horizontally integrated companies with unprecedented diversity in processes and products. Those companies (especially in metalworking) attempted to achieve success through economies
Lean inventory system • JIT systems
• MRP systems
Legal Policies • KSB
• PPOA
Strategic supplier partnerships • Type of relationship
• Communication
Information Technology • EDI systems
• EPOS systems
• Use of computers
•
Performance of the procurement function of sugar companies in the western sugar belt • Reduction in storage fees, handling and waste
• Short lead times
• Long term relationships with suppliers
• Greater accuracy of information
of scale- the gains of jointly producing two or more products in one facility. The managers now needed information on the effect of product-mix decisions on overall profits and therefore needed accurate product-cost information. A variety of attempts to achieve this were unsuccessful due to the huge overhead of the information processing of the time (Wagner, 2002). However, the rapidly increasing need for financial reporting after 1900 created unavoidable pressure for financial accounting of stock and the management need to cost manage products became overshadowed. In particular, it was the need for audited accounts that sealed the fate of managerial cost accounting. The dominance of financial reporting accounting over management accounting remains to this day with few exceptions, and the financial reporting definitions of 'cost' have distorted effective management 'cost' accounting since that time. This is particularly true of inventory (Saxena, 2009).
Inventory management entails holding an appropriate amount of inventory. Too much inventory consumes physical space, creates a financial burden, and increases the possibility of damage, spoilage and loss. On the other hand, too little inventory often disrupts business operations, and increases the likelihood of poor customer service (Dimitrios, 2008). Inventory as an asset on the balance sheet of companies has taken on increased importance because many companies are applying the strategy of reducing their investment in fixed assets, like plants, warehouses, equipment and machinery, and so on, which even highlights the significance of reducing inventory (Coyle et al., 2003). Changes in inventory levels affect return on assets (ROA), which is an important financial parameter from an internal and external perspective. Reducing inventory usually improves ROA, and vice versa if inventory goes up without offsetting increases in revenue (Coyle et, al., 2003).
Lean production/manufacturing is also an important consideration in improving the performance of the procurement function. Sanches and Ferez (2001) also investigated the link between lean production practices in manufacturing organizations and resultant enhanced competitiveness. Lean production is also expected to improve the performance of the firms through good housekeeping practices, such as general waste reduction and minimizing hazardous wastes. King and Lenox (2001) conclude that lean production is complementary to improvements in the performance of the procurement function and it often lowers the marginal cost of pollution reduction thus enhancing competitiveness.
2.4 Critique of the existing literature relevant to the study
The reviewed literature would suggest that the area of inventory management and the performance of the procurement function has not been fully studied or the area is marred with problems as the authors present it but at the same time it is clear that inventory management is key to the financial and non-financial performance of the procurement function of a company (Goldsby et al., 2005; Krautter, 2009; Schroeder, 2000). A few of the authors (Lambert, 2006) also seem to take the relationship between inventory management and the performance of the procurement function as a simple task of which it may not be the case always in some manufacturing companies.
2.5 Research Gaps
The gap remains as to how inventory management can be for it to guarantee the performance of the procurement function in any given manufacturing company. At the same time some scholars have suggested that procurement managers who turn to inventory theory research may find it to be of little significance (Krautter, 2009) or that it has little to offer in terms of enhancing inventory practices (Wagner, 2002) in the procurement function. This has led many to suggest a gap exists between inventory theory and practice as regards the procurement function (Wagner, 2002). While the varied solutions offered to bridge this gap represent valuable research, input from practitioners is noticeably absent. Therefore, an empirically derived agenda founded on practitioners identified issues that need to be researched on (Vigoroso, 2005). There is no study that has been comprehensively done on the effect of inventory management on the performance of the procurement function of manufacturing companies and hence the study intends to fill that gap.
2.6 Summary
Schroeder (2000) established that there are three motives for holding inventories, which are transaction, precautionary and speculative motives. Lyson (2006) states that inventory serves as an insurance policy against the unexpected breakthrough, delays and other disturbance that could disrupt ongoing activities. According to the review, overstocking, poor supplier relationships and poor utilization of information technology are some of the factors that limit inventory management thus influencing the performance of the procurement function. Dobler and Burt (2006) emphasized that stock represents money and similar control measures should be taken on stock as it is the case of cash. It is important to have a good inventory system as it helps in preventing stock outs, overstocking, deterioration, obsolescence and high carrying cost. A sound inventory management system is therefore vital for decision making in the procurement function and the company as a whole. Strategic supplier relationships, a lean inventory system and effective use of information technology are important to a company which expects its procurement function to operate efficiently and offer quality services.
III. RESEARCHMETHODOLOGY
The researcher utilized a descriptive survey research design as permitted an in- depth investigation of the problem under study (Yount, 2006). The design accurately describes an association between variables minimizing bias and maximizing the reliability of the data (Kothari, 2004). Questionnaires were distributed to the respondents for collecting relevant data to the study. The research study targeted all the 100 procurement officers in the procurement function of Mumias sugar company, West Kenya sugar company, Nzoia sugar company and Butali sugar mills. The study will used a survey and a sample of 30 procurement officers out of the total population was obtained using simple random sampling method. The study used simple random sampling method in selecting the respondents.
working in the procurement function. At least 30% of the total population is a representative (Borg & Gall, 2003). Thus, 30% of the accessible population is enough for the sample size in this study. Out of the 100 procurement personnel in the four sugar companies in the western sugar belt, the researcher took 30% of the total population which was 30 procurement personnel. Thus 30/100* 100 = 30
Therefore 30 procurement personnel from the four sugar companies were the respondents. 7 respondents from each company were issued with questionnaires. The study relied on primary data. Structured questionnaires were developed and administered to the respondents who indicated their responses in the spaces provided. Structured questionnaires were used since they are simple to administer and will eased the data analysis process (Barnes, 2001)
Reliability was tested using Cronbach’s alpha scores. Principal factor analysis was used to determine the content validity of the instrument. The tabulated data was subjected to both quantitative and qualitative analysis. Quantitative data analysis was helpful in data evaluation because it provided quantifiable and easy to understand results. Qualitative data analysis, on the other hand helped the researcher to gain in-depth understanding of the research findings. Quantitative data was analyzed through descriptive statistics in the form of frequencies tallies and percentages. The statistics were be generated using statistical package for social sciences (SPSS) and data obtained was communicated through pie charts and tables. Qualitative data was analyzed by organizing them in accordance with the research questions and objectives. After the analysis, the data was presented in tables and charts and recommendations and conclusions made.
IV. DATAPRESENTATIONANDFINDINGS The data is presented in form of tables and pie charts where necessary and they are in line with the research design and the objectives of the research.
4.1 Result of the pilot study
[image:8.612.353.542.282.433.2]The study involved a random selection of 3 procurement personnel from 2 sugar manufacturing companies each. The findings are recorded below. The findings are recorded in the table below
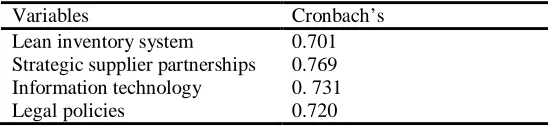
Table 4.1: Result of the pilot study
Variables Cronbach’s Lean inventory system 0.701 Strategic supplier partnerships 0.769
Information technology 0. 731 Legal policies 0.720
The findings of the pilot study in table 4.1 showed that the use of lean inventory systems had a Cronbach’s reliability value of 0.71. Strategic supplier partnerships had a reliability alpha value of 0.769. Information technology had a reliability alpha value of 0.731 and the legal policies had a reliability alpha value of 0.720.
4.2 Background Information 4.2.1 Response rate
Table 4.2: Response rate
Population Frequency Percentage
30 26 87% 100% From table 4.2, the response rate was 87%. Mugenda & Mugenda 1999, states that a response rate of 60% is good, and above 70% is perfect. Since the response rate is 87%, it is excellent.
4.2.2 Age of respondents
The study sought out the age of the respondents who were the procurement personnel in the sugar manufacturing companies within the Western sugar belt. The findings were recorded in figure 4.1.
42% 13%
9%
36% 18-30 years
30-40 years 40-50 years 50-60 years
Figure 4.1: Age of the respondents
From the findings in figure 4.1, 42% of the respondents were aged between 30-40 years, 36% were aged between 18-30 years, 13% were aged between 40-50 years, and 9% were aged between 50-60 years.
4.2.3 Years of service
The study sought to know the length of time the respondents have worked at their hospitals as this helped in determining their experience and knowledge of the hospital. The findings are indicated in figure 4.2.
20% 13%
9% 26%
32%
1-5 years 5-10 years 10-15 years 15-20 years Over 20 years
[image:8.612.30.304.579.642.2]From the findings in figure 4.2, 32% of the respondents had worked in their companies for between 5-10 years, 26% had worked for between 1-5 years, 13% had worked for between 15-20 years and 9% had worked for over 15-20 years.
4.2.4 Highest Level of Education
3%
33% 29%
35%
[image:9.612.97.292.169.292.2]Certificate Diploma Degree Masters PhD
Figure 4.3: Highest level of education
From the finding in Figure 4.3, 35% of the respondents were Diploma holders, 33% were Degree holders, 29% were Certificate holders and 3% were Masters holders and none of the respondents was a PhD holder.
4.3 Lean Inventory system
The first objective of the study was to establish the significance of a lean inventory system on the performance of the procurement function of sugar manufacturing companies in the western sugar belt. The results are recorded in the pie chart and the tables.
Table 4.3: Inventory system in use
Inventory system in use Response (%)
Manual 40% 100%
MRP 47% 100%
Barcode 10% 100%
Others 3% 100%
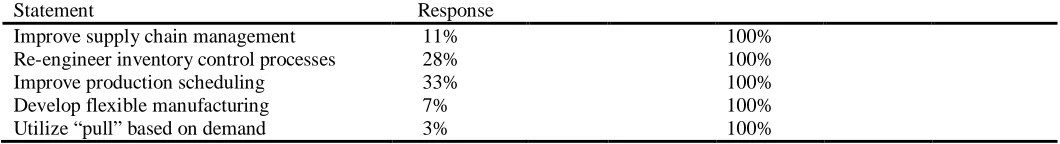
[image:9.612.86.528.362.424.2] [image:9.612.41.571.645.717.2]From table 4.3, it was found out that MRP systems are the most used inventory management systems at the sugar manufacturing companies with a percentage of 47%, manual systems came second with a percentage of 40%, use of barcodes 10% and other systems like the use of spreadsheets had 3%. The findings are in line with the findings of Timothy L, Patrick O and Nebat M (2013) that MRP is the most widely used system in inventory management because all the sugar manufacturing companies have to prepare master production schedules, with accurate bills of materials which are key elements in the MRP system. This shows that the sugar manufacturing companies have employed lean inventory systems to some extent. Table 4.4: Use of lean inventory systems. Statement Yes No Do you support the use of lean inventory system in your company? 87% 13% 100% From table 4.4, it was found out that 87% of the respondents support the use of lean inventory systems whereas 13% were not in support of lean inventory systems. The findings are in line with the findings of Fahey (2004) that the use of lean inventory systems has a positive receipt among employees of manufacturing companies. Table 4.5: How inventory levels can be reduced Statement Response Improve supply chain management 11% 100% Re-engineer inventory control processes 28% 100% Improve production scheduling 33% 100% Develop flexible manufacturing Utilize “pull” based on demand 7%
3%
From the finding in table 4.5, 33% of the respondents suggested that inventory levels can be reduced through production scheduling, 28% through re-engineering of inventory control processes, 11% by improving supply chain management, 7% by developing flexible manufacturing and 3% by utilizing “pull” based on demand. The findings support the findings of Herrmann (2006) that improving production scheduling can help reduce inventory levels in manufacturing companies.
4.5 Strategic supplier partnerships
[image:10.612.69.523.184.233.2]The second objective of the study was to find out how strategic supplier partnerships in inventory management affect the performance of the procurement function of sugar manufacturing companies in the western sugar belt.
Table 4.6: Relationship with suppliers
Statement Long term Short term
What is the nature of your company’s relationship with its suppliers?
36% 64% 100%
From table 4.6, 64% had a short term relationship with their suppliers whereas 36% had a long term relationship with their suppliers. This implies that the sugar manufacturing companies are yet to adopt the new concept of VMI which would ultimately transfer the responsibility of inventory management from the procurement functions of the companies to the suppliers and
hence substantially improve on the performance of the procurement function. This new concept dictates a long term relationship with a supplier which is not the case in the sugar manufacturing companies.
Table 4.7: Supplier appraisal
Statement Yes No
Do you appraise your suppliers? 29% 70% 100% From table 4.7, 29% of the respondents said that their
companies appraise suppliers and 71% said that their companies do not appraise their supplies. The findings support the works
[image:10.612.45.570.451.522.2]Alphonce (2015) that supplier appraisal has not been taken up fully by Kenyan retailers.
Table 4.8: Communication with suppliers
Statement Response (%)
Monthly 8% 100%
Once in every 3 months 12% 100% Twice a year 23% 100% Once a year 57% 100%
From table 4.8, it was established that 57% of the respondents communicate with their suppliers once a year, 23% twice a year, 12%once in every 3 months and 8% communicate with their suppliers monthly. This implies that most sugar manufacturing companies are not keen in communicating with their suppliers frequently. They mostly communicate with their suppliers once a year during their annual general meetings.
4.6 Information Technology
[image:10.612.67.552.650.736.2]The third objective of the study was to investigate the effect of information technology in inventory management on the performance of the procurement function of sugar manufacturing companies in the western sugar belt. The findings are recorded in table 4.9.
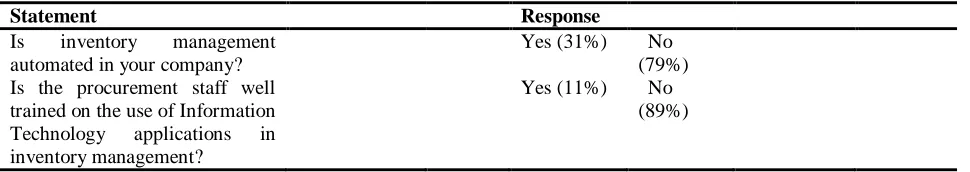
Table 4.9: Use of Information Technology
Statement Response
Is inventory management automated in your company?
Yes (31%) No (79%) Is the procurement staff well
trained on the use of Information Technology applications in inventory management?
The findings in table 4.9, a small percentage of 31% show that inventory management is automated in the sugar manufacturing companies and 79% show that inventory management is not automated in the sugar manufacturing companies in the western sugar belt. This shows that sugar manufacturing companies have to some small extent adopted the use of Information Technology in inventory management. They have automated some of their inventory management systems. Christopher (2005) asserts that the use of information
Technology in inventory management is more efficient than the use of manual systems.
4.7 Legal policies
The fourth objective of the study was to examine the effect of the legal policies on inventory management in the sugar industry on the performance of the procurement function of sugar manufacturing companies in the western sugar belt. The results are recorded in the charts and the tables.
Table 4.10: Legal policies
Statement Yes No
Are you familiar with the public procurement policies and the role of the Kenya sugar board in the sugar industry?
43% 57% 100%
From table 4.10, it was established that 57% of the respondents were not familiar with the legal policies in place and the role of the Kenya Sugar Board. 43% of the respondents were familiar with the legal polices and the role of the Kenya Sugar Board. The findings imply that a greater percentage of the respondents are not familiar with the laws guiding the procurement procedures and the legal framework of the sugar industry in Kenya.
Table 4.11: Effect of the legal policies on inventory management activities
Statement Yes No
Are the inventory 49% 51% 100%
management
activities affected by the legal policies in place?
[image:11.612.67.556.462.603.2]From table 4.11, it was established that 51% of the inventory management activities in the procurement function of sugar manufacturing companies in the western sugar belt are not affected by the legal policies in place and 49% of the inventory management activities are affected by the legal policies in place.
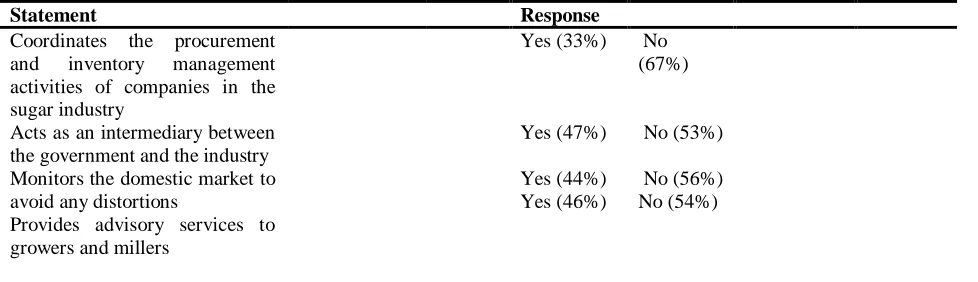
Table 4.12: The role of the Kenya Sugar Board
Statement Response
Coordinates the procurement and inventory management activities of companies in the sugar industry
Yes (33%) No (67%)
Acts as an intermediary between the government and the industry Monitors the domestic market to avoid any distortions
Provides advisory services to growers and millers
Yes (47%) Yes (44%) Yes (46%)
No (53%) No (56%) No (54%)
From table 4.12, it was established that majority of the respondents are not aware of the role of the Kenya Sugar Board
in the sugar industry yet they work in the sugar manufacturing companies.
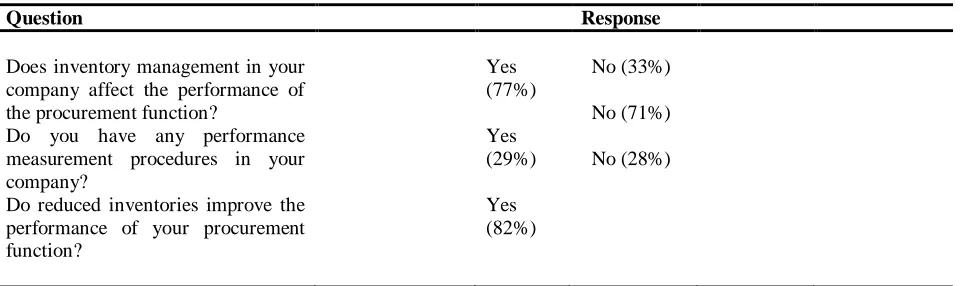
Table 4.13: Performance of the procurement function
Question Response
Does inventory management in your company affect the performance of the procurement function?
Do you have any performance measurement procedures in your company?
Do reduced inventories improve the performance of your procurement function?
Yes (77%) Yes (29%) Yes (82%)
No (33%) No (71%) No (28%)
From table 4.13, 77% of the respondents agreed that inventory management affects the performance of the procurement function of sugar manufacturing companies and 33% did not agree to that. 82% of the respondents also agreed that reduced inventories affect the performance of the
procurement function and 28% did not agree to that. 71% of the respondents said that they had never seen any performance measurement procedures at their companies whereas 29% said that they had ever seen some performance measurement procedures.
Regression
Table 4.14: Model Summary for all the Variables
Model R R Square Adjusted R Square Std. Error of the Estimate Durbin-Watson 1 .826a .684 .789 .386 1.849 Table 4.14 indicates that the value of the adjusted r squared
R2 amount to 0.789 which is 78.9%. This shows that the factors that are not covered amount only to 20.7%. It therefore means that the four factors have a big role to play on the performance of
[image:12.612.84.534.472.536.2]the procurement function of sugar manufacturing companies in the western sugar belt.
Table 4.15: ANOVA for All Variables
Model Sum of
Squares
df Mean Square F Sig.
1
Regression 1646.01130 4 .410 2.727 .000b Residual 75432.121 5 .149
Total 77078.1323 9 The ANOVA result for all variables indicates that there was a highly significant relationship between the variables at F = 2.727 and P = 0.000. This implies that there is a strong relationship between the four variables and the performance of the procurement function of sugar manufacturing companies in the western sugar belt.
V. SUMMARY,CONCLUSIONSAND RECOMMENDATIONS
5.1 Summary of Major findings
5.1.1 Significance of a lean inventory system
The study found that improving production scheduling can reduce inventory levels using MRP systems. This helps in achieving lean inventory systems to some extent in the sugar manufacturing companies in the western sugar belt thus
improving the performance of the procurement function because it is able to forecast the demand of the raw materials and the consumables.
5.1.2 Strategic supplier partnerships
The study found out that short term relationships with suppliers are adversarial because the procurement function is not keen on frequent communication with the suppliers as well as their appraisal. The poses a challenge to the procurement function of the sugar manufacturing companies when sourcing for suppliers.
5.1.3 Use of Information Technology
management thus improving the performance of the procurement function.
5.1.4 Effect of legal policies
Legal policies help the procurement function of sugar manufacturing companies in the western sugar belt to manage its inventory and improve its performance because it provides a legal framework to adhere to and guidelines on how to undertake the various procurement activities.
5.2 Conclusion of the Study.
The study found that inventory management affects the performance of the procurement function of sugar manufacturing companies in the western sugar belt. Use of a lean inventory system improves the performance of the procurement function. A strategic relationship with suppliers in inventory management is important in the performance of the procurement function. Finally legal policies in the sugar industry contributed to the performance of the procurement function of the sugar manufacturing companies in the western sugar belt.
5.3 Recommendations for the study
The following are recommendations of the study based on the findings.
5.3.1 Significance of a lean inventory system
The sugar manufacturing companies in the western sugar belt should fully adopt lean inventory systems inventory management as this will greatly improve the performance of the procurement function. JIT systems should also be integrated by the sugar manufacturing companies.
5.3.2 Strategic supplier relationships
Long term relationships with suppliers should be sought by the sugar manufacturing companies in the western sugar belt. The companies should also enhance their communication with suppliers by adopting VMI which will ultimately shift the responsibility of inventory management from the procurement function to the suppliers thus improving the performance of the procurement function. Supplier appraisal by the procurement function should be a key element in inventory management as this will help evaluate the suppliers and choose the best from the many and develop long term round table relationships with them.
5.3.3 Use of Information Technology
Sugar manufacturing companies in the western sugar belt should adopt information technology in inventory management. Automation can help the procurement function in stock control by setting stock control levels and calculating the amount of stocks to hold and dispatch thus improving the performance of the procurement function.
5.3.4 Effect of legal policies
The procurement function of the sugar manufacturing companies in the western sugar belt should adhere to the legal policies in place as they will help the procurement function to manage its inventory and improve its performance because of the legal framework that is provided.
5.4 Areas for Further Study
From the recommendations, it is clear that the effect of a lean inventory system, strategic supplier partnerships, information technology and legal policies in inventory management affects the performance of the procurement function of sugar manufacturing companies in the western sugar belt. I suggest the following areas for further study: lean inventory
systems, legal policies in the sugar industry, IT in inventory management, and strategic supplier partnerships.
REFERENCES
[1] Barnes, D. (2001), Research Methods for the Empirical Investigation of the Process of Formation of Operations Strategy. International Journal of Operations & Production Management.
[2] Bicheno, J. (1996). Supplier partnerships. National institute for manufacturing management
[3] Borgatti, S.P. &Foster, P.C. (2003). The Network Paradigm in Organizational Research: A Review and Typology. Journal of Management.
[4] Brownell, J. (2005), Strengthening the Purchase Supplier Partnership. A working paper Cornell University
[5] Carter, R.J., & Price, P.M. (1993). Integrated material management, London: Pitman. International data interchange association
[6] Dobler & Burt. (2006). Purchasing management. (6th Ed.). McGraw hill international Edition.
[7] Douglas M. Lambert, (2006). Supply Chain Management: Processes, Partnerships, Performance, Supply Chain Management Institute.
[8] Goldsby, T., & Martichenko, R. (2005). Lean Six Sigma Logistics: Strategic Development to Operational Success. Boca Raton: J. Ross Publishing, Inc. Government of Kenya, Sugar Act 2001.
[9] Jessop, D., & Morrison, A. (1994). Storage and supply of materials: (6th Ed). London: Financial Times.
[10] Kandampully, J. (2003). B2B Relationships and Networks in the Internet Age, Journal Management Decisions
[11] Kothari, C.R (2008). An introduction to operational Research, New Delhi: Vikas Publishing
[12] Koumanakos, D.P (2008).The effect of inventory management on firm performance International Journal of productivity and performance Management, Vol 57 (pp 355-369). Emerald Group Publication. [13] Loughrin, M. (2008). Lean Thinking and Vendor Managed Inventory. A
working Paper University of Liverpool.
[14] Lenard, J. D., & Roy, B. (1995). Multi-item inventory control: A multi criteria view. European Journal of Operational Research, 87, 685-692. [15] Lyson K (2006). Purchasing and Chartered Institute of Purchasing and
Supply, London: Pitman Publishing
[16] Lysons, K., and Farrington, B., (2012). Purchasing and Supply Chain Management, Prentice Hall. London
[17] Nagurney, A. (2010). Optimal Supply Chain Network Design and Redesign at Minimal Total Cost and with Demand Satisfaction, International Journal of Production Economics.
[18] Patton, J. D., & Steele, R. J. (1990). Service parts handbook. (2nd Ed.). Rego Park (NY): Solomon Press.
[19] Plossl, B. (2005), Management, New York: Prentice Hall Inc.
[20] Schroeder RG 2000. Operations Management- Contemporary Concepts and Cases.USA: International Edition.
[21] Toomey, J. (2000). Inventory Management principles concepts and Techniques, Kluwer Academic Publisher: Boston
[22] Veludo, M.de L., Macbeth, D& Purchase, S. (2006), Framework for Relationships and Networks. Journal of Business & Industrial Marketing
[23] Vigoroso, M. (1999). Buyers Prepare to Brave New World of E-Commerce. Purchasing.
[24] Vohra, .N.D (2008), Quantitative Techniques in Management New Delhi, Tata Mc Graw Hill.
[25] Wagner, M.S., Andreas, E. & Eckhard, L. (2010), Creating and Appropriating Value in Collaborative Relationships, Journal of Business Research.
[26] Womack, J. P., D. T. Jones, and D. Ross, 1990, the Machine that Changed the World. New York: Rawson Associates.
[28] Zanakis, S. H., Austin, L. M., Nowading, D. C., & Silver, E. (1980). From teaching to Implementing inventory management: Problems of translation Interfaces.
AUTHORS
First Author – Cynthia Mito Mukopi, Master of Science in
Procurement and Logistics, Jomo Kenyatta University of Agriculture and Technology.
Second Author – Dr. Amuhaya Mike Iravo, Supervisor, Jomo