Optimization of Process Parameter in Turning of
Copper by Combination of Taguchi and Principal
Component Analysis Method
Chintan Kayastha*, Jaivesh Gandhi**
*Mechanical Department, Sad Vidhyamandal Institute of Engineering and Technology, India **Mechanical Department, Sad Vidhyamandal Institute of Engineering and Technology, India
Abstract- The aim of this article is to optimize the process parameters for turning operation by use of Taguchi and Principal component analysis method. The aim of the present work is to investigate the effects of process parameters on surface finish and material removal rate (MRR) to obtain the optimal setting of these process parameters as product with good finishing surface is desirable in turning process with minimum machining cost.
Index Terms- Optimization, PCA, Surface roughness, Taguchi and Principal Component Analysis Method
I. INTRODUCTION
urface roughness plays important role in heat transfer application and electrical transformation application and copper is used as material for it. In addition copper is widely used for so many applications of electrical, industrial application and medical science. Turning operation is widely used in manufacturing company. For optimization of MRR and Surface roughness PCA method coupled with grey based Taguchi method is implemented as multi response optimization problem cannot solved by other optimization methods
In this method orthogonal array and signal to noise ratio is calculated as Taguchi method and correlation, eigenvalue, principal component and Grey relational coefficient is calculated by PCA methods.
II. LITERATURE REVIEW
In 2012,
Yadav and narang had conclude from ANOVA analysis and Taguchi method for medium carbon steel, parameters making significant effect on surface roughness are feed rate and cutting speed. He shown that with the increase in feed rate the surface roughness also increases & as the cutting speed decreases the surface roughness increases. [1]
In 2008,
H.S Lu et al. had used PCA method for milling of steel and shown that contribution of milling type, spindle speed and feed is totally 79% and radial and axial depth of cut has comparatively less contribution. [2]
In 2010,
Tejender pal sing et al. had used aluminum bar for turning and by mathematical model shown that surface roughness decrease with increase in rack angle. [3]
In 2008,
Mustafa gunay has shown that negative rack angle produces poor surface finish and positive rack angle produce good surface finish with less surface roughness using anova. [4]
In 2010,
Mehmat et al. had used multiple regression and artificial neural network approaches to predict the surface roughness in AISI 1040 steel. The parameters such as cutting speed, feed, and cutting of depth were measured by means of full factorial experimental design. He shown that the feed rate is the dominant factor affecting the surface roughness, followed by depth of cut and cutting speed. The proposed models can be used effectively to predict the surface roughness in turning process. [5]
III. TAGUCHI AND PCA METHOD OVERVIEW
Taguchi Method is developed by Dr. Genichi Taguchi, a Japanese quality management consultant. The method explores the concept of quadratic quality loss function and uses a statistical measure of performance called Signal-to-Noise (S/N) ratio. The S/N ratio takes both the mean and the variability into account. The S/N ratio is the ratio of the mean (Signal) to the standard deviation (Noise). The ratio depends on the quality characteristics of the product/process to be optimized. The standard S/N ratios generally used are as follows: - Nominal is Best (NB), Lower the Better (LB) and Higher the Better (HB), The optimal setting is the parameter combination, which has the highest S/N ratio.
Taguchi’s S/N Ratio for (NB) Nominal-the-best
Taguchi’s S/N Ratio for (LB) Lower-the-better
Taguchi’s S/N Ratio for (HB) Higher-the-better
Principal Component Analysis (PCA), [Su and Tong (1997)] is a way of identifying patterns in the correlated data, and expressing the data in such a way so as to highlight their similarities and differences. The main advantage of PCA is that once the patterns in data have been identified, the data can be compressed, i.e. by reducing the number of dimensions, without much loss of information. The methods involved in PCA are
discussed
below:1. Getting some data 2. Normalization of data
3. Calculation of covariance matrix. 4. Interpretation of covariance matrix.
The normalized data have then been utilized to construct a variance-covariance matrix M , which is illustrated as below:
In which u stands for the number of quality characteristics and p stands for the number of experimental runs. Then, eigenvectors and Eigenvalues of matrix M can be computed, which are denoted by Vj and λj respectively.
It is to be noted that every principal component j ψ represents a certain degree of explanation of the variation of quality characteristics, namely the accountability proportion (AP). When several principal components are accumulated, it increases the accountability proportion of quality characteristics. This is denoted as cumulative accountability proportion (CAP). In the present work, the composite principal component ψ has been defined as the combination of principal components with their individual Eigenvalues. This composite principal component ψ serves as the representative of multi-quality responses, called multi/composite quality indicator. If a quality characteristic Qj strongly dominates in the jth principal component, this principal component becomes the major indicator of such a quality characteristic. It should be noted that one quality indicator may often represent all the multi-quality characteristics. Selection of individual principal components ( ψj ), those to be included in the composite quality indicator ψ , depends on their individual accountability proportion.
multiple- response- process optimization problem into a single response optimization situation, with the objective function is overall grey relational grade. The optimal parametric combination is then evaluated by maximizing the overall grey relational grade.
In grey relational generation, the normalized data corresponding to Lower-the-Better can be expressed as:
Higher-the-better
where xi (k) is the value after the grey relational generation, min yi (k) is the smallest value of yi (k) for the kth response, and max yi (k) is the largest value of yi (k) for the kth response. An ideal sequence is (x)i k for the responses. The purpose of grey relational grade is to reveal the degrees of relation between the sequences (x)i k and (x)j k. The grey relational coefficient ξi (k) can be calculated as
where
is difference of the absolute value x0 k and xi (k) The overall grey relational grade is
IV. PROCEDURE FOR EXPERIMENT
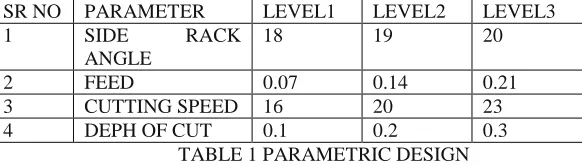
After checking & preparation of the lathe machine the weight of the copper work piece to be measured. After that different le vel parameters (combination of feed, spindle speed, depth of cut and tool angle) are set and turning operation to be carried out. For each experiment MRR and surface roughness to be measured.
SR NO PARAMETER LEVEL1 LEVEL2 LEVEL3
1 SIDE RACK
ANGLE
18 19 20
2 FEED 0.07 0.14 0.21
3 CUTTING SPEED 16 20 23
4 DEPH OF CUT 0.1 0.2 0.3
TABLE 1 PARAMETRIC DESIGN
After measuring the all data for different combination normalizing data set of MRR and surface roughness to be generated. Correlation coefficient is measured between responses. The next step is to find out eighenvalue and eigenvectors for responses.
RUN NO
SIDE RACK ANGLE
FEED CUTTING SPEED
DEPTH OF CUT
INIT. WEIGHT (GRAM)
FINAL WEIGHT (GRAM)
TIME (MIN)
MRR (mm3/ min)
RA (µM)
1 18 0.07 16 0.1 319 226 3.214 110.86 14.97
2 18 0.14 18 0.2 311 293 1.4319 496.29 8.76
3 18 0.21 23 0.3 320 316 0.744 1430.00 6.90
4 19 0.07 18 0.3 313 239 2.869 370.741 12.89
5 19 0.14 23 0.1 316 305 1.116 320.10 9.76
6 19 0.21 16 0.2 318 308 1.082 658.028 5.95
7 20 0.07 23 0.2 317 272 2.232 319.044 10.01
8 20 0.14 16 0.3 305 281 1.623 655.417 7.57
[image:3.612.162.453.425.508.2]9 20 0.21 18 0.1 330 322 0.9566 373.695 3.80
SR NO SURFACE ROUGHNESS MRR
Normal 1.0000 1.0000
1 0.2538 0.0775
2 0.4338 0.3464
3 0.5507 1.0000
4 0.2948 0.2593
5 0.3893 0.2238
6 0.6387 0.4602
7 0.3796 0.2231
8 0.5020 0.4583
[image:4.612.166.447.55.361.2]9 1.0000 0.2613
TABLE 3 NORMALIZING DATA
SR NO CORRELATIO N
COEFFICI ENT
COMMENT
1 MRR & RA 0.251 Correlated TABLE 4 CORRELAION COEFFICIENT
Ψ1 Ψ2
EIGENVALUE 1.251 0.7490000000
EIGENVECTOR 1 -1
1 1
AP 0.6255 0.3745000000
CAP 0.6255 1
TABLE 5 EIENVALUE AND EIGENVECTOR
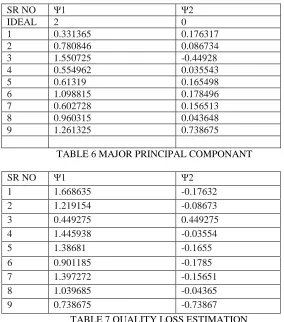
Principal component and quality loss estimation for principal component are calculated also for responses. After finding grey relational coefficient, S/N ratio calculated and based on taguchi method best optimization result is obtained.
SR NO Ψ1 Ψ2
IDEAL 2 0
1 0.331365 0.176317
2 0.780846 0.086734
3 1.550725 -0.44928
4 0.554962 0.035543
5 0.61319 0.165498
6 1.098815 0.178496
7 0.602728 0.156513
8 0.960315 0.043648
9 1.261325 0.738675
TABLE 6 MAJOR PRINCIPAL COMPONANT
SR NO Ψ1 Ψ2
1 1.668635 -0.17632
2 1.219154 -0.08673
3 0.449275 0.449275
4 1.445938 -0.03554
5 1.38681 -0.1655
6 0.901185 -0.1785
7 1.397272 -0.15651
8 1.039685 -0.04365
[image:4.612.165.449.402.724.2]9 0.738675 -0.73867
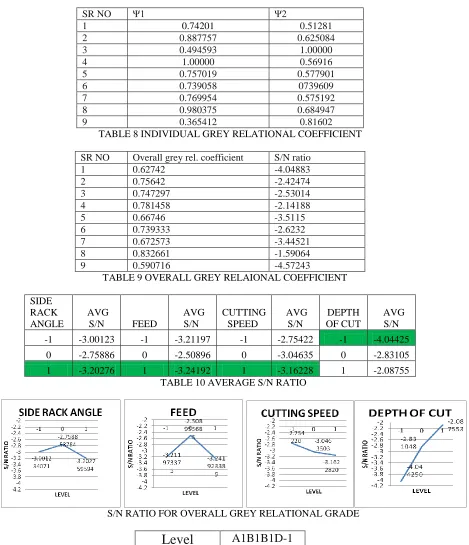
SR NO Ψ1 Ψ2
1 0.74201 0.51281
2 0.887757 0.625084
3 0.494593 1.00000
4 1.00000 0.56916
5 0.757019 0.577901
6 0.739058 0739609
7 0.769954 0.575192
8 0.980375 0.684947
9 0.365412 0.81602
TABLE 8 INDIVIDUAL GREY RELATIONAL COEFFICIENT
SR NO Overall grey rel. coefficient S/N ratio
1 0.62742 -4.04883
2 0.75642 -2.42474
3 0.747297 -2.53014
4 0.781458 -2.14188
5 0.66746 -3.5115
6 0.739333 -2.6232
7 0.672573 -3.44521
8 0.832661 -1.59064
9 0.590716 -4.57243
TABLE 9 OVERALL GREY RELAIONAL COEFFICIENT
SIDE RACK ANGLE
AVG
S/N FEED
AVG S/N
CUTTING SPEED
AVG S/N
DEPTH OF CUT
AVG S/N
-1 -3.00123 -1 -3.21197 -1 -2.75422 -1 -4.04425
0 -2.75886 0 -2.50896 0 -3.04635 0 -2.83105
[image:5.612.86.555.50.595.2]1 -3.20276 1 -3.24192 1 -3.16228 1 -2.08755
TABLE 10 AVERAGE S/N RATIO
S/N RATIO FOR OVERALL GREY RELATIONAL GRADE
Level
A1B1B1D-1
S/N ratio
-3.4128025
TABLE 11 RESULTV. CONCLUSION
The correlation between MRR and Ra is 0.251
Application of PCA has been recommended to eliminate response correlation by converting correlated responses into uncorrelated quality indices called principal components which have been as treated as response variables for optimization.
grey based Taguchi method has been found fruitful for evaluating the optimum parameter setting and solving such a multi-objective optimization problem.
The said approach can be recommended for continuous quality improvement and off-line quality control of a process/product.
REFERENCES
[1] Yadav and narang , “ Experimental Investigation And Optimization Of Machining Parameters For Surface Roughness In CNC Turning By Taguchi Method” International Journal of Engineering Research and Applications (IJERA),2012
[2] H.S.lu, C.K.Chang, N.C. Hawang and C.T.Chung , “Grey relational analysis coupled with principle component analysis for optimization design of the cutting parameters in high speed end milling”, Journal of material processing technology, 2008, pp 3808-3817
[3] Tejendrapal sing et al, “effect of cutting tool parameter on surface roughness” International Journal of Mechanical Engineering and Technology (IJMET),2010 [4] Mustafa gunay , “ investigation of the interaction between the surface quality and rake angle in machining of aisi 1040 steel” Journal of Engineering and Natural
Sciences, 2008
[5] Mehmat , “Modeling and prediction of surface roughness in turning operations using artificial neural network and multiple regression method”, 2010
[6] K.Kadirgama and M.N Noor , “Surface Roughness Prediction Model of 6061-T6 Aluminum Alloy Machining Using Statistical Method” European Journal of Scientific Research, 2009
[7] Sahoo P., Barman T. K. and Routara B. C., “Taguchi based practical dimension modeling and optimization in CNC turning”, Advance in Production Engineering and Management, Volume 3, Number 4, 2003, pp. 205-217
AUTHORS
First Author – Chintan kayastha, M.E Cad Cam, Sad Vidhyamandal Institute of Engineering and Technology
E-mail – [email protected]
Second Author – Jaivesh Gandhi, Assistant Professor, M.E Production Engineering, qualifications, Sad Vidhyamandal Institute of