M E T H O D
Open Access
Comprehensive evaluation of differential gene
expression analysis methods for RNA-seq data
Franck Rapaport
1, Raya Khanin
1, Yupu Liang
1, Mono Pirun
1, Azra Krek
1, Paul Zumbo
2,3, Christopher E Mason
2,3,
Nicholas D Socci
1and Doron Betel
3,4*Abstract
A large number of computational methods have been developed for analyzing differential gene expression in RNA-seq data. We describe a comprehensive evaluation of common methods using the SEQC benchmark dataset and ENCODE data. We consider a number of key features, including normalization, accuracy of differential expression detection and differential expression analysis when one condition has no detectable expression. We find significant differences among the methods, but note that array-based methods adapted to RNA-seq data perform comparably to methods designed for RNA-seq. Our results demonstrate that increasing the number of replicate samples significantly improves detection power over increased sequencing depth.
Background
High-throughput sequencing technology is rapidly becoming the standard method for measuring RNA expression levels (aka RNA-seq) [1]. The advent of rapid sequencing technologies along with reduced costs has enabled detailed profiling of gene expression levels, impacting almost every field in life sciences and is now being adopted for clinical use [2]. RNA-seq technology enables the detailed identification of gene isoforms, translocation events, nucleotide variations and post-tran-scriptional base modifications [3]. One of the main goals of these experiments is to identify the differentially expressed genes in two or more conditions. Such genes are selected based on a combination of expression change threshold and score cutoff, which are usually based onPvalues generated by statistical modeling.
The expression level of each RNA unit is measured by the number of sequenced fragments that map to the transcript, which is expected to correlate directly with its abundance level. This measure is fundamentally dif-ferent from gene probe-based methods, such as microar-rays. In RNA-seq the expression signal of a transcript is limited by the sequencing depth and is dependent on the expression levels of other transcripts, whereas in array-based methods probe intensities are independent
of each other. This, as well as other technical differ-ences, has motivated the development of a growing number of statistical algorithms that implement a vari-ety of approaches for normalization and differential expression (DE) detection. Typical approaches use Pois-son or negative binomial distributions to model the gene count data and a variety of normalization proce-dures (see [4] for a review).
In this comparison study, we evaluated a few of the most commonly used and freely available differential expression software packages: Cuffdiff [5], edgeR [6], DESeq [7], PoissonSeq [8], baySeq [9], and limma [10] adapted for RNA-seq use. We used two benchmark data-sets: the first is the Sequencing Quality Control (SEQC) dataset, which includes replicated samples of the human whole body reference RNA and human brain reference RNA along with RNA spike-in controls. These samples are part of the MAQC study for benchmarking microar-ray technology [11,12] as well as the SEQC effort to char-acterize RNA-seq technology and include close to 1,000 genes that were validated by TaqMan qPCR. The second dataset is RNA-seq data from biological replicates of three cell lines that were characterized as part of the ENCODE project [13]. Our analysis focused on a number of measures that are most relevant for detection of differ-ential gene expression from RNA-seq data: i) normaliza-tion of count data; ii) sensitivity and specificity of DE detection; iii) performance on the subset of genes that are expressed in one condition but have no detectable * Correspondence: [email protected]
3
Institute for Computational Biomedicine, Weill Cornell Medical College, New York, NY, 10021, USA
Full list of author information is available at the end of the article
expression in the other condition and, finally, iv) the effects of reduced sequencing depth and number of repli-cates on the detection of differential expression. Impor-tantly, this evaluation does not address the related and important problem of detecting differential isoform expression and identification of novel transcripts. Rather, the evaluation is restricted to the specific case of detect-ing DE based on unified gene models.
Our results demonstrate substantial differences among the methods both in terms of specificity and sensitivity for the detection of differentially expressed genes. In most benchmarks Cuffdiff performed less favorably with a higher number of false positives without any increase in sensitivity. Our results conclusively demonstrate that the addition of replicate samples provides substantially greater detection power of DE than increased sequence depth. Hence, including more replicate samples in RNA-seq experiments is always to be preferred over increasing the number of sequenced reads.
Theoretical background
A convenient starting point for comparing different RNA-seq analysis methods is a simple count matrixNof
n×mwhereNijis the number of reads assigned to gene
iin sequencing experimentj(that is, read counts). Such matrices can be produced from alignment data using tools such as HTSeq [15], Picard [16], BEDTools [17], featureCounts [18] or Cufflinks [19]. The study presented here does not address the important subtleties when cal-culating gene counts, in particular which gene model to use, how to count reads overlapping intronic regions and the use of ambiguously mapped reads. Rather, the focus is on the comparison between methods given a fixed expression count matrix. For Cuffdiff, which uses a dif-ferent quantitation method that is not compatible with the others, we used its joint method Cufflinks and for all other methods we used HTSeq. It is important to recog-nize that the number of reads which overlap a geneiis not a direct measure of the gene’s expression. Rather the count measure Nij∝liμijwhereμijandli are the expected expression and gene length, respectively. Hence there is a clear length bias when measuring gene expres-sion by RNA-seq [20]. One effect of this bias is to reduce the ability to detect differential expression among shorter genes simply from the lack of coverage since the power of statistical tests involving count data decreases with a lower number of counts [21,22].
Differential gene expression analysis of RNA-seq data generally consists of three components: normalization of counts, parameter estimation of the statistical model and tests for differential expression. In this section we provide a brief background into the approaches implemented by the various algorithms that perform these three steps. We limit our discussion to the most common case of
measuring differential expression between two cellular conditions or phenotypes although some of the packages can test for multi-class differences or multi-factored experiments where multiple biological conditions and different sequencing protocols are included.
Normalization
The first difficulty to address when working with sequen-cing data is the large differences in the number of reads produced between different sequencing runs as well as technical biases introduced by library preparation proto-cols, sequencing platforms and nucleotide compositions [23]. Normalization procedures attempt to account for such differences to facilitate accurate comparisons between sample groups. An intuitive normalization is to divide the gene count simply by the total number of reads in each library, or mapped reads, as first introduced by Mortazaviet al. [1], a normalization procedure named reads per kilobase per million reads (RPKM). A defi-ciency of this approach is that the proportional represen-tation of each gene is dependent on the expression levels of all other genes. Often a small fraction of genes account for large proportions of the sequenced reads and small expression changes in these highly expressed genes will skew the counts of lowly expressed genes under this scheme. This can result in erroneous differential expres-sion [24,25]. A variation of RPKM, termed fragments per kilobase of exon per million mapped reads (FPKM), was introduced by Trapnellet al. to accommodate paired-end reads [19]; however, this has the same limitation of cou-pling changes in expression levels among all genes. DESeq computes a scaling factor for a given sample by computing the median of the ratio, for each gene, of its read count over its geometric mean across all samples. It then uses the assumption that most genes are not DE and uses this median of ratios to obtain the scaling factor associated with this sample. Cuffdiff extends this by first performing intra-condition library scaling and then a sec-ond scaling between csec-onditions. Cuffdiff also attempts to account for changes in isoform levels explicitly by addi-tional transcript-specific normalization that estimates the abundance of each isoform.
Other normalization procedures attempt to use a sub-set of stably expressed genes or to normalize within repli-cated samples to globally adjust library sizes. The trimmed means of M values (TMM) from Robinson and Oshlack [25], which is implemented in edgeR, computes a scaling factor between two experiments by using the weighted average of the subset of genes after excluding genes that exhibit high average read counts and genes that have large differences in expression. Another approach is to sum gene counts up to the upper 25% quantile to normalize library sizes as proposed by Bullard
estimate to define a gene set that is least differentiated between two conditions, which is then used to compute library normalization factors. Quantile normalization ensures that the counts across all samples have the same empirical distribution by sorting the counts from each sample and setting the values to be equal to the quantile mean from all samples [26]. This normalization is widely used in expression arrays and is implemented in the limma package. Recently, a new normalization function termed voom designed specifically for RNA-seq data was added to the limma package. It performs a LOWESS regression to estimate the mean-variance relation and transforms the read counts to the appropriate log form for linear modeling [27].
Statistical modeling of gene expression
If sequencing experiments are considered as random samplings of reads from a fixed pool of genes then a nat-ural representation of gene read counts is the Poisson distribution of the form f(n,λ) = (λne−λ)/n!wherenis the number of read counts andlis a real number equal to the expected number of reads from transcript frag-ments. An important property of the Poisson distribution is that the variance is equal to the mean, which equalsl. However, in reality the variance of gene expression across multiple biological replicates is larger than its mean expression values [28-30]. To address this over-disper-sion problem, methods such as edgeR and DESeq use the related negative binomial distribution (NB) where the relation between the varianceνand meanμis defined as ν=μ+aμ2whereais the dispersion factor.
Estimation of this factor is one of the fundamental dif-ferences between the edgeR and DESeq packages. edgeR estimatesaas a weighted combination of two compo-nents: a gene-specific dispersion effect and a common dispersion effect calculated from all genes. DESeq, on the other hand, breaks the variance estimate into a combina-tion of the Poisson estimate (that is, the mean expression of the gene) and a second term that models the biological expression variability. Cuffdiff computes a separate var-iance model for single-isoform genes and multi-isoform genes. Single-isoform expression variance is computed similarly to DESeq and multi-isoform variance is mod-eled by a mixture model of negative binomials using the beta distribution parameters as mixture weights. baySeq implements a full Bayesian model of negative binomial distributions in which the prior probability parameters are estimated by numerical sampling from the data. Pois-sonSeq models the gene countsNi,jas a Poisson variable in which the meanμi,jof the distribution is represented by the log-linear relationship logμij= logdj+ logbi+
giyjwheredjrepresents the normalized library size,biis the expression level of geneiandgiis the correlation of geneiwith conditionyj(note that in [8] the subscriptsi
andjare samples and genes, respectively). If the expression of geneiis not correlated with the samplejclass (that is, there is no significant difference in genei expression between two conditions) thengiis zero.
Test for differential expression
The estimation of the parameters for the respective statis-tical model is followed by the test for differential expres-sion, the calculation of the significance of change in expression of geneibetween two conditions. Both edgeR and DESeq use a variation of the Fisher exact test adopted for NB distribution; hence, they return exactPvalues computed from the derived probabilities. Cuffdiff uses the test statisticsT=E[log(y)]/Var[log(y)], whereyis the ratio of the normalized counts between two conditions, and this ratio approximately follows a normal distribution; hence, a t-test is used to calculate thePvalue for DE. limma uses a moderated t-statistic to computePvalues in which both the standard error and the degrees of freedom are modi-fied [10]. The standard error is moderated across genes with a shrinkage factor, which effectively borrows informa-tion from all genes to improve the inference on any single gene. The degrees of freedom are also adjusted by a term that represents thea priorinumber of degrees of freedom for the model. The baySeq approach estimates two models for every gene, one assuming no differential expression and a second assuming differential expression using the two sample groups. The posterior likelihood of the model of DE, given the observed data, is used to identify differen-tially expressed genes. In the PoissonSeq method the test for differential expression is simply a test for the signifi-cance of thegiterm (that is, correlation of genei expres-sion with the two conditions), which is evaluated by score statistics. By simulation experiments it was shown that these score statistics follow a chi-squared distribution, which is used to derivePvalues for DE. All methods use standard approaches for multiple hypothesis correction (for example, Benjamini-Hochberg) with the exception of PoissonSeq, which implemented a novel estimation of false discovery rate (FDR) for count data that is based on permutation.
Results and discussion
Assessment of normalized counts by sample clustering and log expression correlation
normalized count values. We expect that normalization will remove variations that are not due to biological dif-ferences and hence the resulting clusters will coincide with biological sources. Indeed, all methods achieved per-fect separation between sample types for both the SEQC and the ENCODE datasets suggesting that all normaliza-tion methods are able to correct for variable sequencing depths (see Figures S1 and S2 in Additional file 1 and see Materials and methods for a description of samples). The Dunn cluster validity index, which measures the ratios of inter-cluster over intra-cluster distances, indicates a higher cluster separation for the SEQC technical replicate datasets (average Dunn index 3.41) relative to ENCODE biological replicates (average Dunn index 1.00), confirm-ing that biological replicates are more variable than tech-nical replicates (Figure S3 in Additional file 1). The log2 distributions of the normalized read counts are similar among most methods with the exception of limmaVoom and Cuffdiff (Figure S4 in Additional file 1), presumably due to the gene-specific normalization approaches by those two methods in contrast to the global scaling that is used by the other methods.
Some normalization methods, such as TMM or the goodness-of-fit estimate, are meant to be used in con-junction with a DE testing method and not for direct comparison between samples. As an additional measure of the accuracy of normalization we correlated the log2 normalized expression changes reported by each method with log expression changes measured by qRT-PCR, which is only available for the MACQ dataset [31]. Since expression changes are unit-less measures (a ratio of two expression values) we expect the changes to be similar in magnitude and in range regardless of the measurement platform. To assess how accurately the methods matched the PCR data, we used root-mean-square deviation (RMSD) to measure the difference in the reported expression changes to the PCR standard. We found that all methods performed well with an average RMSD accu-racy of 1.65 (and Pearson correlation of 0.92) (Figure 1).
Differential expression analysis
We next evaluated the ability of the various methods to detect differentially expressed genes using both the ERCC and TaqMan data. The ERCC data contains a mix-ture of spike-in synthetic oligonucleotides that are mixed into samplesAandBat four mixing ratios: 1/2, 2/3, 1 and 4. It is, therefore, possible to test how well the meth-ods correctly identify these ratios. Using the mixing ratio of 1:1 (log ratio = 0) as the true negative set and all others as true positives, we performed a ROC analysis to compare the performance of the various methods in detecting differentially mixed spike-in controls. Overall, all methods performed reasonably well in detecting the truly differentiated spike-in sequences with an average
area under the curve (AUC) of 0.78 (Figure S5 in Additional file 1).
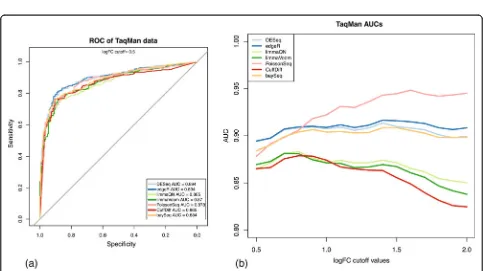
A more comprehensive control group is the set of roughly 1,000 genes whose expression changes were pre-viously measured by qRT-PCR as they span a wider range of expression ratios and represent a sampling of the human transcripts [31]. We performed a ROC analysis using a log2 expression change cutoff of 0.5 (1.4 × expression change measured by qRT-PCR) as the threshold for true differen-tiation. The AUC values at this cutoff indicate comparable performance among all methods with a slight advantage for DESeq and edgeR (Figure 2a). We extended this analysis by measuring AUC at increasing cutoff values of qRT-PCR expression changes, which define sets of differentially expressed genes at increasing stringency (Figure 2b). Here we find a significant performance advantage for negative binomial and Poisson-based approaches with consistent AUC values close to 0.9 or higher in contrast to the Cuff-diff and limma methods, which display decreasing AUC values indicating reduced discrimination power at higher expression change log values.
Null model evaluation of type I errors
A primary goal for any differential expression algorithm is to minimize type I errors, which are incorrect rejections of the null hypothesisH0:μi,A =μi,B, whereμi,A||Bis the mean expression of geneiin conditionAorB, resulting in a false prediction of differential expression (false positive). To test the number of false positive predictions from the null models we performed a series of intra-condition com-parisons using the SEQC technical replicate samples from each condition (see Materials and methods). No genes are expected to be differentially expressed in these compari-sons and the distribution ofPvalues is expected to be uni-form since they are derived from the null model. We note that baySeq was excluded from this analysis since it reports posterior probabilities of a model and notPvalues, which does not allow us to control it with the same strin-gency as other methods. We indeed found that the
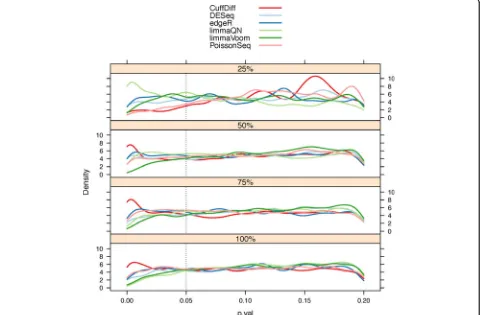
Pvalues for all methods were largely uniform although less so for the lower 25% expressed genes where experimental noise is larger than the expression signal (Figure 3). A noticeable exception was the increase in thePvalues at the lower range (≤0.05) for the Cuffdiff distribution indicating a large number of false positives. A similar observation was noted by Anderset al.: Cuffdiff had an inflated number of false positive predictions in their null model comparison [32]. This trend was even more pronounced when the null model comparison was performed without replicated sam-ples (for example, SampleA1 vs SampleA2, Figure S6 in Additional file 1).
Figure 1RMSD correlation between qRT-PCR and RNA-seq log2expression changes computed by each method. Overall, there is good
concordance between log2values derived from the DE methods and the experimental values derived from qRT-PCR measures. Upper quartile normalization implemented in baySeq package is least correlated with qRT-PCR values. DE, differential expression; RMSD, root-mean-square deviation.
[image:5.595.56.539.431.702.2]from three intra-condition comparisons between repli-cated samples from the same biological condition (see Materials and methods). In total, 16,287, 16,286, 1,620 and 12,139Pvalues were calculated for genes in the 100%, 75%, 50% and 25% read count quartiles, respectively. Hence, every gene has three reportedPvalues from every method representing the three null model comparisons. Note that at the bottom 25% quantile, genes with zero counts were excluded. Although the number of false pre-dictions is below the 5% false discovery rates, the reduced specificity points to inflation of differential expression
detection by Cuffdiff. When the comparison was per-formed with no replicated samples, Cuffdiff’s false discov-ery exceeded 5% where all other methods remained well below this limit.
[image:6.595.59.540.91.406.2]Evaluation of genes expressed in only one condition Almost all RNA-seq experiments include a subset of genes that have no detectable read counts in one of the tested conditions due to very low or lack of expression. In those cases the assessment of differential expression is confounded by the lack of expression signal in one of the
Figure 3Pvalue distributions by gene read count quantiles from null model evaluations. Null model comparison where differential expression (DE) is evaluated between samples from the same condition is expected to generate a uniform distribution ofPvalues. Indeed, theP
value density plots, stratified by read count quartiles, have a uniform distribution. However, at the common significance range of≤0.05 there is a noticeable increase inPvalue densities in Cuffdiff results indicating larger than expected false DE genes. The smoothing bandwidth was fixed at 0.0065 for all density plots and 25% was the lowest gene read count quartile.
Table 1 Number of false differential expression genes predicted by each method at adjustedPvalues (or false discovery rate)≤0.05 separated by gene read count quantiles.
Expression quantile Cuffdiff DESeq edgeR limmaQN limmaVoom PoissonSeq baySeq
100% (high expression) 28 5 3 0 0 7 1
75% 76 6 0 0 0 0 0
50% 84 27 1 2 0 0 0
25% (low expression) 5 9 0 87 0 0 0
[image:6.595.56.539.656.732.2]tested conditions, which can lead to reduced sensitivity (type II error), or more commonly toPvalues that are inconsistent with the expression levels. Ideally, for this subset of genes thePvalues for differential expression should be monotonically correlated with the signal-to-noise ratios in the expressed condition (μ/s, the ratio of the mean over standard deviation) such that higher ratios will be assigned more significantPvalues to reflect the confidence in the expression measurement.
We evaluated this correlation using pair-wise compari-sons among the three ENCODE datasets. We performed an isotonic regression that models the relation between predictor (signal-to-noise) and response (adjusted
Pvalue) variables with the added constraint of maintain-ing a monotonic dependency (that is, ifxi≤xjthenf(xi)≤
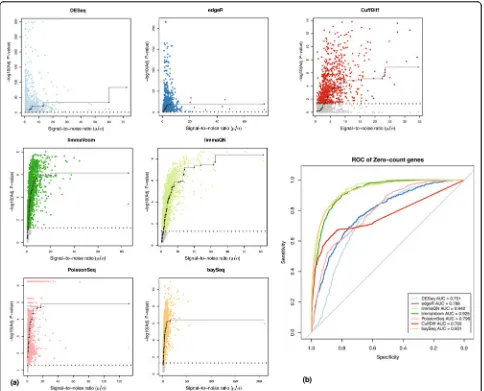
f(xj)). The results clearly show that the limma and baySeq approaches (and to some extent PoissonSeq) exhibit the desired monotonic behavior between the signal-to-noise and confidence in differential expression as measured by adjusted Pvalues whereas DESeq, edgeR and Cuffdiff have poor correlation between these measures (Figure 4). Consistent with the regression analysis, the Kendall-tau rank correlation coefficients also indicate that adjusted
Pvalues for limma and baySeq are best correlated with signal-to-noise (Figure S7 in Additional file 1). Overall, limma and baySeq had the closest correlation between the two variables demonstrating close to ideal modeling. We postulate that for this subset of genes, DESeq and edgeR methods default to a Poisson model, which implies that the variance is equal to the mean. Hence, the P
values are well correlated with the mean expression (data not shown) but there is no correction for wide variations in gene counts among replicate libraries.
Incorrect modeling of differential expression in this sub-set of genes may also result in high levels of false negative or false positive predictions where genes with high signal-to-noise ratios are not identified as differentially expressed or conversely genes with low signal-to-noise are declared to be differentially expressed. Indeed, DESeq and edgeR assign adjustedPvalues of≤0.05 to almost all genes in this dataset regardless of their signal-to-noise values. To measure the sensitivity and specificity we performed a ROC analysis using a signal-to-noise ratio of≥3 as the classification threshold for differential expression (Figure 4b). The AUC values support the regression results that limma and baySeq had a performance advantage over other methods. Cuffdiff showed significantly reduced specificity relative to other methods as indicated by the large number of false negative genes that have significant signal-to-noise ratios but poorPvalues (gray points below the 1.3 line, that is, adjustedPvalues > 0.05, in Figure 4a). This analysis was repeated with the SEQC datasets with similar results (Figure S8 in Additional file 1).
Impact of sequencing depth and number of replicate samples on differential expression detection
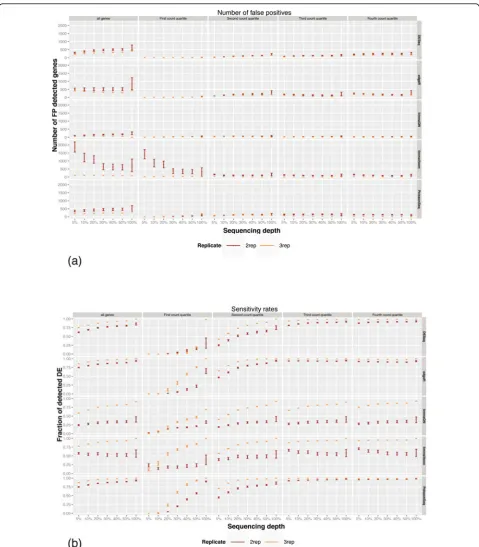
A common challenge when designing RNA-seq experi-ment is to maximize the detection power of the study under a limited budget or sample availability. This has raised a number of practical questions. First, what is the desired sequence depth for reliable detection of differential expression and more broadly what is the detection power at a given depth and number of replicates? Second, given a limited sequencing budget, is it preferable to maximize the sequencing depth or increase the number of replicate sam-ples? Finally, what is the impact of different sequencing depths and varying number of replicates on the perfor-mances of the DE methods? To address these questions we performed a series of comparisons using combinations of subsets of the sequenced reads and samples. We gener-ated a series of down-sampled libraries where a subset of 50%, 40%, 30%, 20%, 10% and 5% reads were randomly sampled from each library (see Materials and methods). We defined the true set of DE genes as the intersection of the DE genes identified by DESeq, edgeR, limmaVoom and baySeq using the full-size libraries and all five repli-cates. We then evaluated DESeq, edgeR, limma and Pois-sonSeq using a decreasing number of replicates and sequence depth, by calculating their: i) sensitivity rates, measured as the fraction of the true set, and ii) false posi-tive (FP) rates, defined as the number of genes identified only by the evaluated algorithm. This analysis was per-formed on both the SEQC technical replicate samples and the ENCODE biological replicate samples.
As expected, all methods had a smaller number of FPs with increasing number of replications and increased sequencing depths although there are noticeable differ-ences between the methods. limmaQN and edgeR had the lowest rates of FPs whereas DESeq had the highest (Figure 5a and Figures S9 to S15 in Additional file 1). Interestingly, false positive calls among the lowest 25% of expressed genes increased with sequencing depth and number of replicates in contrast to the higher expression quartile where the FP rate reduces when more data is provided. However, the total number of FPs is lowest in the bottom 25% expression indicating that all methods are conservative when predicting DE at low expression ranges.
reads. The most striking effect of sequence depth and number of replicates is apparent in lowly counted genes where sensitivity ranges from <10%, when the comparison is performed with 5% of reads and two replications, to 100% detection when the comparison was performed using the all the reads and all replicates. In contrast, for the highly expressed genes there is little gain in sensitivity with increasing sequencing data or measurements. With most methods, over 90% of differentially expressed genes at the top expression levels are detected with little as two repli-cates and 5% of the reads.
Taken together these results lead to two conclusions. First, the number of replicate libraries has a greater effect on DE detection accuracy than sequencing depth. This is
true for both technical and biological replicates. Second, DE detection of lowly expressed genes is most sensitive to the number of reads and replication whereas there is little benefit to increasing sequencing depths for detect-ing DE in highly expressed genes.
Conclusions
[image:8.595.57.541.88.479.2]In this study we performed a detailed comparative analysis of a number of methods for differential expression analysis from RNA-seq data. For the various methods, our com-parison focused on the performance of the normalization, control of false positives, effect of sequencing depth and replication, and on the subset of gene expressed exclu-sively in one condition. In contrast to other approaches,
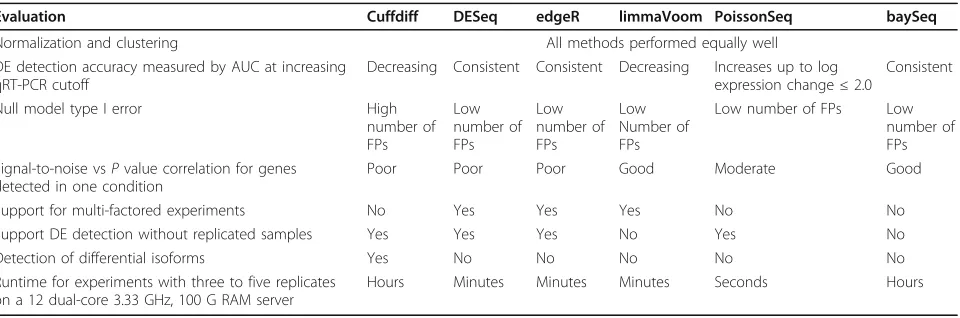
which rely on simulated data generated by specific statisti-cal distribution or limited experimental datasets [23,33,34], we used the SEQC experimental dataset where a large frac-tion of the differentially expressed genes were validated by qRT-PCR and biological replicates from three cell lines profiled by the ENCODE project [13]. Overall, no single method emerged as favorable in all comparisons but it is apparent that methods based on negative binomial model-ing (DESeq, edgeR, and baySeq) have improved specificity and sensitivities as well as good control of false positive errors with comparable performance. However, methods based on other distributions, such as PoissonSeq and limma, compared favorably and have improved modeling of genes expressed in one condition. On the other hand, Cuffdiff has reduced sensitivity and specificity as measured by ROC analysis as well as the significant number of false positives in the null model test. We postulate that this is related to its normalization procedure, which attempts to account for both alternative isoform expression and length of transcripts. Table 2 summarizes the comparison results in addition to a number of additional quality measures, which were not directly evaluated in this study.
Surprisingly, the limma package, which was developed and optimized for expression array analysis, had compar-able, and by some measures improved, performance for both normalization versions tested relative to the other models, which were tailored for RNA-seq analysis. Furthermore, the difference between quantile normaliza-tion or the RNA-seq specific voom funcnormaliza-tion in limma was evident in the number of false DE genes in the null model and in the sensitivity to the sequencing depth and number of replicated samples. limma models the data as a normal distribution, which is a reasonable assumption for array intensities but perhaps counterintuitive for count data since it models discrete data with a con-tinuous distribution. However, it is plausible that in the limit of large counts it is more important to model the
variance accurately than the discreteness. This study demonstrates that for datasets with a large number of genes (or tags), the limma package is well suited for detect-ing DE genes and that modeldetect-ing gene count data as a log normal distribution, with the appropriate pseudo counts, is a reasonable approximation.
[image:10.595.60.540.564.723.2]The results from sequencing depth and replication ana-lysis demonstrate conclusively that the number of sample replicates is the most significant factor in accurate identifi-cation of DE genes [33]. This is not surprising considering that the focus of most methods is to model the variability in gene expression measurements and therefore increasing the number of replicates adds power to this estimate. Since the squared signal-to-noise improves with increased mean expression [35], DE among the highly expressed genes is easily detected even with low sequencing depth and few sample replicates. From a practical point of view, studies focused on detecting DE among lowly expressed genes will benefit significantly from an increased number of replicates. Many additional factors that directly impact the detection of differential expression were not consid-ered in this study such as choice of alignment algorithm, derivation of gene counts, multi-factored studies, detection of alternative transcripts and choice of sequencing plat-form. Cuffdiff, for example, incorporates differential iso-form detection, which is not supported by the simple gene counting methods evaluated here. It is also important to note that the evaluated methods may not be applicable to all types of RNA-seq data. For example, small RNA sequencing is not always amenable to quantile normaliza-tion as performed in this study (data not shown). Similarly, RNA-seq data from cross-linking and immunoprecipita-tion (CLIP) or RIP-seq from RNA-binding proteins are fundamentally different in nature from typical trans-criptome profiling and therefore require specialized mod-els. Finally, the field of high-throughput sequencing is rapidly evolving with new technologies being continuously
Table 2 Comparison of methods.
Evaluation Cuffdiff DESeq edgeR limmaVoom PoissonSeq baySeq
Normalization and clustering All methods performed equally well
DE detection accuracy measured by AUC at increasing qRT-PCR cutoff
Decreasing Consistent Consistent Decreasing Increases up to log expression change≤2.0
Consistent
Null model type I error High
number of FPs
Low number of FPs
Low number of FPs
Low Number of FPs
Low number of FPs Low number of FPs Signal-to-noise vsPvalue correlation for genes
detected in one condition
Poor Poor Poor Good Moderate Good
Support for multi-factored experiments No Yes Yes Yes No No
Support DE detection without replicated samples Yes Yes Yes No Yes No
Detection of differential isoforms Yes No No No No No
Runtime for experiments with three to five replicates on a 12 dual-core 3.33 GHz, 100 G RAM server
Hours Minutes Minutes Minutes Seconds Hours
introduced. These add additional elements of variability to the measurements and will require specific considera-tion [36].
The emergence of RNA-seq as the method of choice for transcriptional profiling has motivated the develop-ment of a growing number of algorithms for normalization and analysis. This comparative study is the first exhaustive comparison of the widely used DE methods on experimen-tal data. It provides important guidelines for evaluating RNA-seq analysis methods and points the direction for future improvements.
Materials and methods Datasets
In this study, we used samples from two sources that were part of the SEQC study, each generated from a mixture of biological sources and a set of synthetic RNAs from the External RNA Control Consortium (ERCC) at known con-centrations. The samples from groupAcontain the Strate-gene Universal Human Reference RNA (UHRR), which is composed of total RNA from ten human cell lines, with 2% by volume of ERCC mix 1. The second group of samplesBcontains Ambion’s Human Brain Reference RNA (HBRR) with 2% by volume of ERCC mix 2. The ERCC spike-in control is a mixture of 92 synthetic polya-denylated oligonucleotides, 250 to 2,000 nucleotides long, which are meant to resemble human transcripts. The two ERCC mixtures in groupsAandBcontain different con-centrations of four subgroups of the synthetic spike-ins such that the log expression change is predefined and can be used to benchmark DE performance (see the Methods section in main SEQC publication). Four replicate libraries from groupsAandBwere prepared by a single technician and a fifth sample was prepared by Illumina for a total of ten libraries. All libraries were sequenced as paired-end 100 bases in the Epigenomics Core facility at Weill Cornell Medical College with a full block design on two flow cells on a single HiSeq2000 instrument (GEO accession GSE49712). We note that these samples are considered technical replicates and therefore represent an idealized scenario of minimal variation.
ENCODE Biological replicate datasets were generated by the ENCODE project [13] and the fastq files were down-loaded [14]. We used replicate libraries from human cell lines GM12892 (three replicates), H1-hESC (four repli-cates) and MCF-7 (three replirepli-cates) sequenced as 75 paired-ends at the CalTech center. To determine whether the ENCODE data adequately represents the variability seen in biological samples we plotted the mean of the nor-malized counts against the variance for the three cell lines (Figure S16 in Additional file 1). The results show that the variance does increase more rapidly than the mean indi-cating that the ENCODE data is indeed over-dispersed
and is a good model for the variability seen in biological replicates.
Sequence alignment and gene counts
All sequenced libraries were mapped to the human gen-ome (hg19) using TopHat(v.2.0.3) [5] with the following parameters:‘-r 70–mate-std-dec 90’. A custom GTF file that includes both RefSeq information (from the UCSC genome browser) and the ERCC transcript information was used (–GTF $SEQCLB/hg19_150_ERCC.gtf) along with the transcriptome index option (– transcriptome-index $SEQCLIB/hg19_150_ERCC). Genes shorter than 150 bp were excluded from this GTF file. HTSeq (v.0.5.3p3) [15] was used to generate the count matrix with the following parameters:‘htseq-count -m intersection-strict -s no’with the same GTF file used for the alignment step ($SEQCLIB/hg19_150_ERCC.gtf).
Normalization and differential expression
With the exception of Cuffdiff, all differential expression analysis was performed using the same gene count matrix output from HTSeq. Analysis followed the procedures and steps described in the package documentation and unless stated otherwise default parameters were used in all function calls. AdjustedPvalues for multiple hypoth-esis corrections were used as calculated by the methods. The following are the details for each package used in this study:
•DESeq (v.1.10.1): The dispersion estimate call to estimateDispersions had parameters:‘ method="per-condition"’and‘fitType="local"’and for null model evaluation with no replicates ‘method="blind"’, ‘ fit-Type="local"’and‘sharingMode="fit-only"’.
•edgeR (v.3.0.2): In the null model comparison with no replicates the common.dispersion value was set to 0.4 as suggested by the documentation.
•PoissonSeq (v.1.1.2): No minimum expression mean was applied and the number of permutations was 500. •baySeq (v.1.12.0): Sequence length correction was added to the normalization as suggested in the docu-mentation. Negative binomial parameter estimation was performed using getPriors.NB using quasi-likeli-hood estimation. Note that baySeq reports posterior probabilities for differences between two models and notPvalues.
sizes were scaled by edgeR normalization factors and the mean-variance trend was calculated using LOWESS regression (known as limmaVoom). Note that limma does not allow contrasting libraries with no replication and therefore limma was excluded from the single library comparisons.
• cuffdiff (v.2.0.0 (3365)) with the options: ‘– no-update-check –emit-count-tables’ and GTF file $SEQCLIB/hg19_150_ERCC.gtf.
For each method, comparisons were performed between the five replicates from sample typeAwith the five repli-cates from type B. In the null model comparison two models were tested, with replication and without replica-tion. In the replication model, replicates from the same samples were contrasted: {A1,A2} vs {A3,A4}, {A1,A2} vs {A3,A4,A5} and {B1,B2} vs {B3,B4}. Comparisons without replication were performed between the following samples:A1 vsA2,A3 vsA4,B1 vsB2 andB3 vsB4.
Sample clustering
Normalized counts were log2transformed after addition of pseudo counts. For counts produced by HTSeq the pseudo counts were set to the smallest non-zero gene count in each library and for FPKM data the pseudo count was set to 0.001. Clustering was performed using the R hclust function with the Euclidean distance measure.
Random sampling and sequencing depth
To assess the effect of a reduced sequencing depth, we used DownsampleSam, a function from Picard [16] that randomly samples read pairs from a SAM file using a uni-form probability. We generated a first set of reduced cover-age depth samples by subsampling every sequence library with a probability ofp1= 0.5 for retaining each read. We then subsampled the resulting files with a probabilityp2= 0.8. Therefore, we generated a set that subsampled the ori-ginal files with a probabilityp1×p2= 0.4 representing 40% sequencing depth. We continued this subsampling cascade, ultimately generating six sets of files with 0.5, 0.4, 0.3, 0.2, 0.1 and 0.05 of the reads sampled from the original files. We then repeated the operation five times, generating five random datasets for each fraction value.
For each subsampled fraction, we used the five indepen-dent samplings to compute differential expression between every combination of subsets of samples (for example, all groups of two samples from conditionAcompared to all groups of two samples from conditionB). We evaluated the DE using DESeq, edgeR, PoissonSeq and limma using the two described modes.
Source code
The source code and data files are available online [37].
Additional material
Additional file 1: Supplementary figures. All the supplementary figures referenced in the main text. 1 Hierarchical clustering of the SEQC libraries from sample A and B . . . 3. 2 Hierarchical clustering of the ENCODE samples ... 4. 3 Dunn clustering validity
index... 5. 4 Normalized read counts ... 6. 5 ROC analysis of ERCC spike-in controls...7. 6 Null model p-values distribution without replicate samples . . . 8. 7 Evaluating monotonic correlation between signal-to-noise and p-values in genes expressed in only one condition ... 9. 8 Correlation of signal-to-noise ratio and DE p-values from SEQC data set . . . 10. 9 Methods performances with reduced sequencing depth and number of replicates for detecting DE between GM12892 and H1-hESC... 11. 10 Methods performances with reduced sequencing depth and number of replicates for detecting DE between H1-hESC and MCF-7... 12. 11 Impact of sequencing depth and number of replicate samples on DE detection by DESeq using SEQC data... 13. 12 Impact of sequencing depth and number of replicate samples on DE detection by edger using SEQC data... 14. 13 Impact of sequencing depth and number of replicate samples on DE detection by limmaQN using SEQC data... 15. 14 Impact of sequencing depth and number of replicate samples on DE detection by limmaVoom using SEQC data... 16. 15 Impact of sequencing depth and number of replicate samples on DE detection by PoissonSeq using SEQC data ... 17. 16 Over-dispersion of the ENCODE dataset ... 18}.
List of abbreviations used
AUC: area under the curve; bp: base pair; CLIP: cross-linking and
immunoprecipitation; DE: differential expression; ERCC: External RNA Control Consortium; FDR: false discovery rate; FP: false positive; FPKM: fragments per kilobase of exon per million mapped reads; HBRR: Human Brain Reference RNA; NB: negative binomial; RMSD: root-mean-square deviation; RPKM: reads per kilobase per million reads; SEQC: Sequencing Quality Control; TMM: trimmed means of M values; UHRR: Universal Human Reference RNA.
Competing interests
The authors declare that they have no competing interests.
Authors’contributions
DB, FR, RK, YL, MP and AK performed the analysis. CEM and PZ performed the sequencing experiments. DB, NDS and RK led the study and DB, FR, NDS and RK wrote the manuscript.
Acknowledgements
DB is supported by grants from the Starr and DeGregorio Family foundations. FR, RK, YL, AK and NDS were supported by MSKCC Comprehensive Cancer Center (P30 CA008748) and by the director of the Sloan-Kettering Institute. Additionally FR is supported by the Susan and Peter Solomon Divisional Genomics Program. RK and NDS are supported by the MSKCC SPORE in Prostate Cancer (P50 CA091629), RK is supported by PO1 Lung (2P01CA129243-06) and NDS is supported by the SPORE in Soft Tissue Sarcoma (P50 CA140146). The authors greatly acknowledge Weill Cornell Epigenomics Core contribution and comments from Nicolas Robine, Jun Li, Tom Hardcastle and Wolfgang Huber.
Authors’details
1Bioinformatics Core, Memorial Sloan-Kettering Cancer Center, New York, NY, 10065, USA.2Department of Physiology and Biophysics, Weill Cornell Medical College, New York, NY, 10021, USA.3Institute for Computational Biomedicine, Weill Cornell Medical College, New York, NY, 10021, USA.4Division of Hematology/Oncology, Department of Medicine, Weill Cornell Medical College, New York, NY, 10021, USA.
References
1. Mortazavi A, Williams BA, McCue K, Schaeffer L, Wold B:Mapping and quantifying mammalian transcriptomes by RNA-Seq.Nat Methods2008, 5:621-8.
2. Berger MF, Levin JZ, Vijayendran K, Sivachenko A, Adiconis X, Maguire J, Johnson LA, Robinson J, Verhaak RG, Sougnez C, Onofrio RC, Ziaugra L, Cibulskis K, Laine E, Barretina J, Winckler W, Fisher DE, Getz G, Meyerson M, Jaffe DB, Gabriel SB, Lander ES, Dummer R, Gnirke A, Nusbaum C, Garraway LA:Integrative analysis of the melanoma transcriptome.
Genome Res2010,20:413-27.
3. Wang Z, Gerstein M, Snyder M:RNA-Seq: a revolutionary tool for transcriptomics.Nat Rev Genet2009,10:57-63.
4. Young MD, McCarthy DJ, Wakefield MJ, Smyth GK, Oshlack A, Robinson MD: Differential expression for RNA sequencing (RNA-Seq) data: mapping, summarization, statistical analysis, and experimental design.In
Bioinformatics for High Throughput Sequencing.Edited by: Rodríguez-Ezpeleta N, Hackenberg M, Aransay AM. New York: Springer; 2012:169-90. 5. Trapnell C, Hendrickson DG, Sauvageau M, Goff L, Rinn JL, Pachter L:
Differential analysis of gene regulation at transcript resolution with RNA-seq.Nat Biotechnol2013,31:46-53.
6. Robinson MD, McCarthy DJ, Smyth GK:edgeR: a Bioconductor package for differential expression analysis of digital gene expression data.
Bioinformatics2010,26:139-40.
7. Anders S, Huber W:Differential expression analysis for sequence count data.Genome Biol2010,11:R106.
8. Li J, Witten DM, Johnstone IM, Tibshirani R:Normalization, testing, and false discovery rate estimation for RNA-sequencing data.Biostatistics
2012,13:523-38.
9. Hardcastle TJ, Kelly KA:baySeq: empirical Bayesian methods for identifying differential expression in sequence count data.BMC Bioinformatics2010,11:422.
10. Smyth GK:Linear models and empirical Bayes methods for assessing differential expression in microarray experiments.Stat Appl Genet Mol Biol
2004,3:Article 3.
11. Shi L, Campbell G, Jones WD, Campagne F, Wen Z, Walker SJ, Su Z, Chu TM, Goodsaid FM, Pusztai L, Shaughnessy JD Jr, Oberthuer A, Thomas RS, Paules RS, Fielden M, Barlogie B, Chen W, Du P, Fischer M, Furlanello C, Gallas BD, Ge X, Megherbi DB, Symmans WF, Wang MD, Zhang J, Bitter H, Brors B, Bushel PR, Bylesjo M,et al:The MicroArray Quality Control (MAQC)-II study of common practices for the development and validation of microarray-based predictive models.Nat Biotechnol2010,28:827-38.
12. MAQC Consortium, Shi L, Reid LH, Jones WD, Shippy R, Warrington JA, Baker SC, Collins PJ, de Longueville F, Kawasaki ES, Lee KY, Luo Y, Sun YA, Willey JC, Setterquist RA, Fischer GM, Tong W, Dragan YP, Dix DJ, Frueh FW, Goodsaid FM, Herman D, Jensen RV, Johnson CD, Lobenhofer EK, Puri RK, Schrf U, Thierry-Mieg J, Wang C, Wilson M,et al:The MicroArray Quality Control (MAQC) project shows inter- and intraplatform reproducibility of gene expression measurements.Nat Biotechnol2006,24:1151-61. 13. Djebali S, Davis CA, Merkel A, Dobin A, Lassmann T, Mortazavi A, Tanzer A,
Lagarde J, Lin W, Schlesinger F, Xue C, Marinov GK, Khatun J, Williams BA, Zaleski C, Rozowsky J, Röder M, Kokocinski F, Abdelhamid RF, Alioto T, Antoshechkin I, Baer MT, Bar NS, Batut P, Bell K, Bell I, Chakrabortty S, Chen X, Chrast J, Curado J,et al:Landscape of transcription in human cells.Nature2012,489:101-8.
14. ENCODE files.[http://hgdownload.cse.ucsc.edu/goldenPath/hg19/ encodeDCC/wgEncodeCaltechRnaSeq/].
15. Anders S:HTSeq: Analysis of high-throughput sequencing data with Python.2011 [http://www-huber.embl.de/users/anders/HTSeq/]. 16. Wysoker A, Tibbetts K, Fennell T:Picard.2012 [http://picard.sourceforge.net/]. 17. Quinlan AR, Hall IM:BEDTools: a flexible suite of utilities for comparing
genomic features.Bioinformatics2010,26:841-2.
18. Liao Y, Smyth GK, Shi W:featureCounts: an efficient general-purpose read summarization program.2013, arXiv preprint arXiv:1305.3347.
19. Trapnell C, Williams BA, Pertea G, Mortazavi A, Kwan G, van Baren MJ, Salzberg SL, Wold BJ, Pachter L:Transcript assembly and quantification by RNA-Seq reveals unannotated transcripts and isoform switching during cell differentiation.Nat Biotechnol2010,28:511-5.
20. Oshlack A, Wakefield MJ:Transcript length bias in RNA-seq data confounds systems biology.Biol Direct2009,4:14.
21. Gail M:Power Computations for Designing Comparative Poisson Trials.
Biometrics1974,30:231-7.
22. Aban IB, Cutter GR, Mavinga N:Inferences and power analysis concerning two negative binomial distributions with an application to MRI lesion counts data.Comput Stat Data Anal2008,53:820-33.
23. Dillies MA, Rau A, Aubert J, Hennequet-Antier C, Jeanmougin M, Servant N, Keime C, Marot G, Castel D, Estelle J, Guernec G, Jagla B, Jouneau L, Laloë D, Le Gall C, Schaëffer B, Le Crom S, Guedj M, Jaffrézic F, on behalf of The French StatOmique Consortium:A comprehensive evaluation of normalization methods for Illumina high-throughput RNA sequencing data analysis.Brief Bioinform2012.
24. Bullard JH, Purdom E, Hansen KD, Dudoit S:Evaluation of statistical methods for normalization and differential expression in mRNA-Seq experiments.BMC Bioinformatics2010,11:94.
25. Robinson MD, Oshlack A:A scaling normalization method for differential expression analysis of RNA-seq data.Genome Biol2010,11:R25. 26. Bolstad BM, Irizarry RA, Astrand M, Speed TP:A comparison of
normalization methods for high density oligonucleotide array data based on variance and bias.Bioinformatics2003,19:185-93. 27. Law CW, Chen Y, Shi W, Smyth GK:Voom! Precision weights unlock linear
model analysis tools for RNA-seq read counts.Technical reportBioinformatics Division, Walter and Eliza Hall Institute of Medical Research, Melbourne, Australia; 2013 [http://www. statsci. org/smyth/pubs/13 5 1-voom-techreport. pdf]. 28. Robinson MD, Smyth GK:Moderated statistical tests for assessing
differences in tag abundance.Bioinformatics2007,23:2881-7. 29. Nagalakshmi U, Wang Z, Waern K, Shou C, Raha D, Gerstein M, Snyder M:
The transcriptional landscape of the yeast genome defined by RNA sequencing.Science2008,320:1344-9.
30. Marioni JC, Mason CE, Mane SM, Stephens M, Gilad Y:RNA-seq: an assessment of technical reproducibility and comparison with gene expression arrays.Genome Res2008,18:1509-17.
31. Canales RD, Luo Y, Willey JC, Austermiller B, Barbacioru CC, Boysen C, Hunkapiller K, Jensen RV, Knight CR, Lee KY, Ma Y, Maqsodi B, Papallo A, Peters EH, Poulter K, Ruppel PL, Samaha RR, Shi L, Yang W, Zhang L, Goodsaid FM:Evaluation of DNA microarray results with quantitative gene expression platforms.Nat Biotechnol2006,24:1115-22.
32. Anders S, Reyes A, Huber W:Detecting differential usage of exons from RNA-seq data.Genome Res2012,22:2008-17.
33. Robles JA, Qureshi SE, Stephen SJ, Wilson SR, Burden CJ, Taylor JM:Efficient experimental design and analysis strategies for the detection of differential expression using RNA-Sequencing.BMC Genomics2012, 13:484.
34. Kvam VM, Liu P, Si Y:A comparison of statistical methods for detecting differentially expressed genes from RNA-seq data.Am J Bot2012, 99:248-56.
35. McCarthy DJ, Chen Y, Smyth GK:Differential expression analysis of multifactor RNA-Seq experiments with respect to biological variation.
Nucleic Acids Res2012,40:4288-97.
36. Saletore Y, Meyer K, Korlach J, Vilfan ID, Jaffrey S, Mason CE:The birth of the epitranscriptome: deciphering the function of RNA modifications.
Genome Biol2012,13:175.
37. soccin.[http://bitbucket.org/soccin/seqc].
doi:10.1186/gb-2013-14-9-r95
Cite this article as:Rapaportet al.:Comprehensive evaluation of
differential gene expression analysis methods for RNA-seq data.Genome