International Journal of Emerging Technology and Advanced Engineering
Website: www.ijetae.com (ISSN 2250-2459, ISO 9001:2008 Certified Journal, Volume 8, Issue 2, February 2018)
162
Application of Regression in the Analysis of Cutting Parameters
for Surface Roughness in Turning
Ankit Tyagi
1, Yashwant Koli
2, Sumit Kumar
31,2
Department of Mechanical Engineering, Delhi Technological University, Delhi110042, India
3Department of Mechanical Engineering, NIT Kurukshetra, Haryana, India
Abstract: This paper focuses on analysis of cutting parameters using regression analysis which is a set of statistical processes for estimating the relationships among variables, is used to analyse surface roughness (SR). A full factorial 27 experiment is engaged to scrutinize the cutting characteristics of mild steel bars using carbide cutting tool. The key objective is to analyze the effect of cutting speed, feed and depth of cut on SR of mild steel in turning operation using carbide tool. The specimen was turned under different level of constraints and the SR was established using a Taylor Hobson’s Surtronic 3+. From the result, it is concluded that higher cutting speed and lower feed produce better surface finish. The optimum cutting constraints were 119.380m/min, 0.04mm/rev and 0.6mm, which produced minimum surface roughness of 1.33μm. According to the non-linear regression equation, the optimum surface Roughness comes out to be 1.35μm which gives the error of 1.5%.
Keywords: Surface roughness (SR), Regression Analysis and Taylor Hobson’s Surtronic 3+.
I. INTRODUCTION
In manufacturing industries, surface finish of a product is vital in defining the quality. Suitable surface finish not only guarantees superiority, but also eases manufacturing cost. Surface finish is vital in terms of tolerances, it eases assembly time and evades the requirement for secondary operation, thus diminishes operation time and leads to overall cost reduction. CNC lathes are capable to produce fast, precision cuts, usually by indexable tools and drills in comparison to normal lathe. They are predominantly effective for complex programs intended to produce parts that would be infeasible to make on normal lathes.
CNC lathes usually have two axes (X and Z), but fresher models have more axes, letting for more innovative jobs to be machined by frequent interpretation of G-code as well as the manufacturer's exclusive programming language. CNC’s are extremely versatile and allow you to cut an array of different types of product and materials. The exact capacities of a machine will vary with size, inflexibility and power. CNC machines offer many advantages in
manufacturing like higher flexibility, increased
productivity, improved quality, reduced scrap rate, reliable and safe operation.
SR also affects numerous functional qualities of parts, such as wearing, heat transmission, and facility of sustaining a lubricant, coating and resisting fatigue.
Commonly known model to establish the SR is Ra = f2/32r,
where f is the feed rate and r is the nose radius. Undoubtedly, feed rate and nose radius influence SR the most [1][2].
There were two purposes of this research. First was to exhibit an organized method of operating Taguchi parameter design. The second was to exhibit a use of the Taguchi parameter design in order to recognize the optimum SR performance with a certain grouping of cutting parameters in a turning operation.
II. LITERATURE REVIEW
International Journal of Emerging Technology and Advanced Engineering
Website: www.ijetae.com (ISSN 2250-2459, ISO 9001:2008 Certified Journal, Volume 8, Issue 2, February 2018)
163
Günay.M et al. [10], focused on optimizing the cutting conditions for the average surface roughness (Ra) obtained in machining of high-alloy white cast iron (Ni-Hard) at two different hardness levels (50 HRC and 62 HRC). N.R. Abburi et al. [11] develops a knowledge-based system for the prediction of surface roughness in turning process. Janez Kopac et al. [12] focuses on optimising the turning of raw workpieces of low-carbon steel with low cold pre-deformation to achieve acceptable surface roughness.
P.V.S. Suresh et al. [13], The experimentation was carried out with TiN-coated tungsten carbide (CNMG) cutting tools, for machining mild steel work-pieces covering a wide range of machining conditions. W.S. Lin et al. [14], an abductive network is adopted to construct a prediction model for surface roughness and cutting force. M.Y. Noordin et al. [15], The performance of a multilayer tungsten carbide tool was described using response surface methodology (RSM) when turning AISI 1045 steel. D.I. Lalwani et al. [16], In the present study, an attempt has been made to investigate the effect of cutting parameters (cutting speed, feed rate and depth of cut) on cutting forces (feed force, thrust force and cutting force) and surface roughness in finish hard turning of MDN250 steel [equivalent to 18Ni(250) maraging steel] using coated ceramic tool. Davim. J et al. [17], presents a study of the influence of cutting parameters on surface roughness in turning of glass-fibre-reinforced plastics (GFRPs). Dilbag Singh et al. [18], An experimental investigation was conducted to determine the effects of cutting conditions and tool geometry on the surface roughness in the finish hard turning of the bearing steel (AISI 52100). Ahmet Hasçalhk et al. [19], the effect and optimization of machining parameters on surface roughness and tool life in a turning operation was investigated by using the Taguchi method. The experimental studies were conducted under varying cutting speeds, feed rates, and depths of cut. An orthogonal array, the signal-to-noise (S/N) ratio, and the analysis of variance (ANOVA) were employed to the study the performance characteristics in the turning of commercial Ti-6Al-4V alloy using CNMG 120408-883 insert cutting tools.
Vishal S. Sharma et al. [20], machining variables such as cutting forces and surface roughness are measured during turning at different cutting parameters such as approaching angle, speed, feed and depth of cut. Hardeep Singh et al. [21], an experimental study to investigate the effects of cutting parameters like spindle speed, feed and depth of cut on surface finish and material removal rate on EN-8. Thomas M. et al. [22], focus of this study is the collection and analysis of surface roughness and tool vibration data generated by lathe dry turning of mild carbon steel samples at different levels of speed, feed, depth of cut, tool nose radius, tool length and workpiece length. Ranganath M.S. et al. [23], investigates the parameters affecting the roughness of surfaces produced during the turning process for the material Aluminium 6061. Ranganath M.S. et al. [24], MOTIF-method is a system for the evaluation of the primary profile and based on the envelope system and is suitable as an alternative to the mean line system. The specimen was turned under different levels and R, Rx and Ar values were analysed.
III. EXPERIMENTAL PROCEDURE
Experiment was conducted on a LL20TL3 CNC lathe with work piece of 38 mm diameter and 300 mm long mounted between 3-jaw chuck and tailstock. Initially rough turning is done on CNC to remove scaling that is present on the surface of mild steel. The full factorial 27 experiments were performed according to the Taguchi Design of experiment and surface is gauged by using instrument Surtronic 3+.With the aid of Minitab software, Regression Analysis is applied and results are obtained.
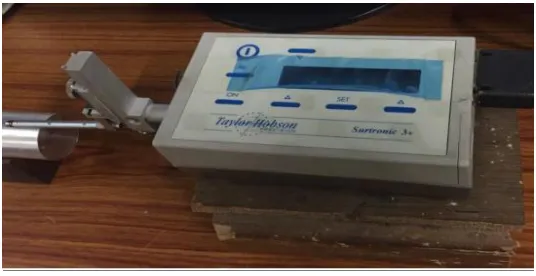
3.1 Surface Roughness Measuring Instrument
The Surtronic 3+ is a movable, self-contained for the measurement of surface texture and is appropriate for use in both the workshop and laboratory. Parameters accessible for surface texture evaluation are: Ra, Rq, Rz (DIN), Ry and Sm. The instrument is normally powered by an alkaline
non-rechargeable battery. If preferred, a Ni-Cad
International Journal of Emerging Technology and Advanced Engineering
Website: www.ijetae.com (ISSN 2250-2459, ISO 9001:2008 Certified Journal, Volume 8, Issue 2, February 2018)
[image:3.612.163.431.134.272.2]164
Fig: 1 Surface roughness measurement apparatus
Table 1.
Cutting Parameters and their levels
Symbol Cutting Parameters
Units Level 1 Level 2 Level 3
A Speed (s) m
min-1
71.628 95.504 119.380
B Feed (f) mm
rev-1
0.04 0.14 0.24
C Depth
of Cut (d)
mm 0.2 0.4 0.6
[image:3.612.17.596.456.726.2]IV. ANALYSIS AND DISCUSSION
Table 2.
Regression Analysis for Surface Roughness
S.No. Log S Log d Log f Log Ra Residual Fits
1. 1.855082825 -0.698970004 -1.397940009 0.232996 -0.063812 0.296808
2. 1.855082825 -0.698970004 -0.853871964 0.690196 0.074377 0.615819
3. 1.855082825 -0.698970004 -0.619788758 0.769377 0.016305 0.753072
4. 1.855082825 -0.397940009 -1.397940009 0.161368 -0.099211 0.260579
5. 1.855082825 -0.397940009 -0.853871964 0.499687 -0.079902 0.579589
6. 1.855082825 -0.397940009 -0.619788758 0.686636 -0.030206 0.716842
7. 1.855082825 -0.22184875 -1.397940009 0.290035 0.050649 0.239386
8. 1.855082825 -0.22184875 -0.853871964 0.698101 0.139704 0.558396
9. 1.855082825 -0.22184875 -0.619788758 0.640481 -0.055168 0.695649
10. 1.980021562 -0.698970004 -1.397940009 0.181844 -0.055161 0.237005
11. 1.980021562 -0.698970004 -0.853871964 0.636488 0.080473 0.556015
12. 1.980021562 -0.698970004 -0.619788758 0.681241 -0.012027 0.693268
13. 1.980021562 -0.397940009 -1.397940009 -0.01457 -0.215348 0.200775
International Journal of Emerging Technology and Advanced Engineering
Website: www.ijetae.com (ISSN 2250-2459, ISO 9001:2008 Certified Journal, Volume 8, Issue 2, February 2018)
165
15. 1.980021562 -0.397940009 -0.619788758 0.665581 0.008543 0.657038
16. 1.980021562 -0.22184875 -1.397940009 0.33646 0.156878 0.179582
17. 1.980021562 -0.22184875 -0.853871964 0.450249 -0.048343 0.498592
18. 1.980021562 -0.22184875 -0.619788758 0.592177 -0.043669 0.635845
19. 2.076931575 -0.698970004 -1.397940009 0.206826 0.016209 0.190617
20. 2.076931575 -0.698970004 -0.853871964 0.606381 0.096754 0.509628
21. 2.076931575 -0.698970004 -0.619788758 0.541579 -0.105301 0.646881
22. 2.076931575 -0.397940009 -1.397940009 0.227887 0.073499 0.154387
23. 2.076931575 -0.397940009 -0.853871964 0.522444 0.049046 0.473398
24. 2.076931575 -0.397940009 -0.619788758 0.537819 -0.072832 0.610651
25. 2.076931575 -0.22184875 -1.397940009 0.123852 -0.009343 0.133194
26. 2.076931575 -0.22184875 -0.853871964 0.38739 -0.064815 0.452205
27. 2.076931575 -0.22184875 -0.619788758 0.545307 -0.044151 0.589458
4.1 Graphs from MiniTab for Regression Analysis
i. Normal probability plot of Residuals for Log Ra
The points in this plot generally form a straight line if the residuals are normally distributed. If the points on the plot depart from a straight line, the normality assumption may be invalid. As in this project work data have less than 50 observations, the plot may show bend in the tails even if the residuals are normally distributed. As the number of observations drops, the probability plot may show substantial difference and nonlinearity even if the residuals are normally distributed.
ii. Residuals vs Fits for Log Ra
This plot displays a random pattern of residuals on both sides of 0. If a point lies distant from the majority of points, it may be an outlier. Also, there should not be any familiar patterns in the residual plot. The following may show error that is not random:
a series of increasing or decreasing points
a majority of positive residuals, or a majority of negative
residuals
International Journal of Emerging Technology and Advanced Engineering
Website: www.ijetae.com (ISSN 2250-2459, ISO 9001:2008 Certified Journal, Volume 8, Issue 2, February 2018)
166
It can be concluded that all the values are within the control range, indicating that there is no obvious pattern and unusual structure.
iii. Residual Histogram for Log Ra
Long tails in the plot may indicate skewness in the data. If one or two bars are far from the others, those points may be outliers because the appearance of the histogram changes depending on the number of intervals used to group the data.
iv. Residuals vs Order for Log Ra
This is a plot of all residuals in the order that the data was collected and can be used to find non-random error, especially of time-related effects.
A positive correlation is indicated by a clustering of residuals with the same sign and a negative correlation is indicated by rapid changes in the signs of consecutive residuals.
0.2 0.1
0.0 -0.1
-0.2 9 8 7 6 5 4 3 2 1 0
Residual
Fr
eq
ue
nc
y
International Journal of Emerging Technology and Advanced Engineering
Website: www.ijetae.com (ISSN 2250-2459, ISO 9001:2008 Certified Journal, Volume 8, Issue 2, February 2018)
167
From above graphs, it can be concluded that all the values are within the control range, indicating that there is no obvious pattern and unusual structure and also the residual analysis does not indicate any model inadequacy. Hence these values yield better results in future predictions.
4.2 Non-Linear Regression Equation
Log Ra = 1.920 - 0.479 Log S - 0.1204 Log d + 0.5863 Log f
International Journal of Emerging Technology and Advanced Engineering
Website: www.ijetae.com (ISSN 2250-2459, ISO 9001:2008 Certified Journal, Volume 8, Issue 2, February 2018)
[image:7.612.25.593.160.716.2]168
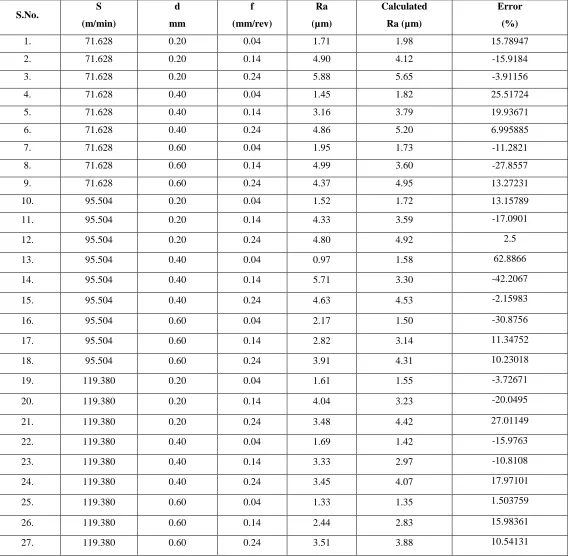
Table 3.
Calculated Surface Roughness from Regression Equation
S.No. S
(m/min)
d
mm
f
(mm/rev)
Ra
(µm)
Calculated
Ra (µm)
Error
(%)
1. 71.628 0.20 0.04 1.71 1.98 15.78947
2. 71.628 0.20 0.14 4.90 4.12 -15.9184
3. 71.628 0.20 0.24 5.88 5.65 -3.91156
4. 71.628 0.40 0.04 1.45 1.82 25.51724
5. 71.628 0.40 0.14 3.16 3.79 19.93671
6. 71.628 0.40 0.24 4.86 5.20 6.995885
7. 71.628 0.60 0.04 1.95 1.73 -11.2821
8. 71.628 0.60 0.14 4.99 3.60 -27.8557
9. 71.628 0.60 0.24 4.37 4.95 13.27231
10. 95.504 0.20 0.04 1.52 1.72 13.15789
11. 95.504 0.20 0.14 4.33 3.59 -17.0901
12. 95.504 0.20 0.24 4.80 4.92 2.5
13. 95.504 0.40 0.04 0.97 1.58 62.8866
14. 95.504 0.40 0.14 5.71 3.30 -42.2067
15. 95.504 0.40 0.24 4.63 4.53 -2.15983
16. 95.504 0.60 0.04 2.17 1.50 -30.8756
17. 95.504 0.60 0.14 2.82 3.14 11.34752
18. 95.504 0.60 0.24 3.91 4.31 10.23018
19. 119.380 0.20 0.04 1.61 1.55 -3.72671
20. 119.380 0.20 0.14 4.04 3.23 -20.0495
21. 119.380 0.20 0.24 3.48 4.42 27.01149
22. 119.380 0.40 0.04 1.69 1.42 -15.9763
23. 119.380 0.40 0.14 3.33 2.97 -10.8108
24. 119.380 0.40 0.24 3.45 4.07 17.97101
25. 119.380 0.60 0.04 1.33 1.35 1.503759
26. 119.380 0.60 0.14 2.44 2.83 15.98361
International Journal of Emerging Technology and Advanced Engineering
Website: www.ijetae.com (ISSN 2250-2459, ISO 9001:2008 Certified Journal, Volume 8, Issue 2, February 2018)
169
From Table 3, it can be concluded that the optimum combination process parameters for minimum SR is obtained at speed 119.380m/min (1000rpm), feed 0.04mm/rev and depth of cut 0.6mm which gives 1.33µm surface roughness.
V. CONCLUSION
The following conclusions can be drawn based on the experimental results:
From the help of non-linear regression equation it can be
stated that, at lower value of speed and depth of cut the surface roughness value increases, whereas at lower value of feed rate the surface roughness decreases.
In turning, use of higher speed (119.380 m/min), low
feed rate (0.04 mm/rev) and high depth of cut (0.6 mm) are proposed to attain superior surface roughness for the particular test range.
According to the non-linear regression equation, the
optimum surface Roughness comes out to be 1.35μm at speed (119.380m/min), feed (0.04mm/rev) and depth of cut (0.6mm) which gives the error of 1.5%.
REFERENCES
[1] Upadhyay.V, P.K. Jain, N.K. Mehta; (2013) In-process estimate of roughness in turning of Ti–6Al–4V alloy using cutting constraints and vibration signals: Measurement 46 pp.154–160.
[2] Tugrul Ozel, Yigit Karpat; (2005) Extrapolative modeling of roughness and tool wear in hard turning using regression and neural networks: International Journal of Machine Tools & Manufacture 45 pp.467–479.
[3] Davim. J , V.N. Gaitonde, S.R. Karnik; (2008) Inquiries into the effect of cutting circumstances on roughness in turning of free machining steel by ANN models: journal of materials administering technology 2 0 5 pp.16–23.
[4] I.A. Choudhury, M.A. EI-Baradie; (1997) Rroughness estimate in the turning of high-strength steel by factorial design of tests: Journal of Materials Processing Technology 67 pp.55-61.
[5] W.H. Yang, Y.S. Tarng; (1998) Strategy optimization of cutting constraints for turning operations based on the Taguchi method: Journal of Materials Processing Technology 84 pp.122–129. [6] M. Nalbant, H. Gokkaya, G. Sur; (2007) Presentation of Taguchi
hmetod in the optimization of cutting parameters for roughness in turning: Materials and Design 28 pp.1379–1385.
[7] Ilhan Asilturk, Harun Akkus; (2011) Determining the effect of cutting constraint on roughness in hard turning using the Taguchi method: Measurement 44 pp.1697–1704.
[8] Hamdi Aouici, Mohamed Athmane Yallese, Kamel Chaoui, Tarek Mabrouki, Jean-François Rigal; (2012) Exploration of roughness and cutting force elements in hard turning with CBN tool: Prediction model and cutting conditions optimization: Measurement 45 pp.344– 353.
[9] S. Ramesh, L. Karunamoorthy, K. Palanikumar; (2012) Dimension and investigation of roughness in turning of aerospace titanium alloy (gr5): Measurement 45 pp.1266–1276.
[10] Günay.M, Emre Yücel; (2013) Usage of Taguchi method for determining ideal roughness in turning of high-alloy white cast iron: Measurement 46 pp.913–919
[11] N.R. Abburi, U.S. Dixit; (2006) A data -based system for the calculation of surface roughness in turning operation: Robotics and Computer-Integrated Manufacturing 22 pp.363–372.
[12] Janez Kopac, Marko Bahor, Mirko Sokovic ; (2002) Finest machining constraints for attaining the desired roughness in fine turning of cold pre-formed steel workpieces: International Journal of Machine Tools & Manufacture 42 pp.707–716.
[13] P.V.S. Suresh e, P. Venkateswara Rao, S.G. Deshmukh; (2002) A genetic algorithmic method for optimization of surface roughness estimate model: International Journal of Machine Tools & Manufacture 42 pp.675–680.
[14] W.S. Lin, B.Y. Lee, and C.L. Wu; (2001) demonstrating the roughness and cutting force for turning: Journal of Materials Processing Technology 108 pp.286-293.
[15] M.Y. Noordin, V.C. Venkatesh, S. Sharif, S. Elting, A. Abdullah; (2004) predicted the performance of coated carbide tools when turning of AISI 1045 steel: Journal of Materials Processing Technology 145 pp.46–58.
[16] D.I. Lalwani, N.K. Mehta, P.K. Jain; (2008) Experimental investigations of and influence on cutting forces and roughness in finish hard turning of MDN250 steel: journal of materials processing technology 2 0 6 pp.167–179.
[17] Davim. J, Francisco Mata; ( 2004 ) Impact of cutting constraints on roughness in turning glass-fiber- strengthened plastics using geometric analysis: Industrial Lubrication and Tribology Volume 56 Number 5 pp. 270–274.
[18] Dilbag Singh, P. Venkateswara Rao; (2007) A roughness evaluation model for hard turning process: Int J Adv Manuf Technol 32: pp.1115–1124.
[19] Ahmet Hasçahk, Ulaş Çaydaş; (2008) Optimization of turning constraints for roughness and tool life centered on the Taguchi method: Int J Adv Manuf Technol 38: pp.896–903.
[20] Vishal S. Sharma , Suresh Dhiman, Rakesh Sehgal, S. K. Sharma; (2008) Assessment of cutting forces and roughness for hard turning using neural networks: J Intell Manuf 19: pp.473–483.
[21] Hardeep Singh, Rajesh Khanna, M.P. Garg; (2011) Consequence of Cutting Constraints on MRR and Roughness in Turning EN-8: Current Developments in Engineering Research Vol.1, No.1. [22] Thomas M., Beauchamp Y., Youssef A.Y., Masounave J; (1996)
Consequence of tool shakings on roughness during lathe dry turning process: Computers ind. Engng, Vol 31, No. 3/4, pp. 637 – 644. [23] Ranganath M. S., Vipin, R. S. Mishra, Prateek; (2015) Optimization
of surface roughness in CNC turning of Aluminium 6061 using Taguchi Techniqques: International Journal of Modern Engineering Research (IJMER): vol 5; pp. 1-9.