International Journal of Emerging Technology and Advanced Engineering
Website: www.ijetae.com (ISSN 2250-2459, ISO 9001:2008 Certified Journal, Volume 7, Issue 7, July 2017)
427
Sensor Placement Based on Static Finite Element Data of Cable
Stayed Bridge
Mohammed Idris Mohammed
1,
Erwin Sulaeman
2,
Faizal Mustapha
3, Mohd Khairol A. Mohd Ariffin
4 1,3Department of Aerospace Engineering, Faculty of Engineering, University Putra Malaysia, 43400 UPM Serdang, Selangor, Malaysia
2Department of Mechanical Engineering, Faculty of Engineering, International Islamic University Malaysia, 53100 Kuala
Lumpur, Malaysia
4
Department of Mechanical Engineering, Faculty of Engineering, University Putra Malaysia, 43400 UPM Serdang, Selangor, Malaysia
Abstract - Bridges are essential great value infrastructure which provide services for a long period of time. Their age increases over the time so as the complexity of its operating and maintaining activities. The present study is considering cable stayed Penang (I) bridge in Malaysia which has 440 m spans long. Hence, the paper initially aims to propose location of sensors based on a dead load condition. A finite element i.e. static analysis is used to identify the critical grid points at the bridge’s members. The study recommended 18 places of sensors, which are located at the spans, cables and piers of the bridge.
Keywords- cable stayed bridge, structural health monitoring, sensors placements, dead load.
I. INTRODUCTION
Bridges demand for regular inspection to serve its purpose until the life cycle are then replaced. Normally, they are subjected with heavy loading, global weather condition which frequently lead to cracks, corrosion of members, wearing of components during their operating period. In the past, small-scale bridge structures were normally maintained based on the observation and assessment methods of visual inspection in identifying the damages or changes in structure. However, such techniques are significant for outward or surface bridge appearance despite of time consuming and expensive [1-3]. As a result of continuous research on construction of longest and complex bridges, these led to the introduction of advanced technologies to evaluate the bridges, which is known as Structural health monitoring (SHM) [4-8].
The method has become vital system in maintaining and ensure safety of civil infrastructures. It is worthy to evolve early warning system to detect damage ahead of time [9-11]. Such that [12] indicated if monitoring technologies are properly implemented, then the useful life of bridges would be extended by allowing damages to be identified earlier and thereby, allowing relative minor correction actions to be taken before deterioration grows to the state where major actions are required.
Many diversity researches conducted on cable stayed bridges such as, [13], the authors proposed the use of Newton-Raphson approach for analyzing target configuration of cable - supported structures (TCUD) at dead load state. The TCUD analysis procedure was based on incremental equilibrium equation. Their study assessed the displacement, compressive forces on the bending stiffness at the deck, pylons and tension forces at cables. They revealed the method used was able to led to the satisfactory results. However, [15] conducted static field load test at longest cable stayed bridge in Taiwan, which aims to evaluate the deflection and forces at the main girder. The structural responses resulted linear superposition attribute.
On the other hand, Freire et al., (2006) investigated the nonlinear effects of steel Cable stayed bridge using geometrical or algorithms technique. Finite element was applied at the dead load condition. The analysis found that the large displacement causes low stresses at cables although the effect intensifying cable sage effect. Meanwhile, [16] expressed the significant of bridge modeling to assess a bridge status for maintenance.
The project referred to the errors encountered from modeling such as simplified assumption, lack of knowledge to boundary and loading conditions. Also, the authors implied that a bridge instrumented with an array of sensors is helpful to validate the modeling and capture the bridge behavior so that structure health monitoring (SHM) system is developed accordingly. The approach is substantially effective if applied at early stages. Similarly, [17] demonstrated that numerical analysis of finite element, which are vital and significant to determine the respond deflections of the bridge so that sensors layout can be proposed or established.
International Journal of Emerging Technology and Advanced Engineering
Website: www.ijetae.com (ISSN 2250-2459, ISO 9001:2008 Certified Journal, Volume 7, Issue 7, July 2017)
428
The results showed each cable failure have different dynamic response characteristics and the parameters of displacement as well as stresses would estimate which member of the structure was inactive. Eventually, [19-20] highlighted by implementing of sensors, this would lead to limiting the inspections activities, coupled with geometrical complicity of the structure in attribute to the location and size of the afflict stress /damage hidden in the bridge.
Thus, in relation to the study, the Penang (I) bridge is considered for the investigation. The structure was completed in 1985. The bridge links the Malaysia mainland with Island of Penang. The study aims to verify the number and placement of sensors at dead load condition so that further analysis at loading state could be explored. This type of bridge known to be aesthetically appealing, constructed with long spans, technically innovative, economical and structurally sound. Their behavior becoming more complex compounded with its fundamental characteristics such as cables forces, stability and stiffness have become vital issues to assess their safety performance [21].
II. METHOD
2.1 Brief Description of Penang (I) Bridge Geometry
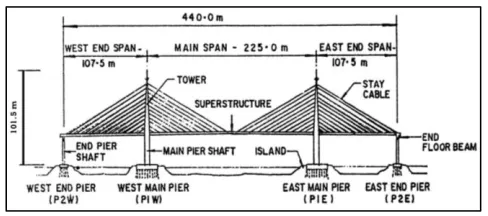
[image:2.612.328.563.135.279.2]Penang (I) bridge is a harp configuration cable-stayed with concrete girder structure as portrayed in Figure 1[22]. Its spans length in total is 440 m, where two end side spans of 107.5m and the main span of 225.0 m long. The bridge’s four towers are of 101.5 m long. The deck cross section with edge girder is 29.7 m long while the 6 lanes occupy 24.70 m width. The deck is carried by 148 stayed cables of various length from 14 m to 125 m. The harp cables arrangement is consisted of 12 pairs carrying the end side span and 11 single cables carrying each side of the main span. The superstructure comprises of 98 edge girder segments and 147 floor beams with deck slab segments [23].
Figure 1: view of Penang bridge in Malaysia
(source: Hendy, C. R. Highway &Transport Atkin)
Figure 2: Penang bridge structural geometry.
2.2 Penang Bridge Finite Element Model
[image:2.612.322.566.313.421.2]International Journal of Emerging Technology and Advanced Engineering
Website: www.ijetae.com (ISSN 2250-2459, ISO 9001:2008 Certified Journal, Volume 7, Issue 7, July 2017)
429
[image:3.612.49.293.222.311.2]Convergence technique was carried out to reduce discrepancy and increase accuracy of the modal analysis such that the number of grid becomes 2514 points, CBAR 1287 elements, the CQUAD4 1528 elements and CROD 144 elements. The study mainly focuses on displacements and stresses due to high impact at the structure and at the end critical grid points can be identified.
[image:3.612.49.295.323.518.2]Figure 3. One section of bridge model (source: Chin,1988)
Figure 4. Bridge model sections.
Figure 5. Bridge four sections and traffic flow directions.
III. RESULTS AND DISCUSSION
Generally, the dead load of a bridge is associated to superstructure self-weight, which known as gravity load due to structural elements of the bridge, such as the deck weight and the associated wearing surface, curbs, sidewalks, including the floor beams and stringers. In this case, partial of the cable weight is computed, as well as the dead load which included the superimposed weight of road lighting rods, utility pipes, electrical and phone cables which are normally carried underneath the deck or on the side along the girder edge. The study proposed the middle point (center) of the bridge main span of (0.0) m.
In this respect, the grid points at the left side of the bridge named section (I) and (III) was assumed to be negative, whereas, the right half of the structure was presumed i.e. section (II) and (IV) positive grid points.
3.1 Displacements Deflection of Penang Bridge at Dead Load Case
The bridge model displacements consist of 6 components for each grid point. The study selected one component in translational direction and another component from rotational direction.
3.1.1 Translational Displacement at Dead Load Case
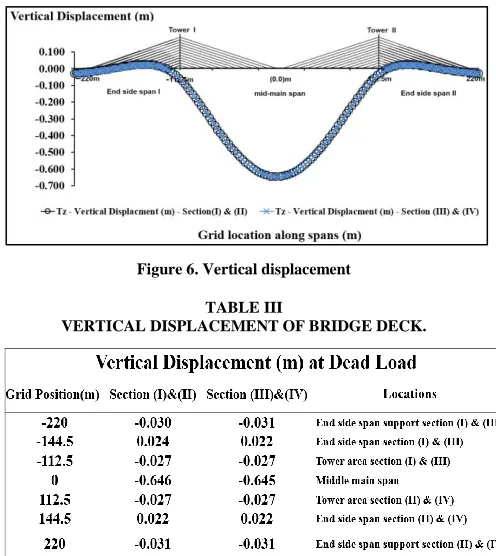
[image:3.612.322.570.341.619.2]The vertical displacement is chosen for the purpose. The model displacement shows highest deflection at the middle grid point of the main span, which similar to the study done by [24]. Figure 6 and Table 1 present the displacement resulted from the dead load along the bridge structure.
Figure 6. Vertical displacement
TABLE III
VERTICAL DISPLACEMENT OF BRIDGE DECK.
3.1.2 Rotational Displacement at Dead Load Case
International Journal of Emerging Technology and Advanced Engineering
Website: www.ijetae.com (ISSN 2250-2459, ISO 9001:2008 Certified Journal, Volume 7, Issue 7, July 2017)
[image:4.612.331.558.133.250.2]430
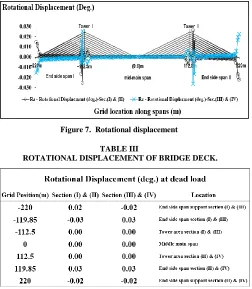
Figure 7. Rotational displacement
TABLE III
ROTATIONAL DISPLACEMENT OF BRIDGE DECK.
3.1.3 Simulation of Penang Bridge Deck at Dead Load Case
The bridge model was visualized with the use of Patran program. The model displacement was determined which was of similar displacement deflection with Nastran. Figure 8 and Figure 9 depict the displacement along the deck of the bridge model. So, the bridge’s displacement is obtained and maximal deflection was at the middle of the main span downward. The deflection indicate that the bridge would be deflected upward when load is applied.
Figure 8. Bridge model displacement - Model scale.
Figure 9. Bridge model displacement – True scale.
3.2 Stress Developed in Penang Bridge at Dead Load Case
In this section, the study discusses the stresses induced in each bridge grid point and element. Starting with the result of the structural responses at deck, cables and towers.
3.2.1 Deck Stress at Dead Load Case
[image:4.612.49.301.135.424.2]The analysis provided the maximum stresses magnitudes at the grid points along the deck. Figure 10 and Table 3 depict the stress fluctuation at the deck resulted from the dead load.
Figure 10. Deck stress at dead load case.
TABLE 3
[image:4.612.324.567.389.512.2]International Journal of Emerging Technology and Advanced Engineering
Website: www.ijetae.com (ISSN 2250-2459, ISO 9001:2008 Certified Journal, Volume 7, Issue 7, July 2017)
431
3.2.2 Cables Stress of Bridge Model at Dead Load Case
Further, the model of Penang (I) bridge is examined to identify the critical cables under the influence of high stress due to uniformly distributed structural load. The stress fluctuation of the cables is presented in Figure 11 and Table 4.
[image:5.612.326.560.139.440.2]Figure 11. Cables stress of bridge at dead load case.
TABLE III
CABLES AXIAL STRESS RESPONSE AT BRIDGE MODEL.
The results indicated that the high stressed cables elements are the code of E8 and E9 at the main span close to the middle.
3.2.3 Towers Stresses of Bridge Model at Dead Load Case
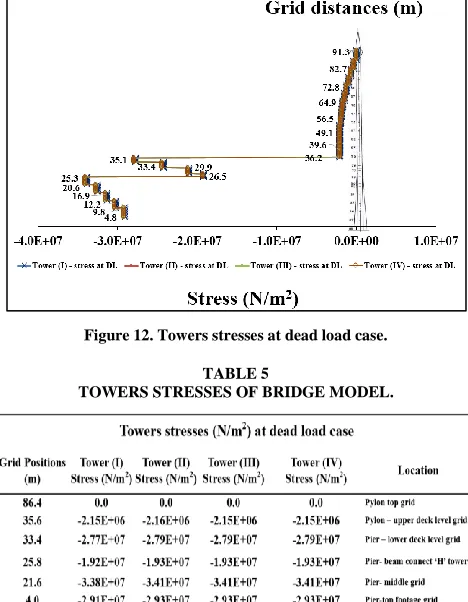
[image:5.612.48.299.263.532.2]There are four towers on each twin which is connected by beam below the deck. Figure 12 and Table 5 illustrate towers grid points fluctuation. The results portrayed that the high stressed grid point was at 21.6m of the pier from the footage of the bridge.
Figure 12. Towers stresses at dead load case.
TABLE 5
TOWERS STRESSES OF BRIDGE MODEL.
3.3 Sensor Positioning Proposed to Bridge Model at Dead Load Case
Modal analysis of Penang (I) Bridge was carried out to determine the high displacement deflection and the stress deformation. The study proposed global sensor positioning to be implemented at these grid points. Figure 13 and Table 6 demonstrate the sensor locations at 2D bridge structural model according to the analyses response as investigated due to dead load scenario.
[image:5.612.325.565.562.615.2]International Journal of Emerging Technology and Advanced Engineering
Website: www.ijetae.com (ISSN 2250-2459, ISO 9001:2008 Certified Journal, Volume 7, Issue 7, July 2017)
[image:6.612.49.289.146.330.2]432
TABLE 6
SUMMERY OF SENSORS POSITIONING.
IV. CONCLUSION
Bridge health monitoring methodology development has become vital issue to verify precise and consistent civil structures assessment. For the symmetrical static dead load sensor lay out proposed according to the high displacement and stresses. The maximal deflection was obtained at the middle of the main span. Stress is located at grid point 121.1m of the end side spans, bridge cables at M8 and M9 of main span and the tower member grid points at 21.6 m from the footage of the bridge. Hence, 18 locations of sensors were identified and proposed for the entire bridge.
Acknowledgement
Special thanks to Lembaga Lebuhraya Malaysia (LLM) and Projek Lebuhraya Utara Selatan (PLUS) for their support and cooperation.
REFERENCES
[1] Park, S., Stubbs, N., Bolton, R., Choi, S., & Sikorsky, C. (2001). Field Verification of the Damage Index Method in a Concrete Box‐ Girder Bridge via Visual Inspection. Computer‐Aided Civil and Infrastructure Engineering,16(1), 58-70.
[2] Moore, M., Phares, B. M., Graybeal, B., Rolander, D., & Washer, G. (2001). Reliability of visual inspection for highway bridges, volume I (No. FHWA-RD-01-020,).
[3] Phares, B. M., Washer, G. A., Rolander, D. D., Graybeal, B. A., & Moore, M. (2004). Routine highway bridge inspection condition documentation accuracy and reliability. Journal of Bridge Engineering, 9(4), 403-413.
[4] Aktan, A. E., Catbas, F. N., Grimmelsman, K. A., & Pervizpour, M. (2002). Development of a model health monitoring guide for major bridges. Rep. Dev. FHWA Res. Dev.
[5] Wong, K. Y. (2004). Instrumentation and health monitoring of cable‐supported bridges. Structural control and health monitoring, 11(2), 91-124.
[6] Bisby, L. A., Eng, P., Banthia, N., Bisby, L., Britton, R., Cheng, R., ... & Wegner, L. (2005). An Introduction to Structural Health Monitoring.
[7] Brownjohn, J. M. (2007). Structural health monitoring of civil infrastructure. Philosophical Transactions of the Royal Society of London A: Mathematical, Physical and Engineering Sciences, 365(1851), 589-622.
[8] Farrar, C. R., & Worden, K. (2007). An introduction to structural health monitoring. Philosophical Transactions of the Royal Society of London A: Mathematical, Physical and Engineering Sciences, 365(1851), 303-315.
[9] Sohn, H., Farrar, C. R., Hemez, F. M., & Czarnecki, J. J. (2002). A review of structural health review of structural health monitoring literature 1996-2001(No. LA-UR-02-2095). Los Alamos National Laboratory.
[10] Chang, P. C., Flatau, A., & Liu, S. C. (2003). Health monitoring of civil infrastructure. Structural health monitoring, 2(3), 257-267. [11] Chang, F. K. (Ed.). (2005). Structural health monitoring 2005:
advancements and challenges for implementation. DEStech Publications, Inc.
[12] Phares, B. M., Wipf, T. J., Greimann, L. F., & Lee, Y. S. (2005). Health monitoring of bridge structures and components using smart-structure technology. volume i (No. WHRP 05-03,). [13] Kim, K. S., & Lee, H. S. (2001). Analysis of target configurations
under dead loads for cable-supported bridges. Computers & Structures, 79(29), 2681-2692.
[14] Fang, I. K., Chen, C. R., & Chang, I. S. (2004). Field static load test on Kao-Ping-Hsi cable-stayed bridge. Journal of Bridge Engineering, 9(6), 531-540.
[15] Freire, A. M. S., Negrao, J. H. O., & Lopes, A. V. (2006). Geometrical nonlinearities on the static analysis of highly flexible steel cable-stayed bridges. Computers & Structures, 84(31), 2128-2140.
[16] Brenner, B., Bell, E. S., Sanayei, M., Pheifer, E., & Durack, W. (2010). Structural modeling, instrumentation, and load testing of the Tobin Memorial Bridge in Boston, Massachusetts. In Structures Congress 2010 (pp. 729-740).
[17] Yi, T. H., Song, G., Stiros, S. C., & Chen, B. (2015). Distributed sensor networks for health monitoring of civil infrastructures. Shock and Vibration,2015.
[18] Mohammed, M. I., Sulaeman, E., & Mustapha, F. (2017, March). Dynamic response for structural health monitoring of the Penang (I) cable-stayed bridge. In IOP Conference Series: Materials Science and Engineering (Vol. 184, No. 1, p. 012068). IOP Publishing. [19] Roach, D., Rackow, K., & DeLong, W. 10.0 FIELD
APPLICATION: REPAIR OF INTERSTATE 10 HIGHWAY BRIDGE. Use of Composite Materials, Health Monitoring and Self-Healing Concepts to Refurbish Our Civil and Military Infrastructure, 301.
[20] Roach, D. (2009). Use of Leave‐in‐Place Sensors and SHM Methods to Improve Assessments of Aging Structures. Encyclopedia of Structural Health Monitoring.
[21] Chang, C. C., Chang, T. Y. P., & Zhang, Q. W. (2001). Ambient vibration of long-span cable-stayed bridge. Journal of bridge engineering, 6(1), 46-53.
[22] Hendy, C. R., & Sandberg, J. Replacement of the stay cables on Penang Bridge 021.
[23] Chin, F. K. (1988). The Penang bridge: planning, design and construction. Lembaga Lebuhraya Malaysia.