Combining semantic web technologies
with evolving fuzzy classifier eClass for
EHRbased phenotyping : a feasibility
study
Arguello, M, Lekkas, S, Des, J, Fernandez Prieto, MJ and Mikhailov, L
http://dx.doi.org/10.1007/9783319120690_15
Title
Combining semantic web technologies with evolving fuzzy classifier
eClass for EHRbased phenotyping : a feasibility study
Authors
Arguello, M, Lekkas, S, Des, J, Fernandez Prieto, MJ and Mikhailov, L
Type
Book Section
URL
This version is available at: http://usir.salford.ac.uk/35263/
Published Date
2014
USIR is a digital collection of the research output of the University of Salford. Where copyright
permits, full text material held in the repository is made freely available online and can be read,
downloaded and copied for noncommercial private study or research purposes. Please check the
manuscript for any further copyright restrictions.
Evolving Fuzzy Classifier eClass for EHR-based
Phenotyping: a feasibility study
M. Arguello1, S. Lekkas1 J. Des2, M.J. Fernandez-Prieto3, L. Mikhailov1
Abstract In parallel to nation-wide efforts for setting up shared electronic health records (EHRs) across healthcare settings, several large-scale national and international projects are developing, validating, and deploying electronic EHR-oriented phenotype algorithms that aim at large-scale use of EHRs data for genomic studies. A current bottleneck in using EHRs data for obtaining computable phenotypes is to transform the raw EHR data into clinically relevant features. The research study presented here proposes a novel combination of Semantic Web technologies with the on-line evolving fuzzy classifier eClass to obtain and validate EHR-driven computable phenotypes derived from 1956 clinical statements from EHRs. The evaluation performed with clinicians demonstrates the feasibility and practical acceptability of the approach proposed.
1 Introduction
The adoption of electronic health records (EHRs) systems is at the heart of many international efforts to improve the safety and quality of healthcare [1]. A major benefit of EHRs as defined by the International Organisation for Standardisation (ISO) [2] is the ability to integrate patient’s clinical data across different healthcare institutions (e.g. primary and secondary care). Economically developed countries like Australia, New Zealand, United Kingdom, France, and United States have launched projects that aim at setting up shared EHRs among various healthcare providers to improve care coordination [3]. Nowadays, the most
1 University of Manchester, M13 9PL, UK [email protected]; [email protected]
2 SERGAS, 15703, Spain
prominent standards for the exchange of EHRs are: CEN/ISO EN13606 [4] and Health Level Seven (HL7) Clinical Document Architecture (CDA) [5].
In parallel to the above-mentioned efforts to achieve interoperability of EHRs across healthcare settings, several large-scale national and international projects, like eMERGE [6], CICTR [7], and SHARP [8] are developing tools and technologies for identifying patient cohorts using EHRs data. A key component in this process is to develop, validate, and deploy electronic EHR-oriented phenotype algorithms that aim at large-scale use of EHRs data.
EHR phenotyping uses data from EHRs with the aim of identifying individuals or populations with a condition or clinical profile, the so-called computable phenotype. EHR-driven phenotype definitions may include data from different sources, for example, clinical narratives. Shivade et al. [9] performed a literature review to pin down approaches that aim at automatically identifying patients with a common phenotype. According to their review, after the extraction of relevant terms and concepts from free text reports, either a rule- or machine learning-based model is used to classify patients into cohorts. Shivade et al. [9] emphasise that few studies use Semantic Web technologies for phenotyping. Likewise, Shivade et al. [9] stress that very few studies explore automated rule mining for phenotyping.
The research study presented here proposes a novel combination of Semantic Web technologies (OWL [10], SPARQL [11], and SWRL[12]) with the on-line evolving fuzzy classifier eClass [13] to obtain EHR-driven computable phenotypes from 125 HL7 CDA consultation notes that contain 1956 clinical statements. The paper also reports the results of an evaluation performed, which demonstrates the feasibility and practical acceptability of the approach proposed that automatically generates Takagi-Sugeno fuzzy rules of first order [13].
2 Research Background and Related Work
A phenotype is defined as: “the observable expression of an individual’s
genotype” [14]. In turn, the genotype is defined as: “the specific DNA sequence at
a given location” [15]. As Schulze and McMahon [16] highlight, while genotypes
affect proteins, cells, and biological pathways; phenotypes are more easily observed as manifestations (symptoms and signs) of the presence of a disease. Hripcsak and Albers [17] notice that the emerging studies employing large-scale EHR data use a two-step approach: 1) a phenotyping or feature extraction step, which transforms the raw EHR data into clinically relevant features; and 2) more traditional analysis step, which uses the features extracted for discovering/measuring associations (e.g. genotype-phenotype associations if EHR are linked to DNA biorepositories or biobanks) or identifying individuals that match research criteria for clinical trials (i.e. assessing patient eligibility).
exchange and integration. The key components of the Semantic Web include RDF [18] as the basic data model, OWL [10] for expressive ontologies, and SPARQL query language [11]. Until now, few recent studies adopt Semantic Web technologies for phenotyping. Cui et al. [19] developed an ontology-based epilepsy cohort identification system. Pathak et al. [20] present a system architecture that leverages Semantic Web technologies for phenotyping and illustrate its viability with a case study for diabetes type 2 [21]. Pathak et al. [22] investigate how Semantic Web technologies (RDF and SPARQL) can aid the discovery of genotype-phenotype associations with EHR-linked to DNA biobanks. More specifically, the Pathak et al. [22] represent EHR data (diagnosis and procedures) in RDF and use federated queries (multiple SPARQL endpoints) to enable the discovery of gene-disease associations in individuals genotyped for Diabetes Type 2 and Hypothyroidism.
Shivade et al. [9] recognise that extracting meaningful pieces of information from EHRs and consolidating them into a coherent structure is paramount for automatically identifying patient cohorts satisfying complex criteria. However, defining even a small number of phenotypes can take a group of institutions years [17]. Hripcsak and Albers [17] emphasise that despite advances in ontologies and language processing for phenotyping, the process of feature extraction remains largely unchanged since the earliest days [23].
Besides popular machine learning and statistical analysis methods for determining phenotypes, other approaches have also been explored [9]. Tatari et el. [24] used multi-agent fuzzy systems to identify patients with a high risk of breast cancer. It should be noted that fuzzy classification approaches, such as [25] [26], generally require the data to be processed in off-line mode, as a batch.
eClass and FLEXFIS-Class are on-line evolving fuzzy classifiers [27]. Both of them follow a well-known option for achieving data-driven approximation models that lies in the usage of Takagi-Sugeno fuzzy models [28]. As Angelov et al. [27] remark: a) the term “evolving” means that new rules, structures, and so on are evolved during on-line processing based on ‘new’ data samples; and b) they should not be confused with “evolutionary” proposals (sometimes also called “evolving” [29]), which are usually processed in off-line mode, as a batch.
3 Fuzzy Pattern Recognition for EHR-based Phenotyping
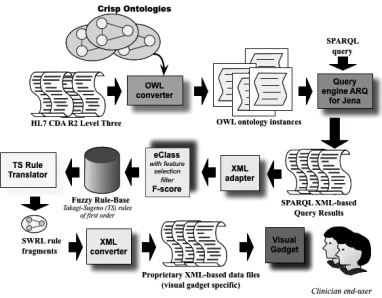
The starting point of this research is a set of 125 consultation notes that are formatted according to the EHR standard HL7 CDA. HL7 CDA documents derive their machine processable meaning from the HL7 Reference Information Model (RIM) [34] and use the HL7 V3 [35] data types. The RIM and the V3 data types provide a powerful mechanism for enabling CDA’s incorporation of concepts from standard coding systems such as SNOMED CT [36] and LOINC [37]. According to CDA Release 2 [5], a CDA document section can contain a single narrative block (free text) and any number of CDA entries (coded information, e.g. HL7 RIM Observations). We built on our previous work, and thus, XML-based CDA sections and entries are mapped to ontology instances in OWL 2 [10]. Pattern recognition can be seen as a sequence of some steps [38], namely 1) data acquisition; 2) feature selection; and 3) classification procedure. Figure 1 shows an architecture overview of our approach with the key components involved. Each of the three major steps can be summarised as follows:
1. Data acquisition – this step relies on the OWL converter (see Figure 1) to
obtain a formal semantic representation of clinical statements as stated by the XML-based HL7 CDA standard specification. This step builds on our previous work [39], and takes advantage of the OWL's import capability to deal with ontological information from multiple documents.
2. Feature selection – this step firstly uses the query engine ARQ for Jena
[40] to execute SPARQL queries that retrieve individuals (ontological instances) with specific characteristics from the OWL model, and it builds on our previous work [39]. Secondly, the feature selection filter F-score [41] is applied.
3. Classification procedure – this step employs the evolving fuzzy classifier
Figure 1 Approach overview: fuzzy pattern recognition for EHR-based phenotyping
3.1 Fuzzy Pattern Recognition using eClass
This section provides an overview of the evolving fuzzy classifier eClass introduced that tackles knowledge generation from EHR data streams in real-time
and is used for EHR-based phenotyping.
Let Z be a set of 125 HL7 CDA consultation notes with established diagnosis belonging to the Assessment and Plan sections. These established diagnosis (118 CDA entries) are considered as known classification labels to classes from the set
Ω = {w1,…,wC}. Clinical statements from the History of Present Illness section
(405 CDA entries) or the Physical Findings section (1433 CDA entries) for each CDA consultation note can be mapped to numeric values of the features from a set X = {x1,…,xn}. Let Sn denote the feature space generated by the set X. The fuzzy
pattern recognition task relies on fuzzy decision (FD) rules, where each input feature vector x ∈ Sn may be attached to a set of classes with different degrees of
membership.
The first order Takagi-Sugeno (TS) fuzzy models [28] are a special group of rule-based models with fuzzy antecedents and functional consequents that follow from the Takagi-Sugeno-Kang reasoning method [43]. The fuzzy rule base that describes the non-linear evolving classifier eClass can be described as a set of TS fuzzy rules of first order, where the consequents of the fuzzy rule are linear classifiers. These TS fuzzy rules are the FD rules for the fuzzy pattern recognition task and follow the form:
Ri: IF (x
1 is A1i) AND .. AND (xn is Ani) THEN yci = fi (1)
In formula 1, Ri is the ith TS fuzzy rule (FD rule). In the antecedent part (if-part)
of the TS fuzzy rule x = [x1, x2, …, xn]T is the n-dimensional (input) feature vector
that are mapped to clinical statements from the History of Present Illness section
or the Physical Findings section of a patient’s CDA consultation note. Aji denotes
the antecedent fuzzy sets, j ∈ [1, n]. In the consequent part (then-part) of the TS fuzzy rule, yi = [y
1i, y2i, …, yCi] is the C-dimensional fuzzy output, i ∈ [1, NC]
and c ∈ [1, C], where NC is the number of rules per class c and C is the number of
classes from the set Ω.
The structure of the eClass is thus formed by sets of TS fuzzy rules in such a way that there is at least one TS fuzzy rule per class. As suggested in [13, 44] and further employed in [32], the so called “winner-takes-all” defuzzification is applied to determine the correct class, which is the usual choice in classification problems. Hence, in equation 2, Classi is the class label of the ith TS fuzzy rule,
which corresponds to the class c with the highest possibility yci.
Classi = argmax
1≤ c ≤ C (yci) (2)
For Gaussian-like antecedent fuzzy sets, a fuzzy set Aji of the ith TS fuzzy rule,
j ∈ [1, n], is defined by the μi
j membership function (MF). The MF defines the
spread of the antecedent and the zone of influence of the ith rule; where xi* is the
prototype (centroid or focal point) of the ith TS fuzzy rule antecedent. Hence, μi j
measures the degree of proximity of a data sample xt to the prototype of a TS
fuzzy rule.
Generally, the problem of identification of a first order TS model is divided into two sub-tasks [28, 43]: 1) learning the antecedent part of the model (see equation 1), which consists of determination of the focal points of the rules and the spreads of the MFs; and 2) learning the parameters of the linear subsystems of the consequents.
3.2 Introducing a Novel Online Feature Selection Filter
How to successfully achieve dimensionality reduction in conjunction with eClass
is another novelty of the current research study. In general, dimensionality reduction methods are said to follow two basic baselines [45]: filter methods and
wrapper methods. However both of them present serious drawbacks when dealing
with online data streams. A third alternative to tackle dimensionality reduction, which also appears in literature, is based on F-Score [41]. This study adopts the extended version of the F-Score method as proposed by Lekkas and Mikhailov [32], which can deal with more than two classes. What remains to be asked from the study presented in [32] is whether the temporal F-Scores can be further used as a criterion to reduce the original dimensionality of the problem in online mode. Given the set of scores for every tth input sample, how can the resultant filtered
input be more meaningful for an eClass model to learn from? To answer this question, we propose a threshold based condition. Let Ft = {F
1t, …,Fnt} be the set
of F-Scores of the tth input sample xt, and ft the tth filtered input sample. The latter
∀j, j ∈ [1, n]: IF (Ft
j> h * max (Ft)) THEN (f tjß x tj) ELSE (f tjß 0)
(3) Formula 3 expresses the following condition: every feature that has a score greater than a fraction of the maximum of the tth scores must be retained,
otherwise it can be disregarded from the tth filtered input f. In formula 3, h is a
threshold constant with reliable values in the range [0.001, 0.05]. The purpose of h is to restrain a portion of the maximum temporal score, leading to a very flexible online feature selection scheme. It is flexible because also considers when none of the features should be removed, for example when they scored alike. Hence, it is unlikely to cause loss of information as opposed to suddenly selecting the k top most-ranking features (according to what is suggested in [45]).
3.3 TS fuzzy rules: clinically aided interpretation and visualisation
The linguistic interpretability of the generated TS fuzzy rules by clinicians has been proved difficult as they are not computer scientists familiarised with fuzzy sets that involve cluster prototypes (focal points) or fuzzy membership function that defines the degree of closeness (or proximity) of a sample to a cluster prototype. The following excerpt exemplifies the straightforward linguistic interpretability of a TS fuzzy rule:
IF (x1 isAround[+/- 0.468] 0.000) AND (x2 isAround[+/- 0.468] 0.000) AND … AND (x17 isAround[+/- 0.468] 0.000) THEN Class = 2
In [46], different categories of clinical indicators can be found. According to [46], disease-specific indicators are diagnosis-specific. On the one hand, the consequents of the TS fuzzy rules used take into account the diagnosis, where the process of learning the consequent part of a fuzzy rule is supervised, and thus, the adoption of disease-specific indicators seems appropriate. On the other hand, the generated TS fuzzy rules can be plotted into 2D graphs to represent the cluster centroid and the cluster radius, and thereby, the introduction of the qualifiers
distal and proximal to capture the graphical implications of the TS fuzzy rules can
be seen as properly justified. In our proposal, we introduce “proximal disease-specific indicators” and “distal disease-specific indicators”. However, these two terms are well known to epidemiologists. To illustrate this: ‘smoking’ is a well known proximal disease-specific indicator for lung cancer, while ‘working in a coal mine’ is a well known distal disease-specific indicator for lung cancer. Thus,
the proximal and distal disease-specific clinical indicators introduced facilitate a
quick understanding and easy access to key information capture in the evolving
fuzzy rule-base that is dynamically obtained.
an antecedent of a TS fuzzy rule can be the following: IF (x1 isAround[+/- 0.269] 0.000) AND (x2 isAround[+/- 0.269] 0.000) AND (x3 isAround[+/- 0.269] 0.000)
AND … To transform the above-mentioned TS fuzzy rule antecedent to a rule
antecedent in SWRL, the features (variables) {x1, …, xn} are reinterpreted as
SNOMED CT clinical findings and two OWL ObjectProperties are being introduced (isAround and hasFocalPoint). To further illustrate this: (x1 isAround[+/- 0.269] 0.000) from a TS fuzzy rule is mapped to the following in SWRL: Lid_adhesions(?x1) ^ isAround(?x1, 0.269) ^ hasFocalPoint(?x1, 0.000).
The success of Ajax [47], shorthand for Asynchronous JavaScript and XML, has brought an increasing amount of visual gadgets, most of them generic enough to be used in different contexts, where typically JavaScript provides the means to allow end-user interaction. An attractive feature that is increasingly commonly available among these visual gadgets, such as amCharts [42], is to distinguish between settings and data. This means that the settings could be configured just once for a particular use, and then, different data sets can be used without reconfiguration. Furthermore, settings and data are usually stored in two separated XML-based files, and therefore, it is possible to build on-fly XML-based data files
upon user request. The current approach (see Figure 1) incorporates XML converters to “translate” fragments of SWRL rules into an XML-based file (XML-based data files of visual gadgets).
4 Experimental Results and Clinicians’ Evaluation
The experiments conducted exploit the architecture described in section 3 (see Figure 1 for details), and adopts the buffering technique proposed by Lekkas and Mikhailov [33], where data samples are processed in time windows and not in batch. The buffering technique applied considers buffers that can store 5, 10, or 20 data samples.
The experiments performed consider two datasets:
• Dataset I – the data samples contain discrete numerical values that are mapped to clinical statements from the History of Present Illness sections
of patients’ CDA consultation notes; and
• Dataset II – the data samples contain discrete numerical values that are mapped to clinical statements from the Physical Findings sections of patients’ CDA consultation notes.
The clinical statements from both the History of Present Illness sections and the
The two datasets (dataset I and dataset II) come from 125 anonymised CDA consultation notes that have established diagnosis (CDA entries) related to ‘Red Eye’ [48], which involves 8 diseases coded in SNOMED CT. For both datasets, eClass starts ‘from scratch’ with an empty fuzzy rule base and no pre-training; and subsequently, evolves its structure from the data stream. The execution time of the dataset I is 203 ms; while the dataset II is executed in 515 ms. This difference is due to differences in dimensionality. Dataset I has 17 features, while Dataset II has 37 features. Hence, for the same amount of data samples, it is expected that as the number of features increases, so does the execution time. Eight TS fuzzy rules are automatically generated for dataset I and nine TS fuzzy rules for dataset II.
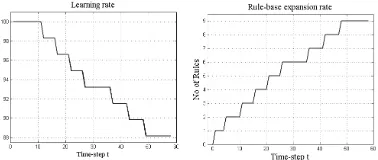
Figure 2 shows for dataset I the learning rate of eClass with the online feature selection filter F-score from [32] (left hand-side); the expansion rate of the fuzzy rule base (RB) for increasing time step (middle); and the area of dimensional reduction achieved using eClass with the filter F-Score (right hand-side), where a number of features may be discarded for every time-step.
[image:10.595.134.431.332.414.2]Figure 2 Dataset I – learning rate of eClass with F-Score; expansion rate of fuzzy RB; and area of dimensionality reduction
Figure 3 shows for dataset II the learning rate of eClass (left hand-side) and the expansion rate of fuzzy RB for increasing time step (right hand-side).
Figure 3 Dataset II – learning rate of eClass and expansion rate of fuzzy RB
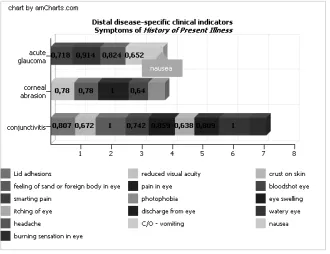
To validate the proposal, visual representations of the distal and proximal
disease-specific indicators introduced are enabled by means of amCharts [42]
[image:10.595.135.324.491.571.2]the History of Present Illness sections of CDA consultation notes, i.e. EHR data. In order to measure the suitability of the EHR-based phenotypes obtained, Newton et al. [6] use precision and recall. In the same vein, we conducted an evaluation with a physician with more than fifteen years of experience in clinical practice and we calculated accuracy. Table 1 reports the accuracy of the TS rules obtained for the eight diseases (SNOMED CT established diagnoses) related to ‘Red Eye’ with EHR data, i.e. dataset I and dataset II. It should be noted that the physician understood the disease-specific indicators introduced with the help of an epidemiologist without any further explanation. At the moment of writing, more evaluations are planned.
Figure 4 Cross-comparing distal disease-specific indicators for three diseases for ‘Red Eye’
Table 1. Physician evaluation – Accuracy of the TS rules automatically generated
Established Diagnosis (SNOMED CT)
Accuracy for Dataset I (TP + TN)/(P + N)
Accuracy for Dataset II (TP + TN)/(P + N) Conjunctivitis
Conjunctival hemorrhage Corneal Ulcer
Herpes simplex dendritic keratitis Photokeratitis
Scleritis and Episcleritis Acute angle-closure glaucoma
Anterior uveitis
82.35 % 76.47 % 94.12 % 94.12 % 88.23 % 88.23 % 94.12 % 82.35 %
83.78% 97.29% 81.08 % 89.19 % 94.59 % 94.59 % 78.38 % 78.38 %
5 Discussion
[image:11.595.137.464.448.571.2]systematic study of clinical phenotypes is achieving standards-based executable phenotype definitions [49]. To further illustrate this: Richesson et al. [50] report seven phenotype definitions for diabetes mellitus, which are used for diabetes cohort identification. Actually, Richesson et al. [50] recognise that currently, there is a lack of standard EHR phenotype definitions for most chronic conditions, including diabetes.
This research study adopts eClass, which can cope with real-time classification of streaming data from EHRs. Three main benefits arise from the experiments performed to prove the suitability of eClass for EHR-based phenotyping: 1) when using eClass the number of fuzzy rules as well as the number of classes (main diagnoses from EHRs) can change and do not need to be fixed; 2) eClass can start either “from scratch” (with an empty fuzzy rule base) or with some pre-specified set of fuzzy rules; and 3) if the class label is not provided, the existing fuzzy rule base can generate the predicted class, and thereby, a patient can be assigned to a certain cohort. These three benefits make of eClass a powerful tool for identifying patient phenotype cohorts using EHRs data. The main drawback of eClass, despite the defuzzification process, is the lack of straightforward clinical interpretability of the TS fuzzy rules generated, which makes unavoidable for clinicians to possess some understanding of TS fuzzy models.
Our proposal incorporates Semantic Web technologies for: 1) extracting clinical statements (symptoms, signs, and established diagnoses) from EHRs, by means of SPARQL queries that retrieve OWL individuals (ontological instances) as part of the feature extraction step; and 2) aiding the clinical interpretation and visualisation of the evolving fuzzy rules by means of disease-specific indicators
that are incorporated into the OWL ontology and exploited by the SWRL rules that are mapped to the TS fuzzy rules generated from the EHRs data.
It should be noted that our approach advocates for managing the fuzziness directly within Semantic Web components, as Ciamarella et al. [51], instead of extending OWL or SWRL to deal with fuzziness. Examples of the latter can be found in Stoilos et al. [52] and Pan et al. [53].
In our study, the disease-specific indicators introduced are incorporated into crisp OWL ontologies and SWRL rules. These clinical indicators emerge from close collaboration with epidemiologists and favour a straightforward validation by healthcare professionals of the EHR-driven computable phenotypes obtained. Nowadays, validation of EHR-based phenotypes remains an important aspect of their use.
6 Conclusion
populations with a condition or clinical profile, the so-called computable phenotype. The emerging studies for identifying computable phenotypes employ large-scale EHR data and use a two-step approach. Even with advances and new approaches, the first step that is feature extraction remains labour-intense and time consuming. Furthermore, the heterogeneity in EHRs means that phenotype validation is an important aspect of phenotype use, particularly when there is a lack of agreement about phenotype definitions for the same condition.
The research study presented here proposes a novel combination of Semantic Web technologies (OWL, SPARQL, and SWRL) with the on-line evolving fuzzy classifier eClass to obtain and validate EHR-driven computable phenotypes derived from 125 HL7 CDA consultation notes containing 1956 clinical statements. The evaluation performed demonstrates the feasibility and practical acceptability of the approach proposed to automatically generate and validate EHR-based phenotypes. In our approach, the healthcare professionals remain unaware of the underlying technologies that support fuzzy pattern recognition to enable EHR-based phenotyping. Hence, consistent phenotype assessment may be feasible, fostering the possibility of reducing variation in phenotype definitions.
References
1. Cresswell, K.M., Worth, A., Sheikh, A.: Comparative case study investigating sociotechnical processes of change in the context of a national electronic health record implementation. Health Informatics journal. Vol. 18, pp. 251-270 (2012).
2. ISO/TR 20514 Technical Report: EHR Definition, Scope, and Context (2005). Available via ISO http://www.iso.org/iso/catalogue_detail.htm?csnumber=39525. Accessed May 2014. 3. Metzger, M.H., Durand, T., Lallich, S., Salamon, R., Castets, P.: The use of regional platforms
for managing electronic health records for the production of regional public health indicators in France. BMC Medical Informatics and Decision Making. Vol. 12 (2012).
4. CEN/ISO EN13606, http://www.en13606.org/the-ceniso-en13606-standard. Accessed May 2014.
5. Dolin, R.H., Alshuler, L., Boyer, S., Beebe, C., Behlen, F.M., Biron, P.V., Shabo, A.: HL7 Clinical Document Architecture, Release 2. Am Med Inform Assoc. Vol. 13, pp. 30-39 (2006).
6. Newton, K.M., Peissig, P.L., Kho, A.N., Bielinski, S.J., Berg, R.L., Choudhary, V., Basford, M., Chute, C.G., Kullo, I.J., Li, R., Pacheco, J.A., Rasmussen, L.V., Spangler, L., Denny, J.C.: Validation of electronic medical record-based phenotyping algorithms: results and lesson learned from the eMERGE network. Am Med Inform Assoc. Vol. 20, pp. 147-154 (2013).
7. Anderson, N., Abend, A., Mandel, A., Geraghty, E., Gabriel, D., Wynden, R., Kamerick, M., Anderson, K., Rainwater, J., Tarczy-Hornoch, P.: Implementation of a deidentified federated data network for population-based cohort discovery. J Am Med Inform Assoc. Vol. 19, pp. 60-67 (2011).
9. Shivade, C., Raghavan, P., Fosler-Lussier, E., Embi, P.J., Elhadad, N., Johnson, S.B., Lai, A.M.: A review of approaches to identifying patient phenotype cohorts using electronic health records. Am Med Inform Assoc. Vol. 21, pp. 221-230 (2014).
10. OWL 2 Web Ontology Language, http://www.w3.org/TR/owl2-primer/. Accessed May 2014. 11. SPARQL, http://www.w3.org/TR/rdf-sparql-query/. Accessed May 2014.
12. SWRL, http://www.w3.org/Submission/2004/SUBM-SWRL-20040521/. Accessed May 2014.
13. Angelov, P., Zhou, X., Klawonn, F.: Evolving Fuzzy Rule-based Classifiers. In: Proc. IEEE Symposium on Computational Intelligence in Image and Signal Processing, pp. 220-225 (2007).
14. Wojczynski, M.K., Tiwari, H.K.: Definition of Phenotype. Advances in Genetics. Vol. 60, pp. 75-105 (2008).
15. Denny, J.C.: Mining electronic health records in the genomics era. PLoS Comput Biol. Vol. 8 (2012).
16. Schulze, T.G., McMahon, F.J.: Defining the phenotype in human genetic studies: Forward genetics and reverse phenotyping. Hum. Hered. Vol. 58, pp. 131-138 (2004).
17. Hripcsak, G., Albers, D.J.: Next-generation phenotyping of electronic health records. J Am Med Inform Assoc. Vol. 20, pp. 117-121 (2013).
18. RDF, http://www.3.org/RDF. Accessed May 2014.
19. Cui, L., Bozorgi, A., Lhatoo, S.D., Zhang, G.Q., Sahoo, S.S.: EpiDEA: extracting structured epilepsy and seizure information from patient discharge summaries for cohort identification. In: Proc. AMIA Annu Symp, pp. 1191–1200 (2012).
20. Pathak, J., Kiefer, R.C., Chute, C.G.: Using semantic web technologies for cohort identification from electronic health records for clinical research. AMIA Summits Transl Sci Proc, pp. 10–19 (2012).
21. Pathak J., Kiefer, R.C., Bielinski, S.J., Chute, C.G.: Mining the Human Phenome using Semantic Web Technologies: A Case Study for Type 2 Diabetes. In: Proc. AMIA Annu Symp, pp. 699–708 (2012).
22. Pathak, J., Kiefer, R.C., Bielinski, S.J., Chute, C.G.: Applying semantic web technologies for phenome-wide scan using an electronic health record linked Biobank. Journal of biomedical semantics. Vol. 3 (2012).
23. Warner, H.R.: Knowledge sectors for logical processing of patient data in the HELP system. In: Proc. International Conference on Interactive Techniques in Computer-Aided Design, pp. 401–404 (1978).
24. Tatari, F., Akbarzadeh-T, M-R, Sabahi A.: Fuzzy-probabilistic multi agent system for breast cancer risk assessment and insurance premium assignment. J Biomed Inform. Vol. 45, pp. 1021–1034 (2012).
25. Goncalves, L.B., Velasco, M.M.B.R., Pacheco, M.A.C., De Souza,F.J.: Inverted hierarchical neuro-fuzzy BSP system: a novel neuro-fuzzy model for pattern classification and rule extraction in databases. IEEE Transactions on Systems, Man and Cybernetics (Part C). Vol 16, pp. 236-248 (2006).
26. Loo, C.K., Rao, M.V.C.: Accurate and reliable diagnosis and classification using probabilistic ensemble simplified fuzzy ARTMAP. IEEE Transactions on Knowledge and Data Engineering. Vol. 17, pp. 1589-1593 (2005).
27. Angelov, P., Lughofer, E., Zhou, X.: Evolving fuzzy classifiers using different model architectures. Fuzzy Sets and Systems. Vol. 159, pp. 3160-3182 (2008).
28. Takagi, T., Sugeno, M.: Fuzzy identification of systems and its applications to modelling and control. IEEE Transactions in Systems, Man and Cybernetics. Vol. 15, pp. 116-132 (1985). 29. Gomez, J., Gonzalez, F., Dasgupta, D., Nasaroui, O.: Complete expression tree for evolving
30. Lughofer, E., Klement, E.: FLEXFIS: A Variant for Incremental Learning of Tagaki-Sugeno Fuzzy Systems. In: Proc. 14th IEEE International Conference on Fuzzy Systems, pp. 915-920 (2005).
31. Xydeas, C., Angelov, P., Chiao, S., Reoullas, M.: Advances in classification of EEG signals via evolving fuzzy classifiers and dependant multiple HMMs. Computers in Biology and Medicine. Vol. 36, pp. 1064-1083 (2005).
32. Lekkas, S., Mikhailov, L.: Breast cancer diagnosis based on evolvable fuzzy classifiers and feature selection. In: Proc. 28th international conference on innovation techniques and applications of artificial intelligence, pp. 185-195 (2008).
33. Lekkas, S., Mikhailov, L.: Evolving fuzzy medical diagnosis of Pima Indians diabetes and of dermatological diseases. Artificial Intelligence in Medicine. Vol. 50, pp. 117-126 (2010). 34. HL7 RIM, http://www.hl7.org/implement/standards/rim.cfm. Accessed May 2014.
35. HL7 V3 data types, http://www.hl7.org/implement/standards/product_brief.cfm?product_id =264. Accessed May 2014.
36. IHTSDO, SNOMED CT Editorial Guide (January 2014 International Release). Available via IHTSDO http://www.ihtsdo.org/eg.pdf. Accessed May 2014.
37. LOINC, http://www.loinc.org. Accessed May 2014.
38. Pedrycz, W.: Fuzzy sets in fuzzy recognition: methodology and methods. Pattern Recognition. Vol. 23, pp. 121-146 (1990).
39. Arguello, M., Fernandez-Prieto, M.J., Des, J.: Extracting and Visualising Clinical Statements from Electronic Health Records. Research and Development in Intelligent Systems XXX, pp. 307-320, (2013).
40. Query engine ARQ for Jena, http://jena.apache.org/documentation/query/. Accessed May 2014.
41. Chen, Y.W., Lin, C.J.: Combining SVMs with Various Feature Selection Strategies. Studies in Fuzziness and SoftComputing. Vol. 207, pp. 315-324 (2006).
42. AmCharts, http://www.amcharts.com/. Accessed May 2014.
43. Angelov, P., Filev, D.: An approach to online identification of Tagaki-Sugeno fuzzy models. IEEE Transactions in Systems, Man and Cybernetics. Vol. 34, pp. 484-498 (2004).
44. Angelov, P., Zhou, X.: Evolving fuzzy rule-based classifiers from data streams. IEEE Transactions of Fuzzy Systems Special Issue on Evolving Fuzzy Systems. Vol. 16, pp. 1462-1475 (2008).
45. Perkins S., Theiler J.: Online feature selection using grafting. In: Proc. of the Twenty-First International Conference on Machine learning, pp. 592–599 (2003).
46. Mainz, J.: Defining classifying clinical indicators for quality improvement. International Journal for Quality in Health Care. Vol. 15, pp. 523-530 (2003).
47. Ajax, http://adaptivepath.com/publications/essays/archives/000385.php. Accessed May 2014. 48. Fraser, S.R., Asaria, R., Kon, C.: Eye Know How, BMJ Books, London (2001).
49. Li, D., Endle, C.M., Murthy, S., Stancl, C., Suesse, D., Sottara, D., Huff, S.M., Chute, C.G., Pathak, J.: Modeling and executing electronic health records driven phenotyping algorithms using the NQF quality data and JBoss drools engine. AMIA Summits Transl Sci Proc, pp. 532–541 (2012).
50. Richesson, R.L., Rusincovitch, S.A., Wixted, D., Batch, B.C., Feinglos, M.N., Miranda, M.L., Hammond, W.E., Califf, R.M., Spratt, S.E.: A comparison of phenotype definitions for diabetes mellitus. J Am Med Inform Assoc. Vol. 20, pp.319-326 (2013).
51. Ciaramella, A., Cimino, M., Marcelloni, F., Straccia, U.: Combining Fuzzy Logic and Semantic Web to Enable Situation-Awareness in Service Recommendation. In: Proc. of Database and Expert Systems Applications, pp. 31-45 (2010).
52. Stoilos, G., Stamou, G., Tzouvaras, V., Pan, J.Z., Horrocks, I.: Fuzzy OWL: Uncertainty and the Semantic Web. In: Proc. 1st Int. Workshop on OWL Experiences and Directions (2005). 53. Pan, J.Z., Stoilos, G., Stamou, G., Tzouvaras, V., Horrocks, I.: f-SWRL: A Fuzzy Extension