International Journal of Emerging Technology and Advanced Engineering
Website: www.ijetae.com (ISSN 2250-2459,ISO 9001:2008 Certified Journal, Volume 4, Issue 10, October 2014)
243
Optimization of Fixed and Floating Type Media Based Digester
Kinetics for Sugar Factory Effluent
Rajaram S.
1, Dr. Raut P. D.
21Department of Technology, Shivaji University, Kolhapur, India
2A Professor and HOD, Department of Environmental Science, Shivaji University, Kolhapur, India
Abstract— Sugar Factory effluent is one of the most
important moderate – high pollution concentration
wastewater, which is generated mainly from the mill house washing activities of the sugar factory. The effluent is rich in organic matter resultant from the sugarcane juice, sugar syrup and sugar present in the washwater. The COD of this effluent is variable from 5000 – 10000 mg/L. The aim of the present paper is to analyze the suitability of the floating and fixed film anaerobic digesters as a primary treatment for sugar factory effluent treatment. In this process, the suitability of the units with respect to loading rates was studied and filter treatability and reaction rate constants were obtained.
Keywords—Sugar Effluent, Fixed Film, Floating Film,
Reaction Kinetics, Biological Treatment.
I. INTRODUCTION
Agro – based industrial sector is a major contributor to the world economy since it is primarily responsible for the consumer based market. Due to this inherent advantage, the agro – based industrial sector is one of the most important revenue generation sources in a country’s economy.
Sugar and distillery sector is one such division which has been responsible for the successful growth of the developing countries like Sudan, Philippines, Fiji, and India etc. In these areas, sugarcane is cultivated as a prime cash crop and has been dominating the country’s economy. Moreover, this sector is not only generating revenue, but is creating employment for a large sector of the society.
Indian sugar industry is one of the main drivers of the country's rural economy supporting its agricultural growth. It supports over 50 million farmers and their families, along with workers and entrepreneurs of almost 500 mills, apart from a host of wholesalers and distributors spread across the country. The Indian sugar industry also occupies a significant place in the global sugar industry being the second largest producer of the commodity in the world. . India also enjoys one of the largest markets in the world, in volume terms. India is and remains a key growth driver for world sugar, growing above the Asian and world consumption growth average.
Besides farmers, an estimated 0.5 million workers are directly employed as agricultural labour involved in cultivation and harvesting. The sugar industry also supports diversified ancillary activities and skills that support the local economy. The dependent population creates substantial demand for local goods and services. The annual economic contribution of the sugar industry to the exchequer through principal indirect taxes amounts to more than Rs. 2800 crore. The Indian sugar industry is at the cross roads today, where it can leverage opportunities created by global shifts in sugar trade as well as the emergence of sugarcane as a source of renewable energy, through ethanol and cogeneration. (All India Distillers Association).
A.Raw material and water demand
The water demand in the sugar industry is variable based on the crushing capacity of the sugar factory. The normal usages of water in the distillery range from washing, soaking to boiler steam generation. However, most of the water streams are reused based on the quality of the water.
Water Use in Sugar Factory
A sugar factory requires fresh water for the following processes
i. Process Application
1.Cane Washing
2.Diffusion Leaching
3.Steam for Evaporation
ii. Non Process Application
1.Cooling Tower Water
2.Water for Washing
II. WASTEWATER GENERATION IN SUGAR FACTORY
International Journal of Emerging Technology and Advanced Engineering
Website: www.ijetae.com (ISSN 2250-2459,ISO 9001:2008 Certified Journal, Volume 4, Issue 10, October 2014)
244
When the water from spray pond overflows, it becomes a part of the wastewater-usually of low BOD in a properly operating sugar mill. But because of poor maintenance and bad operating conditions, a substantial amount of sugar may enter in the condense water.This polluted water instead of being recirculated is discarded as excess condense water. These discharges contribute substantially to the waste volume and moderately to the BOD in many sugar mills. Additional waste originates due to the leakages and spillages of juice, syrup and molasses in different sections and also due to the handling of molasses. The periodical washings of the floor also contribute a great to the pollution load. Though these wastes are smaller in volume and are discharged intermittently, they have got a very high BOD. The periodic flow-off from the boilers produces another intermittent waste discharge. This waste is high in suspended solids, low in BOD, and is usually alkaline.
Process Waste Streams
o Condensate from Ist to IVth Body Evaporators
Non – Process Waste Streams
o Cooling Tower Blowdown
o Waste wash water
o Water Treatment Plant Maintenance Water
Out of these, most of the non – process streams are recycled to ancillary units, or used for washing purposes, gardening etc. The various types of process effluents are as described below.
TABLE I
CHARACTERISTICS OF SUGAR FACTORY EFFLUENT STREAMS
Various Process/ Plant
House
Range of Parameters
T emp oC pH T DS mg/ l S S mg/ l O&G mg/ l C OD mg/ l B OD mg/ l
1 Milling
Plant 25-30 5-5.5 350-400
500-550 30-50
1000- 1500
700- 1000
2 Pump
cooling at
Milling
Plant and at
Boiler
house
30-50 6-6.5
400-500 30-50 - 200-300
50-80`
3 Boiler
Blow down 85-90 5.8- 6.0
450-500
50-100 -
500-550 30-40
4 Boiling
House 40-60 4.5- 5.0 400-450 400-600 5.0- 1.0 2000- 3000 1500- 2000
5 Excess
condensate 60-70 6.0- 6.2
80-1000 5-10 - 250-300
100-150
6 Sulphate
House
30-35 - - - -
7 Lime
House 25-30
International Journal of Emerging Technology and Advanced Engineering
Website: www.ijetae.com (ISSN 2250-2459,ISO 9001:2008 Certified Journal, Volume 4, Issue 10, October 2014)
245
III. SUGAR FACTORY EFFLUENT TREATMENT
A. Available Treatment Processes 1) Process wastewater treatment
Techniques for treating industrial process wastewater in sugar industries include:
preliminary treatment for separating floating, settleable solids, oil & grease
Flow & load equalization
sedimentation for suspended solids reduction using
clarifiers
biological treatment, typically anaerobic followed by
aerobic treatment, for reduction of soluble organic matter (BOD)
biological nutrient removal for reduction in nitrogen & phosphorus
chlorination of effluent when disinfection is required
dewatering and disposal of residuals; in some instances composting or land application of wastewater treatment residuals of acceptable quality may be possible
Additional engineering controls may be required to
contain and neutralize nuisance odors
There are mainly two effluent streams emanating from a sugar factory, namely, process house effluent and cooling water and excess condensate. The cooling water and excess condensate practically do not contribute any pollution load. It is therefore, suggested that these two streams should be segregated and treatment units may be installed for process house effluent only, while cooling water and excess condensate may be let out directly for irrigation or can be used for dilution purpose, after checking for quality.
A separate holding tank of one day capacity should be provided for soda waste, acid waste and boiler blowdown water and this may be discharged gradually within a fortnight into treatment plant.
In the process house effluents, the floor washings and mill house washings are the major sources of effluent to be treated. Suggested methods for the treatment of these wastes are as given below:
2) Preliminary treatment
In order to remove the inorganic settleable solids and oil & grease matter, a catch pit, oil & grease trap, respectively should be provided.
3) Biological treatment a)Lagoons
If land is available and the soil possesses impermeable characteristics, lagoons may be used.
Lagoons may be constructed in series and should preferably be operated on the principle of anaerobic and aerobic action. It is found by experience that the anaerobic lagoons should have 15 days detention time and a 3-metre liquid depth, whereas an aerobic lagoon must have a depth of 1 meter with a detention time of 15 days.
b)Extended aeration
Where lagoons are not suitable, extended aeration is recommended which is cheap and economical. For extended aeration treatment, a lined aeration reactor of 24-48 hr. holding capacity is to be constructed. The food to microorganisms (F/M) ratio of 0.05 is to be maintained. A part of sludge is to be recirculated in order to maintain the
required mixed liquor suspended solids (MLSS)
concentration. The excess sludge from a secondary setting tank can be directly dried on sludge drying beds.
c)Activated sludge and trickling filters
These methods can also be used but have been found to be expensive in view of greater controls and operational costs. They are recommended for sugar factories having an installed capacity of more than 5000 tons daily.
International Journal of Emerging Technology and Advanced Engineering
Website: www.ijetae.com (ISSN 2250-2459,ISO 9001:2008 Certified Journal, Volume 4, Issue 10, October 2014)
246
Sugar Factory Effluent
Equalization Tank
Anaerobic Digester Tank
Degasser Settling
To Lagoon Feed Pump
Spray Pump Sludge
Recycle Pump
Butterfly Valve
TABLE II
DISPOSAL STANDARDS FOR SUGAR FACTORY EFFLUENT
Pollutants Unit Guideline Value
pH pH 6-9
BODs mg/l <30
COD mg/l <250
Total Nitrogen mg/l 100
Phosphates mg/l 2
Oil &Grease mg/l < 10
TSS mg/l 30 for disposal in Surface Water
100 for disposal on land
Temperature 0C < 3b
Total Coliform bacteria MPN/ 100ml
NIL
MPN–Most Portable Number
b–At the edge of a scientifically established mixing zone which takes into account ambient water quality, receiving, receiving water use, potential receptors and assimilative capacity.
[image:4.612.334.552.321.508.2]Source: CPCB
Figure I Effluent Treatment Measures
B. Present Treatment Methodology
It is a known fact that anaerobic biological treatment is one of the most cost economic and energy limiting techniques for the treatment of organically rich wastewater (Apte S. S., 2011). However, limited research has been carried out in the area of reaction kinetics for fixed film and floating film anaerobic digester for sugar factory effluent. The present project tried to observe the changes in the factors like loading rate and pH and its influence on the reaction rate.
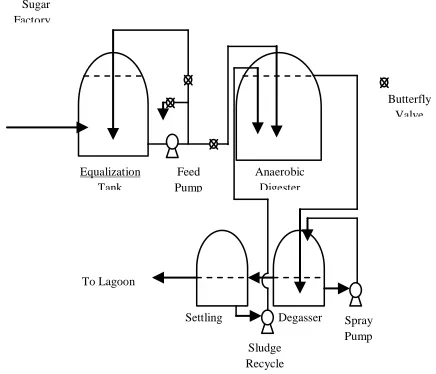
1) Project Setup
For this project, a setup as mentioned in Fig.2.4 was installed within the plant premises for the treatment of the sugar factory effluent. The filter media of the type mentioned above was used in this reactor, and the volume of the media used was 1 m3. The tank is a syntex tank of capacity 1200 L. The wastewater was to be fed in a down flow manner by pumping from the top of the reactors. The inlet of the tank was connected to an Equalization Tank of capacity 1000 L. The connections were in CPVC Piping and the connections were made in such a manner so as to have an outlet for flow recording using bucket method. The Digester outlet was connected to a degasser tank of 500 L capacity, which in turn was connected to a settling tank of 750 L capacity.
Figure II Process Flow For Experimental Setup
a)Equalization Tank
The equalization system was used to obtain the sugar factory effluent which has a constant pH at the inlet, since the pH of incoming effluent was extremely variable, and therefore, pH adjustment before the procedure was necessary. Hence an equalization tank of 1000 L Capacity was used.
b)Biodigester System
[image:4.612.49.283.376.564.2]International Journal of Emerging Technology and Advanced Engineering
Website: www.ijetae.com (ISSN 2250-2459,ISO 9001:2008 Certified Journal, Volume 4, Issue 10, October 2014)
247
c)Degasser
By discussions with some environmental professionals working in the field like Shri. Dashrath from Logan Hydrosystems, Shri. Bhushan Zarapkar from ATE, Mumbai, it was observed that the biodigester outlet contains entrapped gases like Ammonia and Hydrogen sulfide, which can have a significant interference in the COD values. Hence a mechanism called degasser is utilized which operates on the principle of release of gases from the effluent by means of agitation by either blower based sparging or simple spray subjection which releases the entrapped gases. The degasser on the advise of the above professionals was used which had a capacity of 250 L.
d)Settling
Since the work was being carried out in Biological mode, biomass concentration maintenance was critical. Hence a small tank was provided to operate as a settling unit from which sludge was recycled. Again, with the advise of the field professionals, 100% sludge recirculation was used.
2) Media in the Filter
The media that are used in this study were of two types. These are specially designed for biological media based systems. The media used were Cross Flow Fixe Media and Random floating Media. Cross-flow media provides a cost effective method for reducing of organics (Roughening and polishing), nitrification, denitrification, and anaerobic treatment of the wastewater. The modules are fabricated and rigid, non – flammable PVC Sheets, UV Protected and resistant to rot, fungi / bacteria, acids and alkalis that may be present in the wastewater.
As per the provided information by the media block supplier, each sheet in the module is completely corrugated at an angle of 600 from the horizontal and assembled in a cross – corrugated pattern with the adjacent sheets, creating a minimum of 96% void – to – volume ratio. This configuration provides continuous and uniform horizontal distribution of the wastewater throughout the full media depth, thereby enhancing the contact between the wastewater and the media biofilm.
[image:5.612.325.565.135.296.2]These support media are similar to those in the trickling filters, except that they are submerged. The high void ratio of the materials substantially reduces the risk of clogging, while the relatively developed high surface area allows variation in loadings satisfactorily.
Figure III Fixed Film Media Block With Dimensions
The random floating media used has a surface area which is significantly higher than the floating media. The
media surface area ranged between 350 – 450 m2/m3. Also,
the void ratio of the media is more than 90%. This media is typically used in reactors like FAB (Fluidized Air Bed) Reactor which is an Aerobic System. However, in operations similar to anaerobic filters, this media may be used in the anaerobic units as well. This media has Protected Surface Area to Total Surface area ratio ranging
between 85 – 95% while the weight is 0.35 Kg/m2.
Figure IV Floating Film Media
3) Planning of the Experiment
[image:5.612.351.535.447.621.2]International Journal of Emerging Technology and Advanced Engineering
Website: www.ijetae.com (ISSN 2250-2459,ISO 9001:2008 Certified Journal, Volume 4, Issue 10, October 2014)
248
Hence the setup was installed in the last week of month of November. Further, the stabilization of the reactor using Cow dung, urea and DAP was carried out in December. Analysis of the data was carried out at the Karkhana Laboratory using standard procedure for pH and COD. The kinetics of the system in the form of Organic loading variation was studied, and suitable changes made to the system for optimum loading rate.
4) Materials and Methods
The set-up described earlier was used for the whole study. The input flow was regulated on the basis of the organic loading to be provided to the system, and therefore, it was carried out in a gradual manner. The pumping was done through the help of a bucket flow method measurement in order to gauge the total volume of effluent being subjected to the reactor per day. The parameters analyzed during the period were pH, COD. The analysis was carried out on the basis of the guidelines provided by the APHA. The methods used for the analysis of parameters were as follows.
TABLE III ANALYTICAL METHODS
Sr.
No Parameter
Method used for
Analysis
1. pH Electrometric Method 2. COD The digestion of the
samples was carried out using COD Digestion Apparatus.
5) Procedures followed during the Study
The procedure was carried out in two phases. The first phase consisted of Stabilization of the Digester by the addition of nutrients and culture quantities, and the second phase consisted of the actual study. During the period from January 2014 to April 2014, i.e. after the Stabilization period in December, the readings were noted on every 3rd Day of the study. Once the readings were assessed, suitable changes were made to the loading cycles and the loading was continued for the next 3 days.
6) Commissioning of the Anaerobic Digester
In order to study the varied loading rates, it was first necessary to acclimatize the microbial biomass to the sugar factory effluent characteristics.
In the current study, a stabilization period of 15 days was found to be sufficient. For the present study, cow dung was used for the seeding and stabilization of the unit, along with the required nutrients in the form of DAP and Urea. The Stabilization process was closely monitored with particular emphasis on the pH of the digester..
7) Performance study and Optimization of Kinetics
The stabilization period was followed by the actual practical study, wherein, for experimentation using the different media, the loading was increased in a sequential manner up to the point after which the system began to lean towards the destability state again, which was depicted by the sudden decrease in the efficiency of the filter. Once a suitable range of loading rate was established, minor variations were made to freeze the most suitable range of loading rate at which the efficiencies tended to be maximum and constant in nature. The data was recorded in well-defined tabular format with sufficient entries of data enabling conclusive determination of kinetics of reaction.
Regular analysis of the effluent was carried out in order to observe the health of the Condensate and Spentleese treatment scheme. The cumulative results analysis is as given below.
IV. DATA ANALYSIS
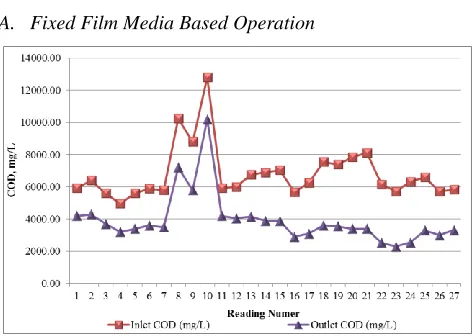
[image:6.612.50.266.391.495.2]A. Fixed Film Media Based Operation
[image:6.612.325.563.433.601.2]International Journal of Emerging Technology and Advanced Engineering
Website: www.ijetae.com (ISSN 2250-2459,ISO 9001:2008 Certified Journal, Volume 4, Issue 10, October 2014)
[image:7.612.59.398.104.585.2]249
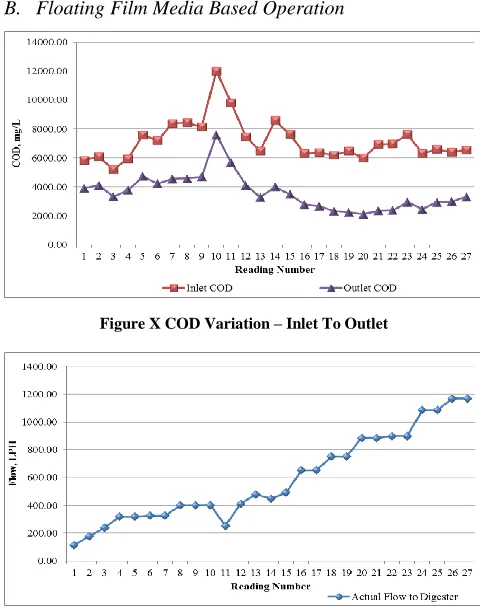
Figure VI Flow Subjected To Biodigester
Figure VII Loading Rate Subjected To Biodigester
Figure VIII Observed Biodigester Efficiency
Figure IX Efficiency Vs. Loading Rate
[image:7.612.322.562.294.601.2]B. Floating Film Media Based Operation
Figure X COD Variation – Inlet To Outlet
International Journal of Emerging Technology and Advanced Engineering
Website: www.ijetae.com (ISSN 2250-2459,ISO 9001:2008 Certified Journal, Volume 4, Issue 10, October 2014)
[image:8.612.49.288.122.418.2]250
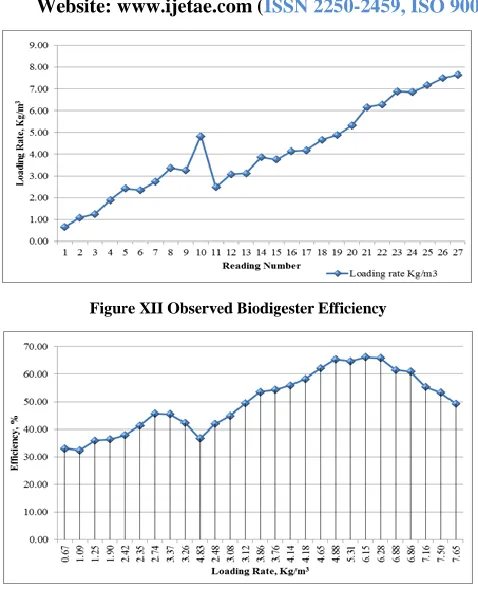
Figure XII Observed Biodigester Efficiency
Figure XIII Efficiency Vs. Loading Rate
C. pH
pH (Potentia Hydrognii) is nothing but the measure of the hydrogen ion activity of a solution. Acidic and alkaline conditions which are present in any water and wastewater samples, can contribute significantly to the changes in the characteristics of the effluent. pH measurement on the present project was carried out using an electronic based pH equipment (Make – Labtronics). The method for the standardization of the instrument was as per the manufacturer directions.
There were definite observations in the pH range of the effluent from digester, wherein it was observed that the pH dropped consistently when the loading increased due to sudden changes in COD. This drop was continuous and therefore, demonstrated conditions of destabilization of digester, and thereby demonstrated that the acetogenic reaction was dominating the system, due to which the methanogenic phase was dormant.. Similarly, when the digester functioning was optimum, the pH of the digester remained in the range of 7.2 – 7.5 with very less addition of any neutralizing agent.
This suggested that the methanogenic activity was
working efficiently, thereby achieving successful
conversion of the organic load to methane and CO2.
D. COD
The Chemical Oxygen Demand test is widely used as a means of measuring the organic strength of domestic and industrial wastes. This test allows measurement of a waste in terms of the total quantity of oxygen required for oxidation to carbon dioxide and water. It is based on the fact that all organic compounds, with a few exceptions, can be oxidized by the action of strong oxidizing agents under acidic conditions. The COD at inlet and outlet were more or less in the range of 6000-10000mg / L (Fig. 3.1).The variations in the COD are a typical characteristic of sugar factory effluent, since, in addition to the mill house washing, monthly washing which is carried out periodically contributes higher loads. Also, sometimes, the raw juice also joins the stream due to accidents or discarding processes, because of which the COD can shoot up. Naturally, in absence of a suitable Equalizer Tank, these
variations can cause significant damage to the
bacteriological processes operating in the treatment schemes. In the present study, the procedure for COD Estimation was the Open Reflux Method suggested in the Standard Methods for Water and Wastewater Analysis by APHA, Edition 20th.
E. Loading Rate
Loading rate can be defined as amount of organic load (Kg) subjected to the volume (m3) per day. This loading rate changes from designer to designer and with every effluent combination. Generally, field practitioners may take loading rates as high as 12 Kg/m3.day to as low as 3 Kg/m3.day. However, these variations have their own disadvantages. For instance, higher loading rates can mean more extensive monitoring of the process, since; destabilization is more possible in such scenarios, as the COD does not remain constant every day. This also affects the efficiency of COD Reduction. On the other hand, when low loading rates are taken, they significantly increase the efficiency of COD reduction, but at the same time, they have a drastic impact on the size of design, thereby having cost – intensive project requirements.
In the present project, the main aim was to test the working of the digesters for variable COD loading rates, and therefore, variations in loading rates were carried out at a rate of 0.5 – 0.75 Kg/m3/day change. This change was carried out every two days.
F. Efficiency
International Journal of Emerging Technology and Advanced Engineering
Website: www.ijetae.com (ISSN 2250-2459,ISO 9001:2008 Certified Journal, Volume 4, Issue 10, October 2014)
251
These readings were recorded, and it was observed that the efficiency of the digester system based on Fixed Film Media Based Operation was in the range of 56 – 59% COD removal, and the same was 65 – 68% for Floating Film Media Based Operation.
G. Troubleshooting
During the experiment, several practical problems were observed and therefore, certain methods for coping with them were tried. These methods were necessary to have constant efficiency and to avoid failure the experiment. The troubleshooting methods for digester control for the various parameters were as follows.
1) pH Drop: This was an indication of failure / souring of digester which is also called as Destabilization. This condition occurs when acetogenic bacterial activity increases drastically and thereby a decrease in the pH is observed. This decrease in pH can have a significant impact on the Methanogenic bacteria which operate in near neutral conditions. Therefore, a constant track of pH was kept and following control measures were carried out.
1.If pH drops suddenly, stop loading, observe the
system for 30 minutes, check the pH to see whether there is a rising trend. If not, manually bring the pH in the desired range using neutralizing agents.
2.If the pH trend is dropping continuously, reduce loading rate and observe for changes. If the trend changes continue with the changed loading, else follow the steps as above.
2) COD
a)Changes in COD can be observed only after the
analysis. Therefore, any changes which are necessary should be done on the observation of the analysis results.
b)If there is sudden shock load in the COD analysis, immediately stop the loading. Gauge the required COD Load to be subjected based on the changed COD, adjust the flow rate and restart the system.
c)If the COD was lesser than expected, and the loading
rate desired is not achieved, the flow rate may be modified in such a manner so as to obtain the required loading rate range.
V. MATHEMATICAL MODEL DEVELOPMENT
The obtained data gave a clear idea regarding the parameters of the Sugar Factory effluent and the behavior of the Fixed Film and Floating Film Media in the changing rates of loading.
To make these observations suitable for future designers as a benchmark for proper and efficient design, it was proposed to develop a mathematical model for rate constants using the model developed by previous researchers.
During the study, different mathematical models were observed, and finally a model based on Modified Velz Equation used by two researchers for different effluents were selected as the models for development of Treatability Constant and Reaction Rate Constant. (Leong et.al., 2011; Apte S. S., 2012)
A. Development of Mathematical Model
From the study, the Modified Velz equation was adopted as a baseline model due to the fact that it bore the closest relevance to the project under consideration. On the basis of this model as a base, several more models were studied and finally, an Eqution developed by Germain (1966) and Schultz (1960) was adopted, which has a similarity with the modified Velz equation. The equation that was stated by the above mentioned scientists is as follows:
1) Treatability Constant
Where,
Se = Total BOD5 of Settled Effluent from the Digester, mg / L
Si = Total BOD5 of wastewater subjected to the Digester, mg / L
k = Treatability Constant, (L/sec)n.m D = Depth of the Media, m
Q = Volumetric Flow Rate, L/sec
Qv = Volumetric Flow Rate applied per unit volume of digester,
L/m2.sec
A = Cross-sectional area of the filter, m2 n = experimental constant, usually 0.5
2) Reaction Rate Constant
Where,
K = Observed reaction rate constant for a given depth of the digester, m / day
D = Depth of the digester, m
International Journal of Emerging Technology and Advanced Engineering
Website: www.ijetae.com (ISSN 2250-2459,ISO 9001:2008 Certified Journal, Volume 4, Issue 10, October 2014)
252
=
Qv = Volumetric Flow Rate applied to the digester, m 3
/m2.d Q = Flow Rate applied to the digester, m3/d
A = Cross-sectional area of the digester, m2 m, n = empirical constants
B. Testing and Application of the Developed Mathematical Model
The mathematical models that were developed from the above process were applied to the practical data which was obtained during the study. The results of the model were back-calculated and the models were tested for their applicability. From this procedure, it was observed that the models gave accurate results when applied to Anaerobic Digester based on either Fixed Film Media Based Operation or Floating Film Media Based Operation for Sugar Factory Effluent. The model-wise inferences are as described below.
1) Filter Treatability Constant
The main objective behind deriving the Filter Treatability Constant was to obtain a specific value k for testing the performance of an anaerobic filter while treating distillery condensate. The value obtained for Filter Treatability Constant in the present study was
Fixed Film Media Based Operation: 1.2 x 10⁻² (L/sec)n.m.
Floating Film Media Based Operation: 1.4 x 10⁻² (L/sec)n.m.
It is to be noted that when this constant value is applied to the above equation, while the other parameters are known, it is possible to design an anaerobic Digester for sugar factory effluent treatment for different depths, different inlet COD concentrations (When a certain depth is assumed), different outlet COD concentrations (When certain depth is assumed and Inlet COD Concentration is known). By applying this constant, a benchmark can be set for further design studies of anaerobic filter for treating distillery condensate.
2) Reaction Rate Constant
Rate of Reaction is the rate at which the reaction proceeds. The rate constant for every reaction may be different.
In the present study, the main objective behind deriving the Reaction Rate Constant was to obtain a specific value K for testing the rate of reaction of an anaerobic digester based on Fixed Film Media Based Operation and Floating Film Media Based Operation at different depths while treating distillery condensate. The value obtained for Reaction Rate Constant in the present study was
Fixed Film Media Based Operation: 1.14 x 10⁻² m / day.
Floating Film Media Based Operation: 6.678 x 10⁻³ m / day.
It is to be noted that when this constant value is applied to the above equation for Reaction rate constant, the rate of reaction for different depths of a digester may be obtained. By applying this constant, a benchmark can be set for further reaction rate studies for anaerobic digester based on Fixed Film Media Based Operation and Floating Film Media Based Operation.
VI. CONCLUSIONS
The present project was aimed at checking the feasibility of Fixed Film Media and Floating Film Media for Biodigester system in sugar factory effluent treatment and optimizing the kinetics of the systems. The experiment was taken up for the sole purpose of assessing the suitability of filter media for better effluent treatment efficiency of digesters. As this experiment was carried out on a practical scale, the database that was generated from the study gave results which were actually observed on site. The conclusions that are drawn based on the present study are as follows;
1. Filter media can be effectively utilized in the
Biodigester systems for Sugar factory effluent treatment in order to achieve better results.
2. The Optimum Loading Range for an Anaerobic
Digester using Fixed Film Media is 5.38 – 5.97 Kg COD / m3.day
3. The Optimum Loading Range for an Anaerobic
Digester using Floating Film Media is 6.15 – 6.86 Kg COD / m3.day
4. The Average Performance efficiency of an Anaerobic
Digester using Fixed Film Media was 58.59%, and when operated within the Optimum Loading range, the performance efficiency ranges in between 56 - 60%
5. The Average Performance efficiency of an Anaerobic
International Journal of Emerging Technology and Advanced Engineering
Website: www.ijetae.com (ISSN 2250-2459,ISO 9001:2008 Certified Journal, Volume 4, Issue 10, October 2014)
253
6. By application of mathematical models suitably
designed for Sugar Factory Effluent based on Fixed and Floating Media, designing of an Anaerobic Digester for variable depths and variable efficiency criteria is possible.
7. The Treatability Constant for Anaerobic Digester using
Fixed Film Media for Sugar Factory Effluent Treatment is 1.2 x 10⁻² (L/sec)n.m.
8. The Treatability Constant for Anaerobic Digester using
Floating Film Media for Sugar Factory Effluent Treatment is 1.4 x 10⁻² (L/sec)n.m..
9. The treatability constant varies with the depth of the filter.
10. The Reaction Rate Constant for Anaerobic Digester
using Fixed Film Media for Sugar Factory Effluent Treatment is 1.14 x 10⁻² m / day.
11. The Reaction Rate Constant for Anaerobic Digester
using Floating Film Media for Sugar Factory Effluent Treatment is 6.678 x 10⁻³ m / day
12. The reaction rate constant for anaerobic filter may vary
with depth.
13. From the above, it may be concluded that the Floating
Film Media has a better advantage over fixed film media for utilization in treatment of sugar factory
effluent using biodigester mode. The salient
advantages are as below. a. Increased Surface area
b.Decreased Volume Requirement due to increased
surface area.
c. Subsequently, decreased capital investment
d.Better efficiency e. Higher reaction rate
REFERENCES
[1] Apte S. S., 2011, Anaerobic Filter for Distillery Condensate Treatment – Optimization of Anaerobic Filter System for Distillery Condensate Generated from Volume Reduction of Spentwash, LAP Lambert Academic Publishing GmbH & Co. KG, ISBN: 978-3-8473-4713-2
[2] Baez – Smith C., 2006, Anaerobic Digestion of Vinasse for Production of Methane in the Sugar Cane Distillery, Proceedings of SPRI Conference on Sugar Processing.
[3] Biswas J., Chowdhury R. and Bhattacharya P., 2006, Experimental studies and mathematical modelling of a semibatch bio-digester using municipal market waste as feedstock, Indian Journal of Biotechnology, Vol. 5, pp. 498 – 505.
[4] Bortone G., 2009, Integrated anaerobic / aerobic biological treatment for intensive swine production, Bioresource Technology, Elsevier Publication, Vol. 100, pp. 5424 – 5430.
[5] Buswell A.M., Hatfield W.D., 1936, Bulletin 32, Anaerobic Fermentations, Urbana IL, State of Illinois Department of Registration and Education
[6] Chen Y. and Cheng J. J., 2005, Anaerobic Processes in Waste Treatment, Water Environment Research, Water Environment Federation Publication, Vol. 77(6), pp. 1347 – 1388.
[7] Dewalle F. B., and Chian E. S. K., Kinetics of Substrate Removal in a Completely Mixed Anaerobic Filter, Biotechnology and Bioengineering, 189: 1275 – 1295.
[8] Edelmann W., Baier U. and Engeli H., 2004, Performance of a dynamic pulsating anaerobic filter while treating industrial wastewaters including a comparison with UASB reactor.
[9] EPA, 1976, Anaerobic Sludge Digestion Operation Manual, Office of Water Program Operations, United States Environmental Protection Agency Publication.
[10] Garcia – Ochoa F., Santos V. E., Naval L., Guardiola E., Lopez B., 1999, Kinetic model for anaerobic digestion of livestock manure, Enzyme and Microbial Technology, Elsevier publications, Vol. 25, pp. 55 – 60.
[11] Government of Gujarat, 2004, Gujarat Agro Industrial Policy and Beyond.
[12] Jayamanne A., 2010, Novel Biogas Technology for Wastewater Treatment with Methane Production.
[13] Johns M., Greenfield P., 1999, Design and Operation of Wastewater Treatment Ponds, course notes – Sydney.
[14] Joung J. Y., Lee H. W., Choi H., Lee M. W., Park J. M., 2009, Influences of organic loading disturbances on performance of anaerobic filter process to treat purified terapthalic acid wastewater, Bioresource Technology, Elsevier Publications, Vol. 100, pp. 2457 – 2461.
[15] Kachru R. P., 2006, Agro – Processing Industries in India – Growth, Status and Prospects.
[16] Krylow M., Tal – Figiel B., 2004, Kinetics of Anaerobic Process. [17] Lee M. W., Lee H. W., Joung J. Y. and Park J. M., 2006, Modelling
and simulation of anaerobic filter process: two – dimensional distribution of acidogens and methanogens, Studies in Surface Science and Catalysis, Elsevier Publication, pp. 129 – 132. [18] Leong S. K., Chang S. H., Kassim N. A. and Nasuha N., 2011,
Determination of Treatability Constant and Reaction – rate Constant for Attached – Growth Upflow Fixed – Film Reactor on Pulp and Paper Wastewater Treatment, International Journal for Chemical Engineering and Applications, IACSIT (International Association of Computer Science and Information Technology) Publication, Vol. 2(1), pp. 14 – 19.
[19] Lier J. B. V., 2006, Anaerobic Industrial Wastewater Treatment; Perspectives for Closing Water and Resource Cycles, FEISST. [20] McCarty P. L., and Young J. C., 1967, The Anaerobic Filters for
Waste Treatment, Proceedings of 22nd Purdue International Waste Conference, Ann. Arbor Science Publishers Inc., Ann. Arbor. [21] MoEF, 2009, Technical EIA Guidance Manual for Distilleries. [22] Moosbrugger R. E., Wentzel M. C., Ekema G. A., Marais G. R.,
1994, A Titration Method with 5 pH Points for Determining the Carbonate and SCFA Weak Acid/Bases in Anaerobic Systems. Proceedings 7th International Symposia on Anaerobic Digestion - South Africa, p. 223.
International Journal of Emerging Technology and Advanced Engineering
Website: www.ijetae.com (ISSN 2250-2459,ISO 9001:2008 Certified Journal, Volume 4, Issue 10, October 2014)
254
[24] Rajakumar R., Meenambal T., Rajesh Banu J., Yeom I. T., 2011, Treatment of poultry slaughterhouse wastewater in an upflow anaerobic filter under low flow velocity, International Journal for Environmental Science and Technology, IRSEN, CEERS, IAU, Vol. 8(1), pp. 149 – 158.
[25] Saleh M. M. A. and Mahmood U. F., 2004, Anaerobic Digestion Technology for Industrial Wastewater Treatment, Proceedings of the Eighth Water Technology Conference, Alexandria Egypt.
[26] Santhananthan S., Ching N. L., Ling T. M., Jeyaseelan S., 2009, Development of Mathematical Model for Anaerobic Digestion by Phase Separation.
[27] Sarti A., Foresti E., Zaiat M., 2004, Evaluation of a Mechanistic Mathematical Model of a Packed – Bed Anaerobic Reactor Treating Wastewater, Latin American Applied Research, Vol. 34, pp. 127 – 132.
[28] Srisertpol J., Srinakorn P., Kheawnak A., Chamniprasart K. and Srikaew A., 2010, Estimation Dynamical Model of an Anaerobic Digestion of Shrimp Culture Pond Sediment in Biogas Process using Genetic Algorithm, System Science and Simulation in Engineering, pp. 449 – 453.
[29] Stover E. L., Reinagldo G., Gonathi N. G., 1984, Anaerobic Fixed Film Biological Treatment Kinetics of Fuel Alcohol Production Wastewater, Proceedings of 2nd International Conference on Fixed Film Biological Processes, pp. 1625.
[30] Sumi S., Mathew L., 2009, Influence of Media Packing Depth and HRT on Performance of Anaerobic Hybrid Reactors, 10th National Conference on Technology Trends, College of Engineering Trivandrum, pp. 38 – 41.