PREDICTING STUDENTS
’
PERFORMANCE THROUGH
CLASSIFICATION: A CASE STUDY
1
MASHAEL A. AL-BARRAK, 2MONA S. AL-RAZGAN
King Saud University, Riyadh, Saudi Arabia Email: [email protected] , [email protected]
ABSTRACT
Performance in academic courses is among the most important factors affecting the quality of higher education available to students. In this paper, we use data mining techniques, specifically classification, to analyze students’ grades in different evaluative assignments for a course on data structures. For this purpose, we compare three different classifiers using real data from King Saud University to predict students’ performances. We apply classification techniques to both numerical and categorized attributes. Our results show that the model based on the Naïve Bayes algorithm provides the most accurate predictions. In addition we were able to obtain a model with a 91% accuracy to predict students failure in the course.
Keywords: Educational Data Mining, Classification, Prediction, Naive Bayes, JRip
1. INTRODUCTION
Educational data available for analysis nowadays continues to grow rapidly. The need to study the massive amounts of data generated from the global educational ecosystem has spawned the field of educational data mining (EDM). EDM is the process of applying data mining tools and techniques to analyze data in educational institutions [1]. The application of data mining techniques to educational data will help the educational sector improve its learning process to better benefit students.
Example of data stored in databases maintained by educational institutions includes: enrollment data, students’ performances, teachers’ evaluations, gender differences, and numerous other measures. EDM can help universities better plan for the anticipated number of students enrolling in their programs, predict the dropout ratio, easily identify weak students, and make better use of available resources ranging from the number of faculties to the utilization of other resources. In addition, higher education assesses its students’ performances and progresses to improve its academic programs.
More recently, literature has evolved in the field of educational data mining because of its potential benefits to education [1]. Once these data have been correctly analyzed, they will help advance knowledge in the educational sector. This will help educational institutions assess, evaluate, plan, and decide their educational programs. This new knowledge is expected to reveal hidden patterns that
will assist academic programs utilize resources more effectively [2].
Academic programs typically evaluate students based on inner and outer assessment. Inner assessment consists of activities carried out during the semester, such as quizzes, midterms, projects, lab work, etc. Outer evaluation is based on students’ final scores [9].
The assessment of students is based on examinations, activities, and assignments during their courses. A student passes or fails a course based on the total points scored in a semester. Hence, the ability to specify prior to the final exam the students who are likely to fail a course can prompt additional remedial efforts by both the teacher and the student. These efforts can help struggling students succeed in their courses [9]. The evaluation can be applied by usual method of calculating the total points towards the end of the semester. Or it can be applied by data mining techniques.
One of the most important courses in
Information Technology department, King Saud University is the “Data Structures,” which has a high rate of failure. We gathered the data from two consecutive semesters in academic year of 2013-2014, 158 students were enrolled in the course. Since data structure course, has a high failure among IT students, we decided to use classification techniques to study students’ performance in this course. We will focus on students enrolled in the "Data Structures" course in order to answer the following questions:
- How to predict student performance on the final exam?
- How to forecast the total points obtained by each student toward the end of the course?
- Focus on failing students and how to predict students failure?
Our paper is organized as follows: Section 2 describes research that has been conducted in EDM. In Section 3, we describe our proposed process of building a model that includes data collection, data preparation and pre-processing, data visualization, the construction of a classification model. Section 4 provides the analysis of the results. We offer our conclusions and limitations in Section 5.
2. RELATED WORK
In recent years, there has been a noticeable rise interest in using data mining for educational purposes. Predicting students’ performances is among the promising areas of researches in education. The goals of relevant research are to improve the outcomes of learning and provide useful knowledge to faculties and administration.
Reference [3] attempts to predict student performance through data mining techniques by surveying 257 students in the Faculty of Economics in Tulza city. The output variable was success in the course “Business Informatics.” Each student was described according to demographics and the attributes of assessment results. The C4.5, Naïve Bayes, and the multilayer perception algorithms were used, and Naïve Bayes was found to generate the most accurate result according to student performance.
In a similar study, [4] predicted student performance using decision trees. The authors applied three decision tree algorithms to predict students’ final grades in the course “C++ programs.” Data was collected through a questionnaire distributed to undergraduate students of Yarmouk University in Jordan. They then selected the most relevant attributes using the gain ratio method. Then they applied Naive Bayes, ID3, and C4.5 algorithms
on the selected attributes. Their findings indicated that the overall accuracy of the method was low and the collected attributes were insufficient to classify students.
Decision tree algorithms were also used in [5] to predict student performance. The authors conducted an experiment where they applied the C4.5 and Iterative Dichotomizer 3 (ID3) classification algorithms to a dataset of students’ internal assessment. They predicted the results for a specific course in the final examination. Having built a tree for each, an assessment of both algorithms showed ID3 to be more efficient in terms of accuracy and time taken to build the tree.
Furthermore, [6] used classification techniques to predict students’ final grades in an online course at Michigan State University (MSU) based on their web uses features. The dataset was collected from the relevant web learning system for 227 students in an introductory physics course. After selecting the best features and normalizing them, the authors applied several classifiers, including the quadratic Bayesian classifier, nearest neighbor (1-NN), k -nearest neighbor (k-NN), the Parzen window, the multilayer perceptron (MLP), and several decision trees. Finally, to improve performance, they applied a combination of multiple classifiers and a genetic algorithm.
Along the same line of research, Romero et al. [7] applied various data mining techniques in order to classify students based on their data in a web-based course and their final grades in the course. They collected data from Cordoba University’s Learning Management System for 438 students for seven Moodle courses. The attributes included the number of assignments submitted, the number of quizzes taken, the number of quizzes passed, etc. The authors’ applied 25 different algorithms on the dataset three times for each algorithm: first on the original data, followed by the categorical data after the conversion of numerical attributes to categorical attributes. Having rebalanced the classes using a random over-sampling method, a comparison of the results showed that some algorithms improved their performance when discretizing and rebalancing data whereas others did not. Based on the results, the authors developed a data-mining tool to incorporate into the university’s Moodle system.
failed and passed students from the first four lessons
out of 12 total lessons of the course. Moreover, they performed regression analysis on passed students to predict their final scores. They conclude that K-NN has a high accuracy prediction of student performance. Also, an early examination is strong predictor for final grades.
Similarly, the authors in [9] performed discriminate analysis to predict the success and failure students in a specific physics course. Discriminate analysis is a similar technique to multiple regression except that it is used for categorized data. They used this technique to provide a function that contains the variables that should be used for predicting the performance of a student. They collected the data for 1622 students who enrolled in Electricity & Magnetism course, which has a high rate of failure. At first they identified many possible predictors such as: SAT grade, MATH GPA, Overall GPA. etc. After performing the analysis, they found only three predictors that had a better contribution to predict the student performance; overall GPA, grade in calculus course and grade in particle dynamics, which is the physics course previous to electromagnetism. Finally, to evaluate the function, they applied it to a new group of students entering the course. The function predicted 84% of passed students and 50% of failed students.
Most of the above studies used classification techniques to predict students’ performance or behavior for a course. Along the same lines, we will analyze one of the most difficult courses in the IT department according to student’s opinions.
3. BUILDING THE MODELS
3.1 Data Collection
Students’ data for the course “Data Structures” was collected from the Information Technology department at Kin Saud University, Saudi Arabia, for two consecutive semesters. A total of 170 records were initially collected. Having deleted data for withdrawn students, the remaining number of records was 158. Each student record had the following attributes: student ID, student name, student grades in quiz1, quiz2, and quiz3, midterm1, midterm2, project, tutorial, final exam, and total points obtained. The distribution of points for the course was 60 for a year’s work (which included quizzes {1, 2, 3}, midterms {1, 2}, tutorials, the project and the final lab) and 40 points for the final exam. A student must have obtained at least 60 out of 100 to pass the course.
3.2 Data Preparation and Pre-processing
Data pre-processing is among the common steps prior to applying any data mining technique. We applied the following steps to prepare the data:
- Eliminating the records of students who withdrew from the course because some of their relevant values were consequently missing.
- Discretizing the total grade attribute into five categories: A, B, C, D, and F.
- Discretizing all attributes of the semester into four categories: excellent, good, average, and poor.
After pre-processing the data, we ran the Waikato Environment for Knowledge Analysis (Weka) toolkit [10] to apply the classification algorithms. Weka was developed at the University of Waikato in New Zealand, and is very popular data mining software that contains a wide range of algorithms implemented in Java.
For our research purposes, we used two forms of data: real numerical values of all attributes except the class attribute under examination (final exam or total) to be categorized, and the second one after categorizing all remaining attributes.
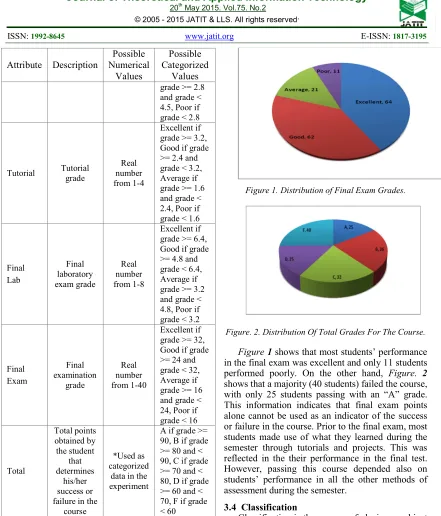
The description of the attributes in the final data is listed in table 1.
Table 1. Description Of Attributes In The Dataset
Attribute Description
Possible Numerical
Values
Possible Categorized
Values
Quiz 1, 2, 3
Quiz 1,2,3 grade
Real numbers from 1-5
Excellent if grade >= 4, Good if grade >= 3 and grade < 4, Average if grade >= 2 and grade < 3, Poor if grade < 2
Mid1, 2
First and second midterm exam grade
Real number from 1-13
Excellent if grade >= 10.4, Good if grade >= 7.8 and grade < 10.4, Average if grade >= 5.2 and grade < 7.8, Poor if grade < 5.2
Project Project grade
Real number from 1-7
Attribute Description
Possible Numerical
Values
Possible Categorized
Values grade >= 2.8 and grade < 4.5, Poor if grade < 2.8
Tutorial Tutorial grade
Real number from 1-4
Excellent if grade >= 3.2, Good if grade >= 2.4 and grade < 3.2, Average if grade >= 1.6 and grade < 2.4, Poor if grade < 1.6
Final Lab
Final laboratory exam grade
Real number from 1-8
Excellent if grade >= 6.4, Good if grade >= 4.8 and grade < 6.4, Average if grade >= 3.2 and grade < 4.8, Poor if grade < 3.2
Final Exam
Final examination
grade
Real number from 1-40
Excellent if grade >= 32, Good if grade >= 24 and grade < 32, Average if grade >= 16 and grade < 24, Poor if grade < 16
Total
Total points obtained by the student
that determines
his/her success or failure in the
course
*Used as categorized
data in the experiment
A if grade >= 90, B if grade >= 80 and < 90, C if grade >= 70 and < 80, D if grade >= 60 and < 70, F if grade < 60
3.3 Data Visualization
Having applied the pre-processing techniques to the dataset, we loaded it to the Weka software. We first attempted to analyze the data through visualization prior to applying any classification algorithm. Specifically, we wanted to observe the distribution of the grades in the final exam as well as the total points, as shown in Figure 1 and Figure. 2, respectively.
Figure 1. Distribution of Final Exam Grades.
[image:4.595.81.522.79.595.2]Figure. 2. Distribution Of Total Grades For The Course.
Figure 1 shows that most students’ performance
in the final exam was excellent and only 11 students performed poorly. On the other hand, Figure. 2 shows that a majority (40 students) failed the course, with only 25 students passing with an “A” grade. This information indicates that final exam points alone cannot be used as an indicator of the success or failure in the course. Prior to the final exam, most students made use of what they learned during the semester through tutorials and projects. This was reflected in the their performance in the final test. However, passing this course depended also on students’ performance in all the other methods of assessment during the semester.
3.4 Classification
Classification is the process of placing an object into a class or category [11].This process involves two primary steps [11], [12]:
1. Learning, where a set of training data is analyzed to build a model with a predetermined set of classes.
2. Testing, where a different set of data is tested to determine the accuracy of the model.
of other attributes (in our case, students’ final exams
and the final outcome of the course).
Many classification algorithms can be applied to an educational dataset, such as decision trees, neural networks, Naïve Bayes, and rule-based algorithms. We attempted to classify students’ performances using three classifiers: C4.5 decision tree (J48 in WEKA), Naïve Bayes, and the JRip rule-based algorithm.
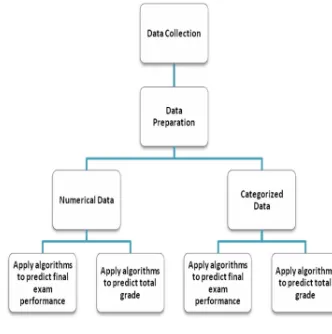
3.5 Research Framework
We designed a methodological framework to organize the steps of our procedure. Figure 3 shows this methodology, which was used to find the best model to predict students’ final exam grades and the final outcome of the course.
We ran the three classification algorithms for the two forms of the dataset (numerical and categorical) several times to predict final exam performance and final course outcome. We examined the accuracy of the resulting models using 10-fold cross-validation.
Figure 3. Research Framework
4. RESULTS AND DISCUSSION
4.1Predicting Students’ Final Exam
[image:5.595.126.292.357.524.2]4.1.1 Numerical dataset: The available attributes were quiz(1, 2, 3), midterm(1, 2), project, tutorial, final lab, and final exam grade. All assessments were in real numbers except for the final exam grades, which were categorized. The application of the Naïve Bayes algorithm to this dataset yielded an accuracy of 57.59%. Figure. 4 shows the distribution model for the attribute “quiz1” as an example.
Figure. 4. Final Exam Performance Prediction For Quiz 1 Using Naïve Bayes (Numerical Dataset).
We then applied the JRip rule-based algorithm to the dataset, which resulted in a four-rule prediction model with 56.32% accuracy. Interestingly, most of the rules predicted final exam performance based on scores on quizzes as follows:
IF Quiz3 <= 1.75 THEN Finalexam = Poor
IF Quiz2 <= 3 AND Quiz2 >= 2 and Quiz1 <=
2.6 AND Quiz1 >= 1.6 THEN Finalexam =
Average
IF Finallab <= 6.15 AND Quiz1 >= 2.5
THEN Finalexam = Good
IF Quiz2 <= 3.87 AND Quiz3 >= 4.17 AND
Mid1 <= 10.42 THEN Finalexam = Good
This model may not be very reliable because its accuracy is relatively low and the attributes may be insufficient to predict final exam grades.
The application of the J48 algorithm to the dataset resulted in a decision tree with an accuracy of 53.16% of correctly classified instances. The tree showed Quiz2 grades at the root node, which implies that this node is closely related to final exam performance. Therefore, the results of Quiz2 are important in predicting students’ performances. This quiz is usually posed mid-semester and can be used a measure of students’ understanding of the subject material. The tree is too large to be shown here, but below are some of the strongest rules extracted:
IF Quiz2 >3.5 AND Mid1 > 10.97 AND
Quiz3 > 3.78
THEN Finalexam = Excellent
IF Quiz2 >3.5 AND Mid1 <= 10.53 AND
Finallab > 5.67
THEN Finalexam = Excellent
IF Quiz2 >3.5 AND Mid1 <= 10.9 AND
Finallab <= 5.67
THEN Finalexam = Good
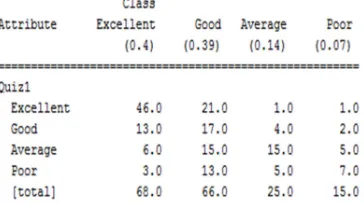
The model generated by the application of [image:6.595.99.281.190.292.2]
Naïve Bayes yielded an accuracy of 58.22%, which was slightly higher than numerical attribute. The classifier model for the attribute “quiz1” is shown in Figure. 5.
Figure. 5. Final Exam Performance Prediction For Quiz 1 Using Naïve Bayes (Categorical Dataset).
Five rules were generated following the application of the JRip algorithm, which was 49.36% accurate. The resulting rules were:
IF Quiz3 = Poor
THEN Finalexam = Poor
IF Quiz1= Average AND Finallab=Average
THEN Finalexam = Average
IF Mid2=Good AND Project= Average
THEN Finalexam = Good
IF Quiz2 = Good THEN
Finalexam = Good
IF Mid1 = Average THEN
Finalexam = Good
Interestingly, the resulting tree had the same accuracy as the corresponding numerical dataset tree (53.16%). The root node was also the “Quiz2” attribute, which emphasizes the affect of this evaluation on the final exam. Some of the strongest rules produced from the tree were:
IF Quiz2 = Excellent AND Mid2=Excellent
AND Finallab= Excellent THEN Finalexam =
Excellent
IF Quiz2 = Average AND Finallab=Poor
THEN Finalexam=Good
IF Quiz2 = Poor THEN Finalexam=Good
4.2 Predicting Students’ Total Points
4.2.1 Numerical dataset: The dataset in this experiment contained the following numerical attributes: quiz(1, 2, 3), midterm(1, 2), project, tutorial, final lab, final exam grade, and the categorized class attribute total (as excellent, good, average, or poor).
The prediction model after applying Naïve Bayes recorded 81.02% accuracy. This was the highest of all models used in our experiments.
Therefore, we recommend using this model to predict the total outcome of the course in the future.
Fig. 6 shows the distribution model for the “quiz1”
attribute as an example.
Fig. 6. Final Grade Prediction For Quiz 1 Using Naïve Bayes (Numerical Attributes).
After applying the JRip algorithm to the same dataset, seven rules were generated, as shown in Figure. 7. The accuracy of this model was 55.06%.
(Mid2 >=11.16) and (Quiz1 >= 4.64) and
(FinalExam >= 34.25) Total = A
(FinalExam >= 36.5) and (Mid1 >=11.83) Total
= A
(Finallab <=6.5) and (Quiz1>=2.69) and (Mid2 <= 9.02) and (Quiz2 <= 3.4) and (Mid1 >= 6.15)
Total = D
(Quiz2 <= 3.6) and (Mid2 >= 9.27) and (Tutorial
<= 3.6) Total= D
(Quiz2 >= 3.2) and (Mid1 <= 10.9) and (Finallab
<= 6.62) Total = C
(Finallab >= 6) and (Project <= 4.85) and (Quiz3
>= 4.25) Total=C
(Quiz1 >= 3.04) and (FinalExam >= 29.5) Total
= B
Figure. 7. JRip algorithm rules on numerical attributes to predict total grades.
In the subsequent step, we applied the J48 algorithm to the dataset. “Quiz2” appears at the root of the tree, which indicates the high correlation between scores on this quiz evaluation and the final grade of the course. The resulting tree had 70.88% accuracy. Some of the strongest rules were extracted from the tree as:
IF Quiz2 <= 3 AND Finalexam <=33 AND
Mid1 <=6.11
THEN Total = F
IF Quiz2 > 3 AND Finalexam >33.75 AND
Mid1>10.92 AND Quiz1>4.47 THEN Total= A
4.2.2 Categorized dataset:
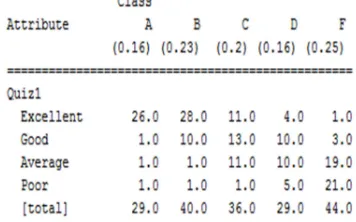
applying Naïve Bayes was 75.94%. Figure. 8 shows [image:7.595.101.279.153.264.2]
the resulting model for the “Quiz1” attribute.
Figure. 8.Final Grade Prediction For Quiz-1 Using Naïve Bayes (Categorized Attributes).
Eleven Rules were generated after the application of the JRip algorithm to the dataset. The accuracy of the model was 53.79% and some of the rules are shown below.
IF FinalExam=Good And Quiz2=Average and
Mid2=Good Then Total=D
IF FinalExam=Averag) And Quiz1=Good Then
Total=D
IF Mid1=Excellent And Mid2=Excellent And
Finallab=Excellent And Tutorial=Excellent Then
Total=A
IF Mid1=Good And Mid2=Good And Quiz1=Good
And FinalExam=Good Then Total=C
IF Mid1=Good And Quiz1=Average And
Project=Good
Then Total=C
In the final experiment, we applied the J48 algorithm to the dataset. The resulting tree had “mid1” as its root node, and the accuracy of this model was 62.02%. Some of the strongest rules extracted from the tree were:
IF Mid1= Poor THEN Total=F
IF Mid1= Average AND Quiz2=Poor THEN
Total=F
IF Mid1=Good And Finalexam=Good THEN
Total=C
4.3 Summary of Accuracy of Models
The accuracies of all generated models are summarized in table 2 in order for us to choose the best classifier to predict final exam performance and final grades.
Table 2 Accuracy of All Tested Models
Algorithm
Final Exam Predication
Total points Prediction
Numerical Dataset
Categorical Dataset
Numerical Dataset
Categorical Dataset
Naïve
Bayes 57.59% 58.22% 81.01% 75.94%
JRip 56.32% 49.36% 55.06% 53.79%
J48 53.16% 53.16% 70.88% 62.02%
As shown in the table, the Naïve Bayes algorithm exhibited the highest accuracy in all cases. Hence, the Naïve Bayes classifier is the best to predict final exam performance applied to categorize attributes. However, the accuracy of the models in predicting final exam outcomes is relatively low, which indicates that the collected data and attributes are insufficient to generate a reliable model with high accuracy. For students’ total score in the course, Naïve Bayes generated a high accuracy by using the numerical dataset, which can be used in the future to predict students’ performance.
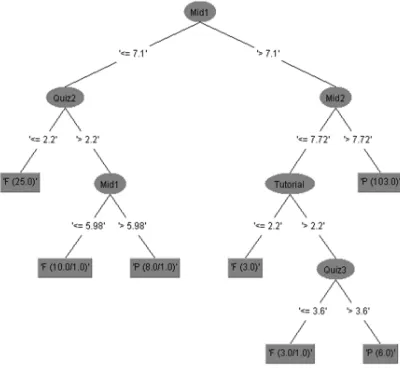
4.4 Predict Students Failure
In our Final experiment, the objective was to predict students’ failure based on their performance in different assessments through the semester. In order to answer that we need to build an accurate model that can classify failing students from students who passed the course. These findings will present useful knowledge on which specific assessment has the most affect on students' total points. In this part, we used the J48 and JRip on the numerical data set to predict the total marks of the students. This is because: these algorithms produce more accurate models on numerical data set based on our previous experiments summarized in table II to predict the total scores; also, these algorithms are considered as White box algorithms [13] which models obtained from them produce IF-THEN classification or prediction rules. These rules are easy to understand from any non-expert user, such as an instructor, to identify weak students and provide appropriate assistance. We prepared the data set to predict the total grades of the students as early as possible before the final exam, therefore we followed the following steps:
1. Remove the final exam grades from the data set
2. Re-categorized the total marks of the students into "F" for students who failed the course and have a total points less than 60, and "P" for students who passed the course with 60 or more total points.
Step two was done because we want to reduce the number of classes to eliminate error which will result in a better accuracy model [6] .
accuracy was 89.8%, which can be used to predict [image:8.595.93.293.168.353.2]
the students failure.
Figure 9 Resulted J48 tree to Predict Students’ Failure
A more accurate model was produced after applying the JRip algorithm to the dataset, the following rules were generated:
IF Mid1 <= 6.1 THEN Total=F
IF Quiz1 <= 2.67 AND Tutorial <=3 THEN
Total = F
IF Quiz1 <= 2.86 AND Quiz3<=3.6 THEN
Total = F
This model reached a very high accuracy of 91% .It shows from the model, an instructor can easily predict failing students after the first midterm exam. This emphasizes the importance of this midterm-I exam and allows enough time to help weak students and prevent them from failing the course.
5. CONCLUSION AND RESEARCH LIMITATION
In this paper, we analyzed students’ academic performance to help improve the quality of the education imparted to them. In numerous experiments, we tested the accuracies of different classification algorithms in predicting student performance in a specific course based on their grades in the evaluative components during the semester. The aim of our case study was to find the best classifier to predict students’ performance on the final exam and the total points obtained in the course “Data Structures.” We applied three classification algorithms, Naïve Bayes, the JRip rule-based algorithm, and the C4.5 decision tree. The dataset was in two forms; real numbers and categorized attributes. We tested the models to determine their accuracy, and the results showed
that Naïve Bayes was the most accurate in predicting both final exam performance and final course grades. Also, we analyzed the failing students attributes and discovered the most important evaluation is midterm-I grades as strong predictor for the final failing grade. and we were able to build a 91 % accuracy model to predict failing students earlier before the final exam.
The data used in this research is for female students grades in a one year period. In order to obtain more accurate results, female and male students data should be analyzed for more than one year. Moreover, This experiment can be applied to more than another course, such as programming courses, to analyze students behavior and predict their performance.
ACKNOWLEGMENT
We would like to thank Mariam Al-Otaibi and Lama Al-Hammad for their efforts on suggesting this course for investigation, and their validation of the rules of failing students.
REFERENCES
[1] M. Al-Razgan, A. Al-Khalifa, and H. Al-Khalifa, “Educational Data Mining: A Systematic Review of the Published Literature 2006-2013,” in Proceedings of the First International Conference on Advanced Data
and Information Engineering (DaEng-2013),
vol. 285, T. Herawan, M. M. Deris, and J. Abawajy, Eds. Springer Singapore, 2014, pp. 711–719.
[2] F. Siraj and M. A. Abdoulha, “Mining enrolment data using predictive and descriptive approaches,” Knowledge-Oriented
Applications in Data Mining, pp. 53–72,
2007.
[3] E. Osmanbegovi and M. Sulji, “Data mining approach for predicting student performance,”
Journal of Economic and Business, vol. X,
no. 1, 2012.
[4] Q. A. Al-Radaideh, E. M. Al-Shawakfa, and M. I. Al-Najjar, “Mining Student Data Using Decision Trees,” in The 2006 International Arab Conference on Information Technology
(ACIT’2006), 2006.
[5] S. A. Kumar and M. Vijayalakshmi, “Efficiency of decision trees in predicting student’s academic performance,” in First International
Conference on Computer Science,
Engineering and Applications, CS and IT,
[6] B. Minaei-Bidgoli, Deborah A Kashy, G.
Kortmeyer, and W. F. Punch, “Predicting student performance: an application of data mining methods with an educational web-based system,” in 33rd ASEE/IEEE Frontiers
in Education Conference, 2003, vol. 1, p.
T2A–13.
[7] C. Romero, S. Ventura, P. G. Espejo, and C. Hervas, “Data Mining Algorithms to Classify Students.,” in International Conference for
Educational Data Mining, 2008, pp. 8–17.
[8] T. Tanner and H. Toivonen, “Predicting and preventing student failure–using the k-nearest neighbour method to predict student performance in an online course environment,” International Journal of
Learning Technology, vol. 5, no. 4, pp. 356–
377, 2010.
[9] E. W. Thomas, M. J. Marr, A. Thomas, R. M. Hume, and N. Walker, “Using discriminant analysis to identify students at risk,” in
Frontiers in Education Conference, 1996. FIE ’96. 26th Annual Conference., Proceedings of, 1996, vol. 1, pp. 185–188 vol.1.
[10] E. Frank G. Holmes B. Pfahringer P. Reutemann M. Hall and I. H. Witten, “The weka data mining software: an update,” in
Special Interest Group on Knowledge
Discovery and Data Mining. SIGKDD, 2009.
[11] W. H¨am¨al¨ainen and M. Vinni, Classifiers for educational data mining in Handbook of
Educational Data Mining. C. press.
[12] K. Bunkar, U. Singh, B. Pandya, and R. Bunkar, “Data mining: Prediction for performance improvement of graduate students using classification,” in Wireless and Optical Communications Networks (WOCN), 2012
Ninth International Conference on, 2012, pp.
1–5.