ISSN 2348-3083 SPECIAL ISSUE, VOL. I/I INNOVATIVE PRACTICES IN TEACHER EDUCATION
AES, NATIONAL CONFERENCE, 11-12, OCT, 2014 Page 2
Attitude of Teacher-Educators Towards E-learning
Dr. Rekha, KC College of Education, Nawanshahr
Abstract
Electronic learning or e-learning is an all-encompassing term generally used to refer to computer enhanced learning, although it is often extended to include the use of mobile technologies such as PDAa and MP3 players. It may include the use of web-based teaching material and hypermedia in general multimedia CD-ROMs or web sites, discussion boards, collaborative software, e-mail, blogs, wi-fi, text chat, computer aided assessment, educational animation, simulation, games, learning management software, with possible a combination of different methods being used. In this study attitude of teacher educators towards E-learning was determined. The sample was consisted of 150 teacher educators which were randomly selected from the different urban and rural B.Ed. colleges of Ropar and Chandigarh District. A self-constructed tool i.e the attitude scale for assessing E-learning on part of teacher-educators consists of 60 items. Findings of the study revealed that there are no significant difference in terms of attitude towards E-learning between the rural and urban teacher educators and teacher educators of different streams. Thus all teacher educators have almost same type of attitude towards E-learning. Further findings revealed that attitude of teacher educator are not as positive as it should be.
Key Words: Attitude, E-Learning and Teacher Educators Introduction:
ISSN 2348-3083 SPECIAL ISSUE, VOL. I/I INNOVATIVE PRACTICES IN TEACHER EDUCATION
AES, NATIONAL CONFERENCE, 11-12, OCT, 2014 Page 3
can be made available from any computer, once the user has the access through web-browsers. It permits the delivery of knowledge and information to learners at an accelerated pace, opening up new vistas of knowledge transfer. India has the capacity to become the hub of technology-enabled teaching and learning with its IT prowess and strong educational system. E-learning is the computer and network-enabled transfer of skills and knowledge. E- Learning applications and processes include Web-based learning, computer-based learning, virtual education opportunities and digital collaboration. Content is delivered via the internet, intranet/extranet, audio or video tape, satellite TV, and CD-ROM. It can be self-paced or instructor-led and includes media in the form of text, image, animation, streaming video and audio. Deborah L. Lowther., “et al.” (1998) emphasizes that the technological competence also requires a transition from using the computer as an instructional delivery system to one of using the computer as a learning tool. Shu-Sheng Liaw., “et al.” (2007) found that the trend of using e-learning as a learning and/or teaching tool is now rapidly expanding into education. E-learning is the new wave in learning strategy.
The attitude of teachers is important factor influencing use of education technologies in classes. The extent to which nations can exploit, the potential, economic social and educational benefits of information technologies is dependent upon the individual citizen's perceptions of attitude towards that technology. kumar and kumar (2011) conducted a study on 'Attitude of Teachers' of Higher Education towards e-learning'. The findings of this study reveal that the teachers have a favourable attitude towards e learning as well teachers who are familiar about computer and information and communication technology differ in their attitude towards e learning when compared tit e teachers who are not familiar with technology. Deswal and Rani (2011) conducted a study on 'Attitude of teacher educators towards e-learning' the overall results indicate that the teacher educators (both urban and rural) possess highly favourable attitude towards e-learning. There is no significant difference in the attitude of teacher educators towards e-learning in relation to gender, locality and stream (i.e. arts, science and commerce). As per Mahdizadeh. H., “et al.” (2007) E-learning environments increasingly serve as important infrastructural features of universities that enable teachers to provide students with different representations of knowledge and to enhance interaction between teachers and students, amongst student themselves.
Objectives of the study:
1. To compare the attitude of teacher educators of rural areas and urban areas towards e-learning.
2. To compare the attitude of teacher educators in relation to their steam (Science and Humanities) towards e-learning
3. To compare the attitude of teacher educators in relation to their stream (Commerce and Humanities) towards e-learning).
4. To compare the attitude of teacher educators in relation to their stream (Commerce and Science) towards e-learning.
ISSN 2348-3083 SPECIAL ISSUE, VOL. I/I INNOVATIVE PRACTICES IN TEACHER EDUCATION
AES, NATIONAL CONFERENCE, 11-12, OCT, 2014 Page 4
The sample was consisted of 150 teacher educators which were randomly selected from the different urban and rural B.Ed. colleges of Ropar and Chandigarh District.
Tool:
A self-constructed tool i.e the attitude scale for assessing e-learning on part of teacher-educators consists of 60 items. These items were selected on the basis of previous studies and review of literature. These items selected were given to experts for their opinions and comments. In view of the criticisms and comments offered by expert and teachers, more items were added and substituted, modified or rewritten. These items reached maximum level of consensus amongst different experts finally. All the 60 items of the scale were positively worded. Items scored were from '4', '3', '2', '1', and '0' for strongly agree, agree, undecided, disagreed and strongly disagree, respectively. The total score varied from 60 to 240, showing lowest attitude towards e-learning to highest attitude towards e-learning.
Procedure for data collection:
The attitude scale for assessing e-learning is a self-administered scale. The purpose of scale is frankly explained to the subjects. The scale with 60 items was then administered to a group of 75 urban teacher educators and 75 rural teacher educators randomly selected. It is assured that their replied would be kept confidential. The subject is requested to read the instructions carefully and ask the tester if there is any difficulty in the understanding of the instructions. It has been emphasized that no item should be omitted as there is nothing wrong or right about these questions. There is no time limit for the scale.
Results and Discussion:
The objective wise analysis is given as under
1
First objective was, “
To compare the attitude of teacher educators of rural areas and urban areas towards e-learning”. The data related to this objective was analyzed with the help of “t-Test”. t- Value was came out to be 1.42 with df= 148 ,which is not significant at 0.01 & 0.05 level. Hence the null hypothesis is not rejected which says there exists no significant difference in the attitude of teacher educators of rural and urban areas towards e-learning". Thus there exists no significant difference between the rural and urban teacher educators in terms of attitude towards e-learning.ISSN 2348-3083 SPECIAL ISSUE, VOL. I/I INNOVATIVE PRACTICES IN TEACHER EDUCATION
AES, NATIONAL CONFERENCE, 11-12, OCT, 2014 Page 5
significant at 0.01 & 0.05 level. Hence the null hypothesis is not rejected which states that there exists no significant difference in the attitude of teacher educators in relation to their stream (Commerce and Humanities) towards e-learning." Thus there exists no significant difference between the Commerce and humanities teacher educators in terms of attitude towards e-learning. 4 Fourth objective was
, “
To compare the attitude of teacher educators in relation to their stream (Commerce and Science) towards e-learning”. The data related to this objective was analyzed with the help of “t-Test”. t- Value was came out to be 0.89 with df= 98, which is not significant at 0.01 & 0.05 level. Hence the null hypothesis is not rejected which states that there exists no significant difference in the attitude of teacher educators in relation to their stream (Commerce and Science) towards e-learning." Thus there exists no significant difference between the Commerce and Science teacher educators in terms of attitude towards e-learning.Findings:
1) There exists no significant difference between the rural and urban teacher educators in terms of attitude towards e-learning
2) There exists no significant difference between the science and humanities teacher educators in terms of attitude towards e-learning.
3) There exists no significant difference between the Commerce and humanities teacher educators in terms of attitude towards e-learning.
4) There exists no significant difference between the Commerce and Science teacher educators in terms of attitude towards e-learning.
Implications: Findings of the study revealed that there are no significant difference in terms of attitude towards e-learning between the rural and urban teacher educators and teacher educators of different streams. Thus all teacher educators have almost same type of attitude towards e-learning. Further findings revealed that attitude of teacher educator are not as positive as it should be. Teacher education program is a medium through which education of a nation propagate. It must be in correspondence with the recent researches and developments. The application of learning for teaching and learning in real classroom depends very much on the e-learning skills that teacher possesses which in turn depends upon the teacher educators. There is no single agency or single well-conceived curriculum for ICT skills training to trainees or a definite set of ICT skills or competencies that the trainees are expected to possess. Hence, there is a need to prepare a comprehensive set of e-learning skills to be possessed by educators and to prepare a programme to enhance these skills in the teachers and teacher educators. Hence programmes of enhancing these skills should be included in the ETT, B.Ed and M.Ed curriculum.
References:
A B Allen , I. E. and Seaman, J. (2008) Staying the Course : Online Education in the United States, 2008Needham MA: Consortium
ISSN 2348-3083 SPECIAL ISSUE, VOL. I/I INNOVATIVE PRACTICES IN TEACHER EDUCATION
AES, NATIONAL CONFERENCE, 11-12, OCT, 2014 Page 6
Deborah, L. Lowther., Tempa, Bassoppo-moyo., & Gary, R. Morrison. (1998), “Moving from Computer Literate toTechnology Competent: The next educational reform”, Computers in Human Behaviour, 14(1), 93-109.
Kellner, D. (2004). Technological transformation, multiple literacies, and the re-visioning of education. E-learning,1(1),9-37.
Krishnakumar,R.& Rajeshkumar,M.(2011). Attitude of Teachers’ of Higher Education towards e-Learning, Journal of Education and Practice,4(2),
Mahdizadah, H., Harm, Biemans., & Martin Mulder. (2008), “Determining factors of the use of e-learningenvironments by University teachers”, Computers & Education, 51(1), 142-154.
ISSN 2348-3083 SPECIAL ISSUE, VOL. I/I INNOVATIVE PRACTICES IN TEACHER EDUCATION
AES, NATIONAL CONFERENCE, 11-12, OCT, 2014 Page 7
TOTAL QUALITY MANAGEMENT (TQM)
Mrs. Suhas C. Marathe, Incharge Director, Abasaheb Garware Institute of Management Studies, Sangali.
Abstract
Educational Institutes as social organizations have some unique features. They are service organizations with all the complexities of a service organization. The public and private investment in education is so large that it becomes the concern of all and sundry. Total Quality Management (TQM) is a concept which is now considered in context of educational institutes also.
The Latin origin of the word “Quality” is qualis meaning of what kind or of such a kind. The Oxford dictionary meaning of quality is given as: The standard of something as measured against other things of a similar kind; the degree of excellence of something. Quality is a complex concept. Conformance to requirements, Fitness for use, are some of the ways quality is understood.
In the past, goods were custom made by skilled craftsman. After the Industrial revolution in the 18th century, there was a fundamental shift from cottage industry production to large scale mechanized industrial production resulting in mass production and repetitive work practices. 1900-1940 was the period of the introduction of assembly line which called for standardization and close supervision. The end of the Second World War was the starting point of the quality movement that was adopted by Japan, which eventually came to be recognized as Total Quality Management (TQM). Walter A. Shewhart, W. Edwards Deming, Joseph M. Juran, Armand V. Figenbaum, Phillip B.Crosby, Kaoru Ishikawa, Genichi Taguchi and many more have contributed to this philosophy of TQM.
TQM is an integrated effort designed to improve quality performance at every level of the organization. For any organization to become successful, ‘knowledge’ is perhaps the most important resource. This means the knowledge that is imparted in our education institutes has to be quality education. In order to achieve this, the concept of TQM needs to be adopted in our educational Institutes. TQM in education surfaced in 1988 at Mt. Edgecombe High school in Sitka, Alaska, when David Langford, the school’s technology teacher/coordinator, applied Total Quality concepts in his classes. TQM has become increasingly popular in education, as many educators believe that the Deming’s concept of TQM provides the guiding principles for much needed reforms in education and educational organizations. Quality management is a method for ensuring that all the activities necessary to design, develop and implement a product or service are effective and efficient with respect to the system and its performance (Deming, 1986). TQM instills a philosophy of doing the job correctly the first time.
This paper attempts to understand the importance of TQM in the field of education. Introduction
ISSN 2348-3083 SPECIAL ISSUE, VOL. I/I INNOVATIVE PRACTICES IN TEACHER EDUCATION
AES, NATIONAL CONFERENCE, 11-12, OCT, 2014 Page 8
productivity, better competitive position, higher satisfaction of all stakeholders, and a happier workforce. According to W. Edwards Deming, ‘Everyone doing their best’ or best efforts are not sufficient, for them to be effective they must move in the right direction. Thus sustained efforts in quality improvement has become essential. The adoption of the philosophy of TQM has become imperative in every organization. This is because organizations have a structure with systems and procedures that enable people to work towards a common goal.
Educational organization or institution include preschools, childcare, elementary schools colleges and universities. It is a place where people of different ages gain an education.
The stakeholders in any given educational organization are many. Each of these stakeholder will benefit if TQM philosophy is adopted in running the organization. In an education institute the stake-holders are:
1) Students
2) Parents of these students
3) Teachers and supporting staff of the organization 4) Future employees
5) Society in general
Deming had advised the Japanese industrialists not to start with quality control, instead it was more essential to find out what their customers wanted. Deming also suggested that they design their methods of production and their products to the highest standards to meet customer expectations. The Japanese did that and became world leaders.
The educational organizations in India need a massive overhauling of its current systems. This includes revamping of syllabus and the manner in which it is imparted, the development of teachers skills and their attitude, modification in parents attitude and expectations, students participation and enthusiasm in the learning process, Businesses and corporate bodies positive involvement in the education process, interface between the industry and educational institutes need to improve, society in general should be more responsible towards educational institutes by contributing towards a clean, pollution free school and college zones. It is also important to understand what the stakeholders really want and satisfy these wants.
Meaning of Education: Education in its general sense is a form of learning in which the knowledge, skills, and habits of a group of people are transferred from one generation to the next through teaching, training, or research. Education frequently takes place under the guidance of others, but may also be autodidactic. Any experience that has a formative effect on the way one thinks, feels, or acts may be considered educational. Education is commonly divided into stages such as preschool, primary school, secondary school, and then college, university, or apprenticeship.
ISSN 2348-3083 SPECIAL ISSUE, VOL. I/I INNOVATIVE PRACTICES IN TEACHER EDUCATION
AES, NATIONAL CONFERENCE, 11-12, OCT, 2014 Page 9
duties and imparts inner strength to face oppression, humiliation and inequality. (Ninth Five Year Plan, 1997-2002)
Meaning and definitions:
Total quality management (TQM): An integrated effort designed to improve quality performance at every level of the organization.
Let us look at the various dimensions of quality:
Customer defined quality: The meaning of quality as defined by the customer.
Conformance to specifications: How well a product or service meets the targets and tolerances determined by its designers.
Fitness for use: A definition of quality that evaluates how well the product performs for its intended use.
Value for price paid: Quality defined in terms of product or service usefulness for the price paid.
Support services: Quality defined in terms of the support provided after the product or service is purchased.
Psychological criteria: A way of defining quality that focuses on judgmental evaluations of what constitutes product or service excellence.
Features &Shortcomings of the Education System in India:
1. Huge mass of student population:
• Half of the population of the age group 5-24 is currently participating in the formal education system.
• Of this, 51% comprise children studying at the primary level and 23% students at the middle level.
The total number of good educational institutes are few in number and are unable to meet the demands of a growing population.
In schools, colleges and other educational institutes the number of students per teacher/Instructor is disproportionately large compared to its western counterparts. This leads to a lot of stress on the teachers. The one to one teacher student interaction is compromised. Teachers are unable to comprehend the difficulties faced by individual students.
2. Lack of infrastructure:
Majority of the educational institutes do not or are unable to have a sound infrastructural base. This includes lack of:
A proper approach road
Clean premises
Open spaces for the students to move about
Proper parking facilities
Safe drinking water facility
ISSN 2348-3083 SPECIAL ISSUE, VOL. I/I INNOVATIVE PRACTICES IN TEACHER EDUCATION
AES, NATIONAL CONFERENCE, 11-12, OCT, 2014 Page 10
Clean toilets
Well-equipped and well maintained science, computer and other laboratories,
Good hostel facilities
Canteen facilities
Library
Availability of First aid
Safety considerations such as large spacious corridors, fire and emergency exits,
The list is endless, however very few institutes are able to provide all the above mentioned requirements.
3. Stake holders and their expectations: The expectation of all the stake-holders need to be taken into consideration. This will help in bringing about changes in the whole education system.
The role of TQM:
For organizations to become superior in quality, as suggested by the authors Frank M. Gryna, Richard C.H. Chua, Joseph A. Defeo of the book Juran’s Quality Planning & Analysis for Enterprise Quality, organizations need to
Develop technologies to create products and processes that meet customer needs and
Stimulate a culture that continually views quality as a primary goal. The culture for quality can be changed by providing
a. Goals and measurements.
b. Evidence of upper management leadership c. Self-development and empowerment d. Participation
e. Recognition and rewards
Internal Marketing: The interaction between the organization and its employees defines internal marketing. Treat employees as customers. This is because from the eyes of the service receiver, (in this context the student), the service contact employees that is the teachers and supporting staff are the service, are the organization, are the brand and its marketers.
It is essential to develop teachers and other staff members to ensure imparting of quality education. In order to achieve this it is necessary to hire qualified and able faculty and staff, to develop and train them in order to impart quality education, to provide needed support systems such as well-equipped classrooms, libraries etc., and retain the best people.
Interactive Marketing: The effectiveness of customer involvement at all levels will impact organizational productivity and, ultimately, quality and customer satisfaction. Also “fellow customers” can affect the nature of the service outcome or process. They can either enhance or detract from customer satisfaction and perceptions of quality.
ISSN 2348-3083 SPECIAL ISSUE, VOL. I/I INNOVATIVE PRACTICES IN TEACHER EDUCATION
AES, NATIONAL CONFERENCE, 11-12, OCT, 2014 Page 11
External Marketing: When the organization is directly addressing its customers i.e. marketing to end-users. This involves pricing strategies, promotion activities, and all communication with customers. Performed to capture the attention of the market, and arouse interest in the service. This includes maintaining a web-site, printing brochures, organizing community events etc.
The philosophy of TQM and its main contributors:
TQM is different from the old concept of quality as its focus is on serving customers, identifying the causes of quality problems, and building quality into the educational process.
The PDSA cycle i.e. Plan, Do, Study and Act cycle is a process which is a good exercise in quality control in an educational Institute:
Plan
Evaluate current process
Collect procedures, data, identify problems
Develop an improvement plan, performance objectives
Do
Implement the plan – trial basis
Study
Collect data and evaluate against objectives
Act
Communicate the results from trial If successful, implement new process.
Some of the principles of the TQM process that need to be adapted in educational organizations are:
1) Conformance to specifications: Does the service meet targets and tolerances defined by designers?
2) Fitness for use: Evaluate performance for intended use.
3) Value for price paid: Evaluation of usefulness vs. price paid (fees paid).
4) Support services: Quality of support after sale that is after admission is confirmed. 5) Psychological: Ambience, prestige, friendly staff
Certain effective tools are used in the TQM process that can be adopted by educational outfits to assure quality performance are:
Cause-and-Effect Diagrams/ Fish bone diagram
Flowcharts
Checklists
Control Charts
Scatter Diagrams
Pareto Analysis
ISSN 2348-3083 SPECIAL ISSUE, VOL. I/I INNOVATIVE PRACTICES IN TEACHER EDUCATION
AES, NATIONAL CONFERENCE, 11-12, OCT, 2014 Page 12
Conclusion: The need for quality in education has become of utmost importance. TQM is a philosophy which will be successful if every person in the organization accepts and practices it because he/or she understand its importance and benefits. In the words of our honorable president Mr. Pranab Mukherjee while inaugurating the Murshidabad campus of Aligarh Muslim University (AMU), he said the people can be empowered only through education.
“We shall have to enhance local recruitment without compromising standard of education. The only way by which we can achieve this is to improve quality of education in degree colleges, high schools and primary schools,” Mukherjee said.
References:
1. Gryna Frank M, Chua Richard C.H., Defeo Joseph A. Juran’s Quality Planning & Analysis for Enterprise Quality Fifth Edition Tata McGraw-Hill Publishing Company Limited
2. Sallis Edward Total Quality Management Third edition
ISSN 2348-3083 SPECIAL ISSUE, VOL. I/I INNOVATIVE PRACTICES IN TEACHER EDUCATION
AES, NATIONAL CONFERENCE, 11-12, OCT, 2014 Page 13
Effect of Social Networking Sites on the Self Confidence of Pupil Teachers
Dr. Vikas Kumar, D.A.N College of Education for Women, Nawanshahr.
Abstract
Social networking Sites are used by hundreds of millions of people every day, but little is known about their effect on behaviour. Young people are among the most prolific users of these sites. Emerging studies find that youth spend a considerable portion of their daily life interacting through social media. Subsequently, questions and controversies emerge about the effects SNS have on adolescent development. In this study Research tried to find the effect of social networking sites on the self confidence of the pupil teachers. Purposive sampling was done. Sample was comprised of 100 pupil teachers from 3 colleges of Education of Nawanshahr District. . The Opinionnaire on the social networking site was prepared to check the opinion of the adults. It contains 30 items divided into 4 dimensions i.e. social relations and recreation. Results of study indicate that self Confidence of those pupil teachers who used social networking sites is more than those who does not use these sites.
Key Words: Social Networking Sites, Self Confidence and Pupil Teachers.
ISSN 2348-3083 SPECIAL ISSUE, VOL. I/I INNOVATIVE PRACTICES IN TEACHER EDUCATION
AES, NATIONAL CONFERENCE, 11-12, OCT, 2014 Page 14
but also on the amount of time users spend on these websites. Online social network use accounts for nearly 23% of time spent online in the United States, which is approximately double the time spent on any other online activity (Nielsen 2010). Despite this growing popularity and increasingly frequent usage, a systematic under- standing of how social network use affects consumer behaviour remains elusive. People use social networks to fulfil a variety of social needs, including self-expression and self-presentation (Back et al. 2010). Consequently, using a social network can enhance self-esteem and positively affect well-being (Gonzales and Hancock 2011). Social Networking Sites utilize Web 2.0 principles. The Term Web 2.0 defines websites that are designed to: (a) rely on the participation of mass groups of users rather than centrally controlled content providers, (b) aggregate and remix content from multiple sources, and (c) more intensely network users and content together (O’Reilly, 2007). Self confidence has been defined as confidence in one’s own abilities and judgments and also describes as “the traits or qualities as cumulative result of life experiences, where positive experiences build on confidence and negative ones make us worry to reflect them often. Self confidence is as much an inherent, inborn traits as it is an acquired or cultivated endowment carefully musical and nurtured. Self confidence is a personality trait. A self-confident person perceived himself to be socially competent, emotionally mature, intellectually adequate, successful, optimistic, independent, self-reliant, self- assured, forward moving, fairly assertive and having leadership qualities. The world is likely to believe in a man who believes in himself, provided he shows that his self-reliance is grounded upon a true appraisal and is well managed. No one can be great in business or a profession or an art who wants advice before he does anything important. Self-reliance is the end expression of many qualities: emotional stability, willingness to face facts and to bear responsibility, discipline, and faith in our judgments and practice in making decision and obedience by them. Ellison et al. (2007) found evidence that self-esteem may operate as a moderator of the relationship between social network site use and social capital. That is, young people with lower self-esteem appeared to Benefit more from their use of Facebook than those with higher self-esteem. However, with data at only one point in time, it was not possible for Ellison et al. (2007) to establish any time order to the relationships among Facebook use, self-esteem, and social capital.Subrahmanyam and Greenfield (2008) observe that the lines between the virtual and real world is increasingly blurred for youth today: “. . . for today’s youth, media technologies are an important social variable and . . . physical and virtual worlds are psychologically connected; consequently, the virtual world serves as a playing ground for developmental issues from the physical world” (p. 124). The key questions for the field of youth and SNS focus on what the emotional, social, and cognitive effects of using the technology are for adolescents. Studies have clearly indicated that Social Networking sites have their influence on the emotional, social, and cognitive domain of the user.
Objectives:
1. To study the self confidence of Pupil Teachers.
ISSN 2348-3083 SPECIAL ISSUE, VOL. I/I INNOVATIVE PRACTICES IN TEACHER EDUCATION
AES, NATIONAL CONFERENCE, 11-12, OCT, 2014 Page 15
3. To find out the difference in Self Confidence of Users and Non- Users of Social Networking Sites .
4. To find out the difference in Self Confidence of High Users and Average Users of Social Networking Sites .
5. To find out the difference in Self Confidence of Average Users and Low Users of Social Networking Sites .
6. To find out the difference in Self Confidence of High Users and Low Users of Social Networking Sites.
SAMPLE: Purposive sampling was done. Sample was comprised of 100 pupil teachers from 3 colleges of Education of Nawanshahr District.
Tools:
1) The Opinionnaire on the social networking site was prepared to check the opinion of the adults. It contains 30 items divided into 4 dimensions i.e. social relations and recreation. 2) Self-Confidence Inventory by Rekha gupta.
Analysis: Objective vise analysis is given as under
1) First objective of the study was to find the self confidence of pupil teachers. Data related to this objective was analysed by calculating the percentages
Table 1 Table showing %age of pupil teachers with Raw Scores of Self Confidence
Serial No. Raw scores Pupil Teachers % age
1 7 and below 5 5%
2 8-19 28 28%
3 20-32 40 40%
4 33-34 22 22%
5 45 and above 5 5%
Table 1 clearly reveals that 5% Pupil teachers were having very high self confidence,28% were having high self confidence ,40% were having average self confidence where as 22% were having low self confidence and 5% were having very low self confidence. Result Reveals that most of the pupil teachers (40%) were having average self confidence.
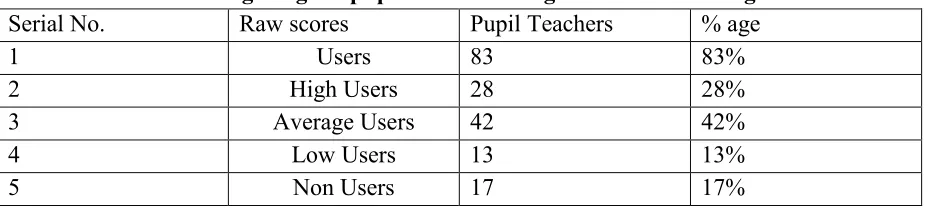
[image:15.612.68.540.590.697.2]2) Second objective of the study was to find the use of Social Networking Sites by the Pupil Teachers. Data related to this objective was analysed by calculating the percentages
Table: 2 Table showing %age of pupil teachers using Social Networking Sites
Serial No. Raw scores Pupil Teachers % age
1 Users 83 83%
2 High Users 28 28%
3 Average Users 42 42%
4 Low Users 13 13%
ISSN 2348-3083 SPECIAL ISSUE, VOL. I/I INNOVATIVE PRACTICES IN TEACHER EDUCATION
AES, NATIONAL CONFERENCE, 11-12, OCT, 2014 Page 16
Table 2 clearly reveals that 83% Pupil teachers were using social Networking Sites while 17% were not using these sites at all. Out of 83% , 28% were the high Users, 42% were the average users were as 13% were low users of Social Networking Sites. Result clearly Reveal that most of the pupil teachers (83%) were using Social Networking Sites.
3) Third objective of the study was to find the difference in Self Confidence of Users and Non- Users of Social Networking Sites. Data related to this objective was analyzed with the help of t-test.
Table 3 Significance of the Difference between Mean Scores of Self Confidence of Users and Non- Users Pupil Teachers of Social Networking Sites
S. No. Group N M S.D SEM t-value
1. Users 83 26.29 10.57 1.05 4.26**
2. Non-Users 17 21.05 10.03 1.00
*significant at 0.01 level
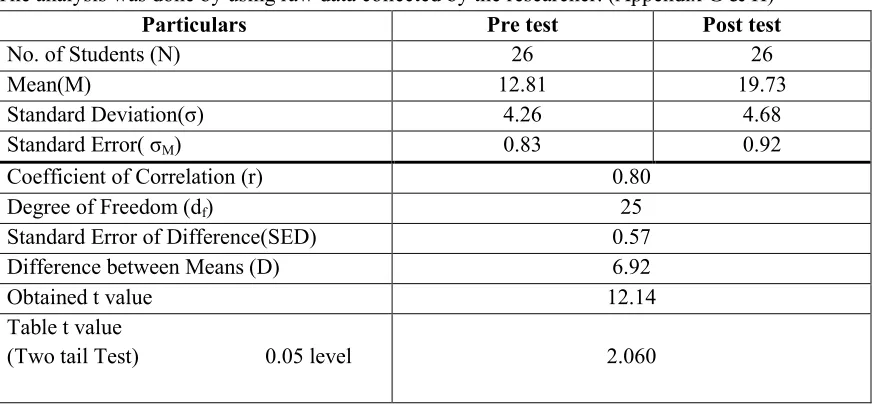
Table 3 revealed that the mean scores of self confidence of users and non-users pupil teachers of social networking sites are 26.29 and 21.05 respectively and their standard deviation as 10.57 and 10.03 respectively. The t-ratio is 4.26 with df =98 which is
significant at 0.01 level. This revealed that a significant difference exists between mean scores of self confidence of users and non-users pupil teachers of social networking sites. In this context, the null hypotheses, namely, “There is no significant difference between the Self Confident of Users and No Users of Social Networking Sites”, is rejected. Further, the mean score of users pupil teachers (26.29) was significantly higher than those belonging to group of non-users (21.05). It may, therefore, be said that Self Confidence of those pupil teachers who used social networking sites is more than those who does not use these sites..
4) Fourth objective of the study was to find the difference in Self Confidence of high Users and average Users of Social Networking Sites. Data related to this objective was analyzed with the help of t-test.
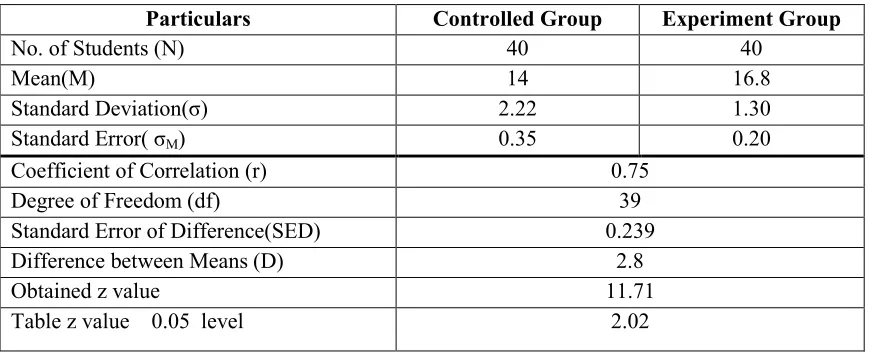
Table 4 Significance of the Difference between Mean Scores of Self Confidence of High Users and Average Users Pupil Teachers of Social Networking Sites
S. No. Group N M S.D SEM t-value
1. High Users 28 28.19 11.07 1.04 3.16**
2. Average Users 42 24.05 10.53 1.04
*significant at 0.01 level
Table 4 revealed that the mean scores of self confidence of high users and average-users pupil teachers of social networking sites are 28.19 and 24.05 respectively and their standard deviation as 11.07 and 10.53 respectively. The t-ratio is 3.16 with df =68 which
ISSN 2348-3083 SPECIAL ISSUE, VOL. I/I INNOVATIVE PRACTICES IN TEACHER EDUCATION
AES, NATIONAL CONFERENCE, 11-12, OCT, 2014 Page 17
difference between the Self Confident of high Users and average Users of Social Networking Sites”, is rejected. Further, the mean score of high users pupil teachers (28.19) was significantly higher than those belonging to group of average users (24.05). It may, therefore, be said that Self Confidence of those pupil teachers who were high users of social networking sites is more than self confidence of average users of these sites.
5) Fifth objective of the study was to find the difference in Self Confidence of Average Users and low Users of Social Networking Sites. Data related to this objective was analyzed with the help of t-test.
Table 5 Significance of the Difference between Mean Scores of Self Confidence of Average Users and low- Users Pupil Teachers of Social Networking Sites
S. No. Group N M S.D SEM t-value
1. Average Users 42 24.05 10.53 1.04 1.06
2. low-Users 13 22.95 10.72 1.06
*significant at 0.01 level
Table 5 revealed that the mean scores of self confidence of average users and low-users pupil teachers of social networking sites are 24.05 and 22.95 respectively and their standard deviation as 10.53 and 10.72 respectively. The t-ratio is 1.06 with df =53 which
is not significant at 0.05 level. This revealed that a significant difference does not exists between mean scores of self confidence of average users and low-users pupil teachers of social networking sites. In this context, the null hypotheses, namely, “There is no significant difference between the Self Confident of average Users and low Users of Social Networking Sites”, is not rejected. It may, therefore, be said that Self Confidence of those pupil teachers who were average users of social networking sites is not significantly better than those who were low users of these sites.
6) Sixth objective of the study was to find the difference in Self Confidence of high Users and low- Users of Social Networking Sites. Data related to this objective was analyzed with the help of t-test.
Table 6 Significance of the Difference between Mean Scores of Self Confidence of high Users and low- Users Pupil Teachers of Social Networking Sites
S. No. Group N M S.D SEM t-value
1. High Users 28 28.19 11.07 1.04 5.81**
2. low-Users 13 22.95 10.72 1.06
*significant at 0.01 level
Table 6 revealed that the mean scores of self confidence of high users and low-users pupil teachers of social networking sites are 28.19 and 22.95 respectively and their standard deviation as 11.07 and 10.72 respectively. The t-ratio is 5.81 with df =39 which
ISSN 2348-3083 SPECIAL ISSUE, VOL. I/I INNOVATIVE PRACTICES IN TEACHER EDUCATION
AES, NATIONAL CONFERENCE, 11-12, OCT, 2014 Page 18
sites. In this context, the null hypotheses, namely, “There is no significant difference between the Self Confident of high Users and low Users of Social Networking Sites”, is rejected. Further, the mean score of high users pupil teachers (28.19) was significantly higher than those belonging to group of low-users (22.95). It may, therefore, be said that Self Confidence of those pupil teachers who were high users of social networking sites is more than those were low users of these sites.
Findings:
1) 40% of the pupil teachers were having average self confidence
2) Most of the pupil teachers (83%) were using Social Networking Sites.
3) Self Confidence of those pupil teachers who used social networking sites is more than those who does not use these sites..
4) Self Confidence of those pupil teachers who were high users of social networking sites is more than self confidence of average users of these sites.
5) Self Confidence of those pupil teachers who were average users of social networking sites is not significantly better than those who were low users of these sites.
6) Self Confidence of those pupil teachers who were high users of social networking sites is more than those were low users of these sites.
References;
Back, Mitja D., Juliane M. Stopfer, Simine Vazire, Sam Gaddis, Stefan C. Schmukle, Boris Egloff, and Samuel D. Gosling (2010), “Facebook Profiles Reflect Actual Personality, Not
Self-Idealization,” Psychological Science, 21 (3), 372–74.
boyd, d. m., & Ellison, N. (2007). Social network sites: Definition, history, and scholarship. Journal of Computer-Mediated Communication, 13, 210−230.
Ellison, N., Steinfield, C., & Lampe, C. (2007). The benefits of Facebook “friends:” Social capital and college students' use of online social network sites. Journal of
Computer-Mediated Communication, 12, 1143−1168.
Gonzales, Amy L., and Jeffrey T. Hancock (2011), “Mirror, Mirror on My FacebookWall: Effects of Facebook Exposure on Self- Esteem,” Cyberpsychology, Behavior, and Social Networking, 14 (January/February), 79–83.
Nielsen Wire (2010), “What Americans Do Online: Social Media and Games Dominate Activity,” Nielsen Wire, http://blog .nielsen.com/nielsenwire/online_mobile/what-americans-doonline- social-media-and-games-dominate-activity/.
O’Reilly, T. (2007). What is web 2.0: Design patterns and business models for the next generation of software. Communications & Strategies, 65, 17–37.
ISSN 2348-3083 SPECIAL ISSUE, VOL. I/I INNOVATIVE PRACTICES IN TEACHER EDUCATION
AES, NATIONAL CONFERENCE, 11-12, OCT, 2014 Page 19
ISSN 2348-3083 SPECIAL ISSUE, VOL. I/I INNOVATIVE PRACTICES IN TEACHER EDUCATION
AES, NATIONAL CONFERENCE, 11-12, OCT, 2014 Page 20
STIMULATING CREATIVITY OF PRE-SERVICE SECONDARY
SCHOOL TEACHERS WITH CREATIVE PROBLEM SOLVING (CPS)
TRAINING
Yogesh Sharma, Assistant professor, Ramgarhia College of Education, Phagwara, Punjab – India
“I am creative person. I think and I like to believe there is no limitation to creativity.” Shah Rukh Khan, Bollywood Actor
Creative thinking is the highest of mental functions and creative production the peak of human achievement (Getzels, 1985) and in evaluations of the reasons for accomplishment and failure, creativity appears to have replaced intelligence as the focus of interest (Smith & Carlson, 1990). However, teachers, in India, are not adequately trained for developing creative thinking abilities of the students. The new curriculum for prospective secondary teachers has neglected creativity. In the light of this, one can expect that in future, the pre-service secondary school teachers may not be able to give due emphasis to creativity in their respective jobs. And, the neglect of creativity in the schools can be detrimental for survival as well as progress of a nation. Few psychological constructs are more intricate and obscure to comprehend than creativity (Sharma, 2009). Creativity is a multi-colored thing, having different shades and hues. Treffinger, Young, Selby, & Shepardson (2002) identified over 100 definitions of creativity. Torrance (1967) defined creativity as the process of becoming sensitive to problems, deficiencies, gaps in knowledge, missing elements, disharmonies, and so on; searching for solutions, making guesses, or formulating hypotheses about deficiencies; testing and retesting these hypotheses and possibly modifying and retesting them; and finally communicating the results. Runco (1993) emphasized that creativity involved both convergent and divergent thinking, problem finding and problem solving, self-expression, intrinsic motivation, a questioning attitude and self-confidence, while Haylock (1997) pointed that creativity is a notion that embraces a wide range of cognitive styles, categories of performance, and kinds of outcomes. However, most educationist and psychologist agree that that creativity is development of something that is novel and has some value for the thinker or the society. Moreover, the concept of creativity is hitherto dealt in term of Person, Product, Process, Press and Guilford’s SI Model.
Creative Person
ISSN 2348-3083 SPECIAL ISSUE, VOL. I/I INNOVATIVE PRACTICES IN TEACHER EDUCATION
AES, NATIONAL CONFERENCE, 11-12, OCT, 2014 Page 21
distinguishable characteristics of creative persons. Stein (1984) analyzed various research studies and stated 15 varied characteristics of creative persons.
Creative Product
Various psychologists, like, Thurstone (1952), Newell, Shaw and Simon (1962), Mackinnon (1972), Berk (2002) etc. have interpreted creativity in terms of products. A product signifies anything in the mode of an idea, theory, an act, generalization, assumptions or theorems advanced by the mathematicians, work of art or music, etc.
Creative Process
The term creative process connate all processes, stages, thinking, or procedures that ultimately result in creative products. Spearman (1930) had seen creative thinking as a process of seeing or creating relationships with both conscious and subconscious processes operating. Barchillion (1961) remarked that creative processes were of two kinds: Cognito; to shake and throw things together and Intelligo; to choose and discriminate from many different alternative possibilities and then synthesize and bind together elements in new and original ways.
Creative Press
Creativity is an agreement in the midst of external world of reality and individualized cravings. The term press refers to the relationship between human beings and their external environment. Environment has certain constraints, which either assist or curb the creativity of homo sapiens.
Guilford’s SI Model
J. P. Guilford has thrown light on creativity through his SI Model developed initially during 1950. SI Model is a 3-dimensional structure of cognitive abilities with a total of 180 categories (6 kinds of products × 5 kinds of contents × 6 kinds of processes). Most conspicuously creative abilities are to be found in the category of divergent thinking with the exception of the factors of redefinition, which are in the convergent thinking category and the factor of sensitivity to the problem, which is in the evaluative category.
Thus, creativity may also be defined in terms of 4P’s and 1G. We can consider the characteristics of the person; we can analyze the process used; we can assess the creativity of the end product; we can examine the support (or lack of support) in the environment in which the creativity occurred (Reali, 2010), and we can see in terms of divergent production.
ISSN 2348-3083 SPECIAL ISSUE, VOL. I/I INNOVATIVE PRACTICES IN TEACHER EDUCATION
AES, NATIONAL CONFERENCE, 11-12, OCT, 2014 Page 22
create a classroom full of 21st century learners equipped with tools and strategies to embark upon solving the problems of today’s world, look no further.
The CPS is a broadly applicable process providing an organizing framework for specific creative and critical thinking techniques to help design and develop new and useful outcomes for meaningful and important challenges, concerns and opportunities (Isaksen, Dorval, & Treffinger, 1994). The CPS programme was initially developed by Osborn (1963). It (CPS) has seen many transformations since then. At present, the CPS version 6.1TM Framework consists of four components, and eight stages. Treffinger, Isaksen, & Dorval (2003) explained CPS as under:
1. Understanding the Challenge
This involves investigating a broad goal, opportunity, or challenge, and clarifying, formulating, or focusing your thinking to set the principal direction for your work. The stages of this component are: Constructing Opportunities, Exploring Data, and Framing Problems. Previously, theses stages were known as Mess-Finding, Data-Finding and Problem-Finding.
2. Generating Ideas
Finding many (fluency), varied (flexibility), and unusual (originality) ideas with different generating tools and of course, brainstorming is one of major generating tools.
3. Preparing for Action
Exploring ways to turn a promising option into a workable solution, and then preparing for a successful implementation. The stages of this component are: Developing Solutions and Building Acceptance.
4. Planning Your Approach
It (Planning Your Approach) involves keeping track of your thinking while it is happening, to insure that you’re moving in the direction you want to go. The two stages included in the component are called Solution-Finding and Acceptance-Finding.
Concluding Remarks
Creativity training and more specifically CPS should be included in teacher-training courses for adequately preparing teachers. The CPS version 6.1TM Framework has proved useful for developing creativity and critical thinking in industry people. The CPS can be beneficial in education sector also, as Fryer (2003) remarked that use of the CPS model can enable students to develop valuable problem-solving skills, while they are dealing with fictional or actual problems. Furthermore, Carson & Runco (1999) suggested that one of the greatest needs in today’s world is to provide adults and children in different milieus with opportunities for creative expression and the development of creative problem solving and problem finding skills.
References
Barchillon, J. (1961). Creativity and its inhibition in child prodigies. In Personality dimensions of creativity: Symposium at the American Psychological Association convention. New York: Lincoln Institute of Psychotherapy.
ISSN 2348-3083 SPECIAL ISSUE, VOL. I/I INNOVATIVE PRACTICES IN TEACHER EDUCATION
AES, NATIONAL CONFERENCE, 11-12, OCT, 2014 Page 23
Carson, D. K., & Runco, M. A. (1999). Creative problem solving and problem finding in young adults: interconnections with stress, hassles, and coping abilities. The Journal of Creative Behavior, 33(3), 167–188.
Cassalia, A. (2010). Creative problem solving embedded into curriculum. Teaching for High Potential,
6-9. Retrieved from
http://www.creativelearning.com/images/freePDFs/THP_Fall_2010_CreativeProblemSolving.pdf
Fryer, M. (2003). Creativity across the curriculum: A review and analysis of programmes designed to develop creativity. London: QCA.
Getzels, J. W. (1985). Creativity and human development. In T. Husén and T.N. Postlethwaite (Ed.),
The international encyclopedia of education (pp. 1093-110). New York: Pergamon Press.
Haylock, D. W. (1997). Recognizing Mathematical Creativity in School Children. ZDM, 29(3), 68-74. Retrieved from http://www.emis.de/journals/ZDM /zdm973a2.pdf
Mackinnon, D. W. (1972). Creativity: Psychological aspects. In D.L. Sills (Ed.): International encyclopedia of the social sciences (pp. 435-441). New York: The Macmillan Company & the Free Press.
Newell, A., Shaw, J. C., and Simon, H. A. (1962). The Process of Creative Thinking. In H.E. Gruber, G. Terrell, and M. Wertheimer (Eds.), Contemporary approaches to creative thinking. New York: Atherton Press.
Reali, P. (2010). What is creativity, anyway? Retrieved from
http://www.creativeproblemsolving.com/creativity/index.htm
Rucno, M. A. (1993). Creativity as educational objective for disadvantaged students. Storrs, C.T: The National Research Center on Gifted and Talented, University of Connecticut.
Sharma, Y. (2009). Developing strategy for fostering mathematical creativity among class IX students. Unpublished doctoral dissertation, DAVV, Indore.
Smith, G. J. W., & Carlsson, I. M. (1990). The creative processes functional model based on empirical studies from childhood to middle age. Madison C.T.: International University Press, Inc.
Spearman, C. E. (1930). Creative mind. Cambridge: Cambridge University Press. Stein, M. I. (1984). Making the point. New York: The Mews Press.
Thurstone, L. L. (1952). Creative Talent. In L.L. Thurstone (Ed.), Applications of psychology. New York: Harper and Row.
Torrance, E. P. (1967). Scientific views of creativity and factors affecting its growth. In J. Kagan (Ed.),
Creativity and Learning. Boston: Houghton Mifflin Company. Torrance, E.P. (1962). Guiding creative talent. New Jersey: Prentice Hall.
Treffinger, D. J., Isaksen, S. G., & Dorval, K. B. (1994). Creative problem solving: An overview. In M. A. Runco (Ed.). Problem finding, problem solving, and creativity (pp. 223-236). Norwood, NJ: Ablex
ISSN 2348-3083 SPECIAL ISSUE, VOL. I/I INNOVATIVE PRACTICES IN TEACHER EDUCATION
AES, NATIONAL CONFERENCE, 11-12, OCT, 2014 Page 24
THE IMPORTANCE OF COMPUTER BASED DIAGNOSTIC TEST IN MATHEMATICS (CBDTM) IN MATHEMATICS TEACHING
Sawinder Arora
G. N. College of Education (W), Kapurthala, Punjab – India
Diagnosis is not the end, but the beginning of practice. — Martin H. Fischer
Succeeding in mathematics should be seen as the right of every child (NCF, 2005) as a common man cannot lead his life well without the basic knowledge of mathematics (Mishra, 2008). He cannot pull on without learning how to count and calculate. Mathematical skills and their applications form an indispensable tool in our daily life. Singh, Avtar, & Singh (2008) pointed out that in the fast technologically-oriented society it (mathematics) has found a greater role to play. Due to its unavoidable practical utility, it has been included in the school curriculum as a compulsory subject. But it is regretful that most of the students consider it difficult to learn. A phobia has been created in their minds. The reason for this phobia may be any. It is necessary to find out and rectify those reasons. The problems in the learning of Mathematics can be identified with the help of Diagnostic Tests in Mathematics, which further suggests remedial instructions to be provided.
CONCEPT OF DIAGNOSTIC TESTING
Diagnostic testing is an important component of teaching–learning process. It provides detailed picture of students’ strengths and weaknesses, in an area, along with the causes for deficiencies and a suggestive guide of remedial instructions. It can also be used as an inventory test to find how much the student knows about a given phase of the subject matter. However, the question is which type of test is called ‘diagnostic test’?
ISSN 2348-3083 SPECIAL ISSUE, VOL. I/I INNOVATIVE PRACTICES IN TEACHER EDUCATION
AES, NATIONAL CONFERENCE, 11-12, OCT, 2014 Page 25
So, it can be concluded that diagnostic testing is a mean of discovering the root cause of learning difficulty of student and getting guidelines for remedial instructions to be provided in order to remove those learning difficulties.
DIAGNOSTIC TESTING IN MATHEMATICS
Whenever one observes a student lagging behind in his studies in one or more subjects, there is need of diagnostic testing. In Mathematics, to diagnose is to find out the weaknesses and deficiencies of the pupils (Kheong, 1982). The cause of failure or difficulty may be any. Here, the teacher of Mathematics has to frame some remedial measures for helping students to get rid of their difficulties. Siddiqui (2005) pointed out that a teacher of Mathematics need to know the extent to which content and skills are mastered and it involves diagnosis of strengths and weaknesses of each student. Mangal (2008) defined diagnostic testing in Mathematics as a testing or evaluation programme carried out by a Mathematics teacher for, diagnosing the nature and extent of the learning difficulties and behavioural problems of individual or group of students along with the inherent causes for chalking out suitable remedial programmes aimed to help them in getting rid of their difficulties and problems.
Furthermore, the diagnostic tests can be constructed in general, with the following steps: 1. Fixing of objectives.
As with any other test, a clear definition of learning objective is required. The items of the diagnostic test are written for specific skills. And, each item tests a particular subskill from different perspectives.
2. Error Analysis
It can be done by analyzing students’ note-books and answer sheets. Here, patterns of errors are noted and errors are classified on the basis of type and frequency.
3. Content analysis
To have complete knowledge about the errors likely to occur, apart from error analysis, there is need to have a detailed analysis of the content. The test developer on the basis of his experience can imagine the types of errors students make while answering items based on the content in hand.
4. Identification of learning points and Fixing of order of difficulty of the content
The learning points are identified on the basis of error and content analysis done in the steps 2 and 3. The learning points are then sequenced hierarchically, particularly in the subject of Mathematics.
5. Decision about types of items
The items are written covering all the learning points. It is preferable to write items that can be answered ‘right’ or ‘wrong’.
6. Preparation of final draft of the test
ISSN 2348-3083 SPECIAL ISSUE, VOL. I/I INNOVATIVE PRACTICES IN TEACHER EDUCATION
AES, NATIONAL CONFERENCE, 11-12, OCT, 2014 Page 26
There are many paper-pencil diagnostic tests in mathematics, which can help in finding out the weaknesses of the students in the subject of Mathematics. But, they are not satisfactory. It may be difficult to use them for one or more of the following reasons:
1. Every use of the paper-pencil Diagnostic Tests in Mathematics demands extra efforts on the part of the teacher in terms of administration, scoring, and feedback.
2. Low content coverage. 3. No immediate feedback.
4. Lack of time on the part of teachers as they are assigned various curricular and non-curricular duties.
5. Presence of teacher is essential.
6. Students are not interested and get fatigued.
The result is that schools do not show interest in using Paper – Pencil Diagnostic Tests in Mathematics. There is one alternative, which can overcome the above stated problems in using Paper – Pencil Diagnostic Tests in Mathematics and that is Computer Based Diagnostic Tests in Mathematics.
COMPUTER – BASED DIAGNOSTIC TEST IN MATHEMATICS
The Information and Communication Technology promote a quality education and effective teaching- learning atmosphere for both a student and teacher (Tedla, 2012). ICT is being used in almost all levels of education in the areas of teaching, diagnostic testing, remedial teaching, evaluation, psychological testing, development of virtual laboratory, online tutoring, development of reasoning & thinking, and instructional material development (Sansanwal, 2009). If it is used there is enough scope for the learner to dynamically interact with the content to construct their own meaning. Such efforts can be made in the field of testing, to diagnose the strengths and weaknesses of students in a particular subject and then providing remedies. Such diagnostic testing making use of computers is called Computer Based Diagnostic Testing (CBDT). Further, Sansanwal (2009) mentioned the following advantages of CBDT:
They do not require any special setting or arrangement. The only requirements are computer systems and software.
The student can use it even from home, if made available on school website.
They do not need any special assistance from teacher. Unlike, the paper pencil test, it does not require the paper setting and correction on the part of the teacher.
It saves time on the part of teacher and students.
The feedback is given immediately after the test is over, which gives an intrinsic reinforcement to the student.
The student finds it more interesting and motivating as compared to the paper – pencil diagnostic test.
It can be updated from time to time.
It is economical in terms of money as it requires only one time investment.
ISSN 2348-3083 SPECIAL ISSUE, VOL. I/I INNOVATIVE PRACTICES IN TEACHER EDUCATION
AES, NATIONAL CONFERENCE, 11-12, OCT, 2014 Page 27
detailed information on the strands of subject matter being tested, and far better information on specific areas in which students need help.
The items in diagnostic test of Mathematics are arranged in a vertical hierarchy. The instructions are stated in clear and unambiguous words. There is no time limit.
CONCLUSION
To reap the benefits of mathematics education, it is essential to use identify learner’s strengths and weaknesses. There are many paper-and-pencil diagnostic tests in mathematics are available but due to their practical limitations of administration, scoring, and low content coverage, they are no more beneficial in the schools. In order to take full advantage of diagnostic testing, it is recommended to opt for CBDTM. The CBDTM has overcome the problems of paper-and-pencil diagnostic tests in mathematics and it needs only one time investment
REFERENCES
Betts, J. R., Hahn, Y., & Zau, A.C. (2011). Does diagnostic math testing improve student learning? San Francisco: Public Policy Institute of California. Retrieved from
http://www.ppic.org/content/pubs/report/R_1011JBR.pdf
Delandshere, G. (1985). Diagnostic Assessment Procedures. In T. Huśen and T.N. Postlethwaite (Ed.),
The international encyclopedia of education (pp. 1391-1394). New York: Pergamon Press. Gronlund, N.E. (1981). Measurement and evaluation in teaching. New York: MacMillan Publishing
Co., Inc.
Kheong, F. H. (1982). Diagnosis and remediation in mathematics. Teaching and Learning, 2(2), 19-22. Retrieved from https://repository.nie.edu.sg/bitstream/10497/2822/1/TL-2-2-19.pdf
Kumar, S. (1997). Teaching of mathematics. New Delhi: Anmol Publications Pvt. Ltd. Mangal,S. K.( 2008). Teaching of mathematics. Ludhiana: Tandon Publications.
Mishra, L. (2008). Teaching of mathematics. New Delhi: A.P.H Publishing Corporation.
NCF (2005). National Curriculum Framework. New Delhi: National Council of Educational Research and Training.
Rusbult, C. (2009). Effective learning skills (memory, concentration, reading & listening, exams, time use). Retrieved from http://www.asa3.org/ASA/education/learn/203.htm
Sansanwal, D. N. (2009). Use of ICT in teaching–learning & evaluation. New Delhi: Central Institute of Educational Technology.
Siddiqui, M. H. (2005). Teaching of mathematics. New Delhi: A.P.H. Publishing Corporation.
Singh, H., Avtar, R., & Singh, V. P. (2008). Handbook for designing mathematics laboratory in schools. New Delhi: NCERT.
Tedla, B. A. (2012). Understanding the importance, impacts and barriers of ICT on teaching and learning in East African Countries. International Journal for e-Learning Security (IJeLS), 2(3), 199-207.
ISSN 2348-3083 SPECIAL ISSUE, VOL. I/I INNOVATIVE PRACTICES IN TEACHER EDUCATION
AES, NATIONAL CONFERENCE, 11-12, OCT, 2014 Page 28
Mixed and Multi Methodologies in Educational Research
Mr. Kamble Vijay Nagnath, UGC NET Senior Research Fellow, Dept, of Education & Extension Savitribai Phule Pune University, Pune.
Mrs.Rupali Haribhau Khaire M.phil Scholar Tilak college of Education & Research center, Pune
Abstract
Education is a behavioral science, the major concern of educational research is to understand, explain, and to some degree predict and control human behavior. It is an activity directed towards the development of organized and useful body of scientific knowledge about the events with which educators are concerned. Mixed method and multi- method are the fastest growing areas in research methodology today. Its aim and benefits appear rather simple; take the best of qualitative (QL), and quantitative (QN) methods and combine them.
Multi- method Research is the strategy in that researcher can analyze his/her chosen topic with several different methods of analysis of the same generic type.i.e.either qualitative or quantitative. When researcher use both qualitative and quantitative methods that is Mixed methods research. Multi – method analysis increases the possibilities of getting varied and extensive results.
Keywords:-
Mix method, Multi- method, Qualitative and Quantitative research method
Educational research is the formal, systematic application of the scientific method to study of educational problems. Educational environment is quiet different because many known and unknown factors, and components operate in it. Educational process, environment is related with student, teacher, principal, staff, and infrastructure. So researcher can not easily generalize findings. Educational inquiry tries to ask some questions and expect answers. Educational research can be done with the help of quantitative and qualitative research methods.
Qualitative Research:-
Qualitative research is the collection, analysis, and interpretation of comprehensive narrative and visual (i.e. non numerical) data to gain insights into a particular phenomenon of interest. Mainly qualitative research focuses on different meaning, perspective, contest of people and groups.( Gay, Mills, & Peter, 2009)
ISSN 2348-3083 SPECIAL ISSUE, VOL. I/I INNOVATIVE PRACTICES IN TEACHER EDUCATION
AES, NATIONAL CONFERENCE, 11-12, OCT, 2014 Page 29
1) Qualitative research collects narrative and visual data over an extended period of time. 2) Data collection mostly done in naturalistic setting, it has smaller sample size.
3) Interaction with participants with the help of interview and observations. 4) Use of different method to understand the participants’ perspective. 5) Research questions give the correct direction to the study.
Different types of Qualitative Research
1. Case study research 2. Historical
3. Phenomenology 4. Ethnography 5. Grounded study
Quantitative Research:-
Quantitative research is the collection and analysis of numerical data to describe, explain, predict, or control the phenomenon of interest. Quantitative research can measure, understand, and generalize about the educational setting. (Gay, Mills, & Peter, 2009)
Characteristics of Quantitative Research:-
1. Quantitative research conducts in researcher controlled environments under researcher controlled conditions.
2. Researcher uses statistical procedures for data collection, analysis and writing 3. Quantitative studies investigate the relations between two or more variables. 4. Research hypothesis should be stated before beginning and has to be tasted.
Different types of Quantitative research:-
1) Survey 2) Co relational 3) Casual comparative 4) Experimental
Mixed Method Research:-
Mixed method research combines quantitative and qualitative data in a single study.
Mixed method research gives strength to understand a phenomenon more fully than is possible using either quantitative or qualitative method.
Characteristics of Mixed Method Research:-
a) Educational phenomena are so complex, so different kinds of methods are needed to understand these complexities.
b) It enables the researcher to answer confirmatory and exploratory questions at the same time, and as a result the researcher is able to construct and confirm theory.
c) It can provide explanations for seemingly contradictory results that emerge to using different methods.