Reliability Based Maintenance Planning of Wind
Turbine Using Bond Graph
John P.T. Mo
1,*, Daniel Chan
21School of Engineering, RMIT University, Australia 2PHM Technology Pty Ltd., Australia
Copyright©2017 by authors, all rights reserved. Authors agree that this article remains permanently open access under the terms of the Creative Commons Attribution License 4.0 International License
Abstract
Wind power generation is an effective form of clean, renewable energy which operates both on land and offshore. The primary means of converting wind to power is by wind turbines. The issue with wind turbines is high uncertainty of operating environment resulting in low life cycle reliability. Frequent breakdown failures resulting in reactive maintenance is costly which results in downtime and loss of production. FMEA has been used in some cases to develop maintenance schedule but the effect is minimal. This paper investigates a new method of determining faults from adverse operating conditions by bond graph model and combines with the concept of failure mode and effects analysis to simulate the effects of maintenance strategies on the mean time to failure of wind turbine components. The mean time to failure data can then be used to refine the maintenance task with additional inspections and replacements that can prevent breakdown failures and maximize the utilization rate of expensive components.Keywords
Wind Turbine, Reliability and Maintenance, Power Transmission, Bond Graph, Fault Analysis1. Introduction
Wind power is an effective form of clean, renewable energy which operates both on land and offshore. It is predicted to be ‘the most cost competitive electricity source on macro-economic level by 2025’ [1]. Wind energy is harvested by wind turbines which convert kinetic energy of rotating blades into electrical energy. A number of wind turbines in a locality and connected together electrically is called a wind farm. The power generated by wind turbines depends on wind speeds. Research to improve the effectiveness of converting wind flow to power has shown that wind turbine performance can be improved by analyzing wind velocity data [2], or by refinement of operating curves of wind turbines due to atmospheric environment [3].
Adverse conditions can cause wind turbines to fail. Saxena
and Rao [4] analysed wind turbine failures for a wind farm in India. They found that failure rate of yaw motor was highest, followed by gear-oil pump and then hydraulic unit of blade tip air brakes system. Hilario [5] found that the gearboxes had high failure rate that required replacing every 5 to 7 years. Structural damage occurs frequently as a consequence of high wind loads, fire damage and wildlife impact which have high financial risks due to environmental impacts. These failures are critical as they cause downtime and disrupt the primary function of wind turbines, i.e. power generation. Due to the complexity of the system and the fact that most wind turbines are installed at remote locations, the repair cost of is very high [6].
Wind turbine reliability depends on the reliability of key components. However, many key components are prone to fail. For example, a gearbox in a wind turbine serves the primary function of transmitting power from the rotor to the electricity generator. A gearbox failure causes long downtime due to extensive work in repairs or replacement. Chou & Tu [7] analyzed the failure of a wind turbine tower caused by Typhoon Jangmi. They concluded that the bolts were inadequate and quality control was the cause of the damage. Structural damage to the blades and tower are other common modes of failure. Likewise, the turbine blades may experience high wind loads or bird strikes, resulting in broken blades. Liu & Shang [8] conducted failure analysis on wind turbine blade bolts. Laboratory testing of stress, strain, alternating loads, tensile loads, hardness and toughness were undertaken and concluded failure of bolts occurred from fatigue due to high alternating loads.
Apart from mechanical failures, electrical system within the generator can cause an ignition, burning fuel vapors within the nacelle. Once a fire has started within the nacelle, it is highly unlikely to be extinguished due to the location and height of the fire. Since the 1980s, up to 30% of reported wind turbine accidents related to fire, with 90% of those leading to significant downtime or total loss of system [9].
fluids, lubrication and servicing of mechanical parts. Repairs and replacements would be conducted if deemed necessary by the technician. These time based inspections and maintenance activities are often expensive and require undesired downtime [10]. To reduce the cost of downtime, more active maintenance strategy such as prognostic health management is conducted through a SCADA system. Ongoing data is collected and analyzed for abnormalities during operation.
SCADA monitors the health of the system through various sensors and signals. Koohestani et al [11] applied space phase method to monitor the onset of chatter in machining process. The prediction method was supported by the theory that the online signal acquired from the process was modelled by Poincare map. Guo et al. [12] developed tower vibration model comprises two different parts: a sub-model used for the conditions that below rated wind speed and another for that above rated wind speed. Wang et al. [13] reviewed different methods of data driven approaching for SCADA data interpretation has been reviewed and an artificial intelligence (AI) based framework for fault diagnosis and prognosis of wind turbines using SCADA data was proposed. Lekou et al. [14] conducted conditional health monitoring on gearboxes and bearing using vibration acoustic emissions. They utilized accelerometers and strain gauge bridges to determine the operating frequency to use as a baseline measure for conditional monitoring. Failing components were tested to measure frequencies and compared to baseline measure to determine early failure detection. Guo and Infield [15] developed the Nonlinear State Estimation Technique (NSET) to model turbine tower vibration to good effect, providing an understanding of the tower vibration dynamic characteristics and the main factors influencing these. SCADA data from a single wind turbine was used to validate the model. The NSET model showed good preparation for the condition monitoring for wind turbine’s key components.
Unfortunately, many wind turbines’ performance still declined significantly and became uneconomical to operate after 10 years of operation. There have been 1868 accidents reported since 1900, of which 118 were critical, 174 structural failures and 345 blade failures [16]. Prognostic health management could be a good operating management strategy to minimize downtime and cost of operation but it does not focus on reducing breakdown failures [17]. To develop an effective maintenance plan, failure mode and effect analysis (FMEA) is the best methodology to build reliability into the system [18]. A good example is by Kang [19] who analysed floating offshore wind turbines in China and addressed the issues of system FMEA as well as correlation between failure modes. By analyzing a series of failure modes with high priority, they were able to suggest improvement for future floating wind turbine design.
The purpose of maintenance planning is to maximize the utilization of components and minimize the impact of failures causing unpredictable breakdowns. To do this,
maintenance schedule should be designed based in the mean time between failures, which is a typical outcome of a FMEA. However, FMEA requires a hybrid approach involving all relevant qualitative and quantitative records [20]. When applied in early or during operation, engineers have the advantage of making changes that are less costly in comparison to the changes that are made at the product warranty stage. This makes the tool effective in the reliability prediction and planning of the production cycle. When it comes to designing serviceability, a combination of cost and reliability parameters should be determined [21]. In the case of wind turbine FMEA analysis, due to the complexity in the volatility in the operating environment, more rigorous analysis should take into account the variation of stress conditions in operating lifecycle, which is missing in many FMEA of wind turbine.
This paper analyses life cycle reliability and maintenance of wind turbines using a failure mode model approach. To analysis the effect of variation of stress conditions, Bond Graph modelling is incorporated into the FMEA process to simulate the effect of changing maintenance strategies on the life cycle cost of wind turbines. The novel application of bond graph in this research solves the uncertainty of duty cycle effect on wear and tear. The analysis results can be used to determine the optimum maintenance schedules and preventive part replacements.
2. Literature Review
A wind turbine is a complex collection of components comprising rotors, pitch system, drive train, gearbox, generator, electrical system, mechanical brakes, yaw system, sensors, control system and hydraulics. To understand how the reliabilities of these components are affected by different maintenance strategies, it is important to develop a FMEA model for evaluating the failure modes and their criticality in wind turbine operations. The key FMEA decision indicator, risk priority number (RPN), relies on two pieces of information: (1) identification of the failure modes and their effects, (2) computation of probability of failure [22]. This literature review examines past researches that address the issues of identifying failure modes and calculation of probability of failure in FMEA.
2.1. Failure Modes Identification
which was in fact a two-step process for reliability analysis of large-scale networks. Zirilli [26] applied finite element simulation technique to analyse die crack failure mechanism. Integrating with a fault tree and Ishikawa diagram (also known as the fish-bone chart), the time of failure due to crack was estimated.
According to Teng and Ho [27], the FMEA procedure should be done in two phases. The first phase was done during the design stage in the production cycle, detailing the failures of each component and the entire manufacturing process. In the second phase of the FMEA, the failures were evaluated and ranked. The ranking should be done in a hierarchical manner with the most critical failure ranked as the highest and given first priority in during the revision of the design. In the revision, it is critical to ensure that the highest ranked failure does not appear again after redesigning.
These general principles are useful guidelines for applying FMEA to determine system reliability when the operating characteristics are well defined but for highly uncertain operating conditions that most wind turbines are used, more sophisticated tools and analysis are required. In this research, a FMEA computing tool is used and is further enhanced with failure rate variation s due to utilisation of the wind turbine model.
2.2. Failure Rate Estimation
De Rosa et al [28] examined the functional safety standards but found that conventional parameters such as mean time to failure were more useful to relate the probability of failure for supporting the design of system safety. Failure rate is the expected rate of failure of a component or system in a defined period of time. It changes over the service life of a system and its components. There are many factors influencing the value of failure rate [29]. The best known concept is the so called bathtub curve representation which models the failure rate curve like the shape of a bathtub over time. Failure rate is an important parameter in FMEA since it will lead to estimation of mean time to failure (MTTF). For example, to reduce the uncertainty in production planning, Al-Najjar [30] used a cumulative sum chart to monitor vibration level of production machines so as to determine the time initiation of a potential failure. The aim was to stop production before it turned into making rejects. This research illustrated that a good model of MTTF depends on utilization rate of production machines.
The accuracy of estimating failure rate varies according to the complex of the method used. Rose & Hungr [31] modelled rock slope failure mechanisms by a combination of structural geology, groundwater, rock mass strength and deformability, in situ stress conditions and seismicity. The model showed that by monitoring the displacement rate of the slope, slope failures could be predicted. Likewise, Osasan and Stacey [32] studied stability of mine slopes
which had a well-defined failure mode. To predict slope failure, they used an inverse velocity method to predict time to failure that provided adequate evacuation time for the operators. However, scarcity of data and the special formulation of problem space were issues to make this model generally useful.
Estimation of failure rate requires some kind of model fitting of data to statistical distributions. Belyi et al. [33] assumed a failure rate function and applied several statistical processes such as extended gamma to optimize maintenance schedule for a nuclear operating company. Peck et al [34] studied the statistics of failure rates recorded by vehicle inspection schemes in USA. Some of the states decided to abolish the inspection due to perception that the scheme did not improve road safety and increased cost of vehicle ownership. However, after analyzing the effect of inspection as a means of detection of potential failures, the researchers concluded that the data suggested otherwise. Jürgensen et al. [35] introduced a method to calculate individual failure rates of a transformer population based on non-electrical measurements such as dissolved gas and 2-furfuraldehyde analyses. The results were further evaluated by fuzzy logic to produce the individual failure rates. Standard statistical data models are useful to certain extent but their validity depends on correlation of data used in the analysis.
To ensure good correlation among the variables used in the system, Dashdondog et al. [36] outlined a failure rate calculation method for high power devices in space applications. The method used a threshold charge value of the electronic device which would fail depending on the amount of energy through the device. Dongiovanni and Iesmantas [37] combined fault tree analysis and Bayesian network to develop a statistical model that was used to assess failure rate for a secondary cooling system in Rankine cycle. The mean inherent availability was computed with an assumed duty cycle of around 80%. In case of wind turbine, bond graph modelling seems to be appropriate to bind the power flow to utilization of the system.
2.3. Bond Graph Modeling
Wind turbine can be modelled in different ways. Chen [38] studied the functional expressions of wind turbine blade chord and twist angle span-wise distribution and developed a new common functional equation of the blade shape. A 2.3MW wind turbine blade shape optimization model was established. Echavarría et al. [39] presented a new design philosophy based on functional redundancies and reconfiguration that can help to increase availability of wind turbines. In the event of a fault, the new design capabilities could be used to substitute the function of a faulty component and the system’s availability for operation could be analysed.
communication of system properties. Rosenberg [41] explored three perspectives of bond graph as a tool for design modern engineering systems, i.e. modeling of engineering systems, simulation of their behavior, and teaching about engineering systems. Using bond graphs, interactions among different physical domains, control subsystems, large-scale and complex systems could be modelling readily. Shoureshi & McLaughlin [42] enhanced bond graph methodology with the introduction of momentum equation for modelling thermofluid processes and systems. Their work could be used for multiphase, variable density flow thermofluid systems. Tan et al [43] developed a finite lump pseudo bond graph scheme for isothermal and isentropic pipe flows of ideal gas. A new element was created to model convective acceleration.
More recently, Bouamama et al. [44] presented a new approach to derive Analytical Redundancy Relations (AARs) from bond graph model of a system. The ARRs were then used to evaluate measured data so that discrepancy in matching the constraints in the bond graph model could be detected. This approach was successfully demonstrated using a two-tank system. Bryant [45, 46] formulated a bond graph system model for an electromagnetic launcher which had electric, magnetic, mechanical, and thermal subsystems. The model was able to analyse the characteristics of different parts of the launcher including the capacitor bank, magnetic flux, armature and rails numerically. Benmoussa et al. [47] used the properties of the bicausality and casual path of the bond graph to isolate and detect faults in the system. The fault diagnostic system study was able to highlight the sensors that could be used to monitor the performance of mechatronic system. Venkata et al. [48] proposed using bond graph for addressing systems with continuous energy sources, storage buffers, and communication links.
Application of bond graph to wind turbine modelling is rare. The technique bond graph uses power nodes to describe energy and power transfers in a dynamic system explicitly indicated by causal strokes. Bakka and Karimi [49] addressed the problem of bond graph methodology as a graphical approach for the modeling of wind turbine generating systems and validated a specific wind turbine generating system. Tapia and Medina [50] proposed a bond graph doubly-fed wind turbine generator control. The bond graph methodology and the concept of bicausality were used to derive and verify the control law system of the wind turbine.
3. Wind Turbine Reliability Modelling
The literature review shows that to model reliability of the wind turbine system using FMEA, an understanding of the failure rate of the system is required. In this research, in order to determine the change of failure rate over the service life of a wind turbine, a utilization pattern of the critical components in the FMEA model is required. Bond graph
model provides a means to relate the power flow in the system to the utilization rate of specific components. It is clear that the more energy the wind turbine generates, the system utilization increases. This implies many operational consequences including wear and tear, fatigue, deterioration due to raised temperature, etc. The following sections describe how the reliability of wind turbine is modelled in this research.
3.1. FMEA Modelling
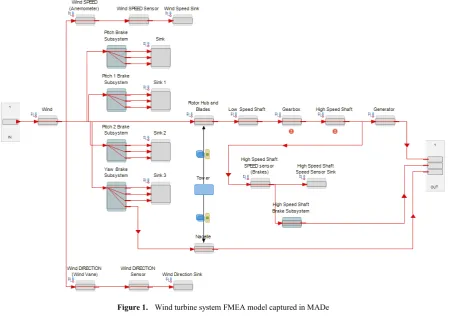
The FMEA of wind turbine is modelled by commercial software known as MADe, which stands for Maintenance Aware Design environment [51]. MADe is an engineering decision support tool that creates a model of the system consisting of functions, components, parts and their interactions. By assigning failure rates to the system’s components, failure modes and causes of failures can be identified. The modelling work starts with creating the model and assigning a function to the top level. In Figure 1, a wind turbine system is modelled in MADe. Starting with the function of wind, the energy is captured by rotor hub and blades that in turn converts angular velocity to electrical energy. Along with the main components of the wind turbine, supporting components such as wind sensor and orientation system are also modelled.
3.2. Wind Turbine Bond Graph Model
The reliability of the system model is affected by the operating conditions. In this research, in addition to capturing FMEA of the wind turbine in MADe, a bond graph model is also created to model strong wind that forces more energy to flow through the wind turbine components. If the limit of energy is reached, the component fails and hence triggers failure rate and reliability computation in the simulation.
The bond values assigned to each component are relative values to each component as the purpose of the simulation is to map the responses when it exceeds a specific margin. All sinks were set to 0.0 as they were the end effect and no further energy is being transmitted past that point. All sources are set to 10 as an arbitrary scale. Resistance values throughout the system are set relative to each other.
The bond diagram shows bidirectional dynamic energy transfer between components. Energy transfers, classified as either flows or efforts, are assigned to the component junctions; a 1 junction is a summation of flow energy and 0 junction is a summation of efforts. Other junctions include transformers which amplify the inputs or gyrators which converts flows to efforts and vice versa. Each system requires a source and ideally a sink.
The whole bond graph is too large to be displayed here. Figure 2 shows a part of the model that describes the pitch control that applies a brake to the piston so as to adjust the wind turbine to align with wind direction.
Figure 1. Wind turbine system FMEA model captured in MADe
[image:5.595.77.534.509.643.2]Figure 2. Pitch piston brake control component modelled by bond graph
Table 1. Bond group assigned to pitch piston brake control
Component Bond Group
Pitch Brake Control Source 2 Source Effort (SE)
Pitch 2 Brake Control Resistance (1-R)
Pitch 2 Brake Electric Motor Gyrator (GY)
Pitch 2 Brake Coupling Inertance and Resistance (1-IR)
Pitch 2 Brake Hydraulic Pump Transformer (TF)
Pitch 2 Brake Pipe Resistance (0-R)
Pitch 2 Brake Piston Inertance and Resistance (1-IR)
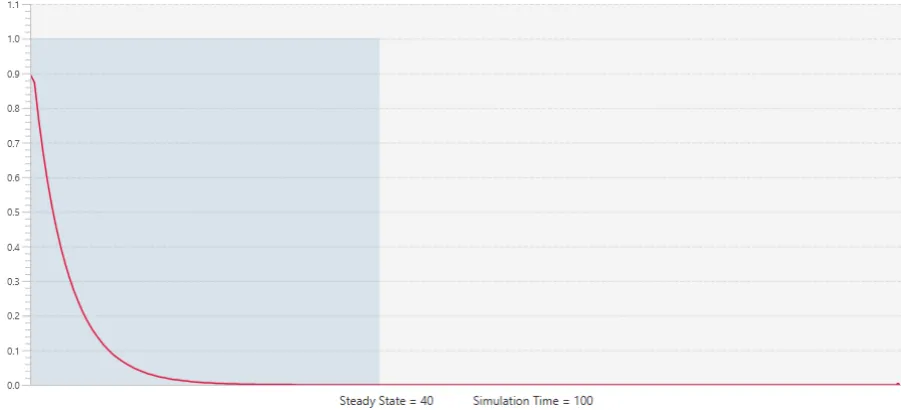
Figure 3. Simulated time response of pitch 2 brake coupling angular velocity under normal conditions
Figure 4. Simulated time response of pitch 2 brake coupling angular velocity under fault conditions
These parameters are developed as a series of equations which are solved simultaneously using the user-defined time-steps. Smaller time steps create more granularity in the response curves (Figure 3).
In the above simulation, we have set the steady state parameter at 40 with a total simulation time of 100. We can quickly conclude that these parameters are plausible as we can see the graph reaches a steady state before time = 40. We can now inject various failures into the system to simulate response on the system.
In Figure 4, we injected a failure of low angular velocity in the inertance component of the pitch 2 brake coupling. The sudden drop indicates the failure. We can see the system recovers from this failure as it returns to the steady state value. This is not always the case, the failure may resonate and exceed the failure threshold after which it will not recover and will be considered as a complete failure.
3.3. Failure Propagation
Failure propagation can be simulated in MADe to see how a failure will impact on the system. A high or low response can be injected to a component which will propagate the failure to the rest of the system.
Figure 5. Wind turbine FMEA Model simulated with faults under high wind load
Table 2. Simulated results of the system model under set maintenance strategies
Component Maintenance strategy Estimated MTTF (Years)
Gearbox Condition Based Repair - Continuous Monitoring 5.50
Generator Condition Based Service - Periodic Inspection 9.00
High Speed Shaft Condition Based Replace - Continuous Monitoring 4.145
High Speed Shaft Brake Control Condition Based Service - Continuous Monitoring 2.33
High Speed Shaft Brake Coupling Condition Based Replace - Periodic Inspection 12.10
High Speed Shaft Brake Disc Condition Based Service - Periodic Inspection 15.29
High Speed Shaft Electric Motor Scheduled Service 4.66
High Speed Shaft Brake Hydraulic Pump Condition Based Service - Continuous Monitoring 4.35
High Speed Shaft Brake Pipe Condition Based Replace - Periodic Inspection 12.77
High Speed Shaft Brake Piston Condition Based Replace - Periodic Inspection 17.94
High Speed Shaft Speed sensor (Brakes) Breakdown Replace 4.00
Low Speed Shaft Condition Based Replace - Continuous Monitoring 15.00
Nacelle Condition Based Repair - Periodic Inspection 4.20
Pitch Brake Controls Condition Based Service - Continuous Monitoring 2.33
Pitch Brake Couplings Condition Based Replace - Periodic Inspection 12.1
Pitch Brake Discs Condition Based Service - Periodic Inspection 15.29
Pitch Brake Electric Motors Scheduled Service 4.66
Pitch Brake Hydraulic Pumps Condition Based Service - Continuous Monitoring 4.35
Pitch Brake Pipes Condition Based Replace - Periodic Inspection 12.77
Pitch Brake Pistons Condition Based Replace - Periodic Inspection 17.94
Pitch Couplings Condition Based Replace - Periodic Inspection 12.10
Pitch Electric Motors Scheduled Service 4.66
Pitch Gearboxes Condition Based Service - Continuous Monitoring 5.50
Pitch Shafts Condition Based Replace - Periodic Inspection 15.00
Pitch Shaft Speed Sensors (Brakes) Breakdown Replace 4.00
Rotor Hub and Blades Breakdown Replace 7.14
Wind Vane Breakdown Replace 12.43
Anemometer Breakdown Replace 12.43
Wind Direction Sensor Breakdown Replace 4.00
Wind Speed Sensor Breakdown Replace 4.00
[image:7.595.65.548.280.753.2]Component Maintenance strategy Estimated MTTF (Years)
Yaw Brake Coupling Condition Based Service - Periodic Inspection 12.10
Yaw Brake Disc Condition Based Service - Periodic Inspection 15.29
Yaw Brake Electric Motor Scheduled Service 4.33
Yaw Brake Hydraulic Pump Condition Based Service - Continuous Monitoring 4.35
Yaw Brake Pipe Condition Based Replace - Periodic Inspection 12.77
Yaw Brake Piston Condition Based Replace - Periodic Inspection 17.94
Yaw Coupling Condition Based Service - Periodic Inspection 12.10
Yaw Drive Control Condition Based Service - Continuous Monitoring 2.33
Yaw Electric Motor Condition Based Service - Periodic Inspection 4.66
Yaw Gearbox Condition Based Service - Continuous Monitoring 5.50
Yaw Shaft Condition Based Replace - Periodic Inspection 10.00
Yaw Shaft Speed Sensor (Brakes) Breakdown Replace 4.00
Using MADe, by running through the potential failure modes of the wind turbine model and including those possible adverse operating conditions that trigger failure conditions in bond graph model, the simulation is able to compute mean time between failures of different components in the system.
4. Results
The system model with the bond graph model incorporated has been simulated on the basis of 20 years of service life and typical 60% to 70% utilisation rate. Maintenance actions were set per component as one of the strategies: scheduled, condition based, breakdown. The simulated results are shown in Table 2. These results match closely to the mean time to failure of historical failure rates.
While this is the first attempt to combine bond graph with FMEA model of wind turbine to compute MTTF, the results are already showing potential to be used for setting an optimum maintenance schedule for the wind turbine. The maintenance strategy in Table 2 is determined from analyzing the fault tree and impact of the fault to the performance of the system. The new MTTF results can be used to set inspection or replacement tasks in a routine maintenance schedule activity so that the high cost of breakdown repairs (including downtime cost) can be avoided.
5. Conclusions
Wind turbine maintenance has a lot of uncertainties due to the volatile operating conditions in which the wind turbine is installed. While wind turbine design has been improved substantially in the last decade from efficiency and durability perspective, the failures of wind turbine has not been reduced significantly. FMEA has been used in some wind turbine
design development but the failure mode analysis has not achieved the expected accuracy of failure rate application. This is largely due to the lack of understanding of the changing duty cycle of wind turbine in service.
This research investigated the new method of integrating bond graph model of the wind turbine system to the potential failures of wind turbine due to sudden change in operating conditions. The FMEA software MADe is used to capture the failure modes of wind turbine. Faults due to adverse operating conditions are computed by bond graph power flow model. The triggered faults are then propagated through the MADe model and the MTTFs of the components responsible for the failures are computed.
Using the MTTF values, and combined with the maintenance strategies derived from the fault trees, maintenance tasks can be better planned based on the reliability found by the FMEA model. The outcome is expected to optimize the maintenance efficiency so that critical breakdowns can be prevented while minimizing the effectiveness of parts replacement.
REFERENCES
[1] NREL. Development of Operations and Maintenance Cost Model to Identify Cost of Energy Savings for Low Wind Speed Turbines. National Renewable Energy Laboratory, 2008 [online: http://www.nrel.gov/docs/fy08osti/40581.pdf, viewed 8 Apr. 2016].
[2] Elmore, A., Gallagher, R. Using Regional Climate Center Data to Predict Small Wind Turbine Performance. Pract. Period. Hazard. Toxic Radioact. Waste Manage, 2009, 13(1):14-19.
[3] Heller, A. Predicting Wind Power with Greater Accuracy, Lawrence Livermore National Laboratory, S&TR, April/May, 2014, [online at:
[4] Saxena, B.K., Rao, K.V.S. Wind turbine failure analysis for wind farm at Devgarh in Rajasthan. 2013 International Conference on Renewable Energy and Sustainable Energy (ICRESE), 5-6 December, 2013, p.196-199, Coimbatore, India.
[5] Hilario, C. Wind Turbine Inspection, a Strategic Service?
DEWI Magazine, No.39, 2011 [online at:
http://www.dewi.de/dewi_res/fileadmin/pdf/publications/Ma gazin_39/08. pdf , viewed 18 May, 2016].
[6] IRENA. Renewable Energy Technologies: Cost Analysis Series. IRENA Working Paper Volume 1: Power Sector, (5/5), 2012 [online at:
https://www.irena.org/documentdownloads/publications/re_t echnologies_cost_analysis-wind_power.pdf, viewed 15 Apr. 2016].
[7] Chou, J., Tu, W. Failure analysis and risk management of a collapsed large wind turbine tower. Engineering Failure Analysis, 2011, 18(1):295-313
[8] Liu, D, Shang, X. Failure Investigation of the Wind Turbine Blade Root Bolt. J Fail. Anal. and Preven., 2013, 13(3):333-339.
[9] Smith, C. Fires are major cause of wind farm failure, according to new research. Imperial College London, 2014
[online at: http://www3.imperial.ac.uk/newsandeventspggrp/imperialcol
lege/newssummary/news_17-7-2014-8-56-10, viewed 10 Jun 2016].
[10] Lu B, Li Y, Wu X, Yang Z. A review of recent advances in wind turbine condition monitoring and fault diagnosis. IEEE Power Electronics and Machine in Wind Application, PWMWA2009, 24-26 June, 2009, pp.1-7
[11] Koohestani, A., Mo, J.P.T., Yang, S. Application of linear regression model on chatter threshold delineation, Journal of Engineering Manufacture, 2015, 229(8), 1337-1347 [12] Guo, P., Xu, M., Bai, N., Ma, D. Wind turbine tower vibration
modeling and monitoring driven by SCADA data,
Proceedings of the Chinese Society of Electrical Engineering, 2013, 33(5):128-135
[13] Wang, K-S, Sharma, V.S., Zhang, Z-Y. (2014). SCADA data based condition monitoring of wind turbines, Advances in Manufacturing, 2014, 2(1): 61–69
[14] Lekou, D.J., Mouzakis, F., Anastasopoulo, A.A., Kourosis, D. Fused Acoustic Emission and Vibration Techniques for Health Monitoring of Wind Turbine Gearboxes and Bearings.
European Wind Energy Conference and Exhibition (EWEC),
16-19 March, 2009, pp.78-82, Marseille, France.
[15] Guo, P., Infield, D. Wind Turbine Tower Vibration Modeling and Monitoring by the Nonlinear State Estimation Technique (NSET), Energies, 2012,5:5279-5293
[16] Caithness Windfarm Information. Summary of Wind Turbine Accident data to 31 March, 2016. [online at: http://www.caithnesswindfarms.co.uk/accidents.pdf, viewed 18 May 2016].
[17]\ Abichou, B., Florez, D., Sated-Mouchaweh, M., Toubakh, H., Francois, B., Girrad, N. Fault Diagnosis Methods for Wind Turbines Health Monitoring: a Review. European Conference of the Prognostics and Health Management Society, 8-10 July, 2014, Nantes Cedex, France
[18] Lee, J.S. & Kim, Y.S. Analysis of cost-increasing risk factors in modular construction in Korea using FMEA. KSCE Journal of Civil Engineering, 2016, pp. 1-12.
[19] Kang, J. Risk assessment of floating offshore wind turbine based on correlation FMEA, Ocean Engineering, 2017, 129:382-388
[20] Sankar, R.N., Prabhu, B.S. Modified approach for prioritization of failures in a system failure mode and effects analysis. International Journal of Quality & Reliability Management, 2001, 18(3):324-336.
[21] Rhee, S.J., Ishii, K. (2003). Using cost based FMEA to enhance reliability and serviceability. Advanced Engineering Informatics, 17(3): 179–188.
[22] Von Ahsen A. Cost-oriented failure mode and effects analysis.
International Journal of Quality & Reliability Management, 2008; 25(5):466-476.
[23] Loganathan, M.K., Gandhi, M.S., Gandhi, O.P. Functional cause analysis of complex manufacturing systems using structure. Journal of Engineering Manufacture, 2015, 229(3):533–545.
[24] Li, S., Zeng, W. Risk analysis for the supplier selection problem using failure modes and effects analysis (FMEA).
Journal of Intelligent Manufacturing, 2016, 27(6):1309-1321 [25] Ishibashi, K., Furuta, H., Nomura, Y., Nakatsu, K., Takahashi, K. Application of Metaheulistic Method to Reliability Analysis for Lifeline Network Involves Multiple Failure Modes, Journal of the Society of Materials Science, Japan, 2014, 63(2): 143-148.
[26] Zirilli, T. Die crack failure mechanism investigations depending on the time of failure, Microelectronics Reliability, 55 (2015) 1600–1606.
[27] Teng, S.H., Ho, S.Y. Failure mode and effects analysis: an integrated approach for product design and process control.
International Journal of Quality & Reliability Management, 1996, 13(5):8-26.
[28] De Rosa, F., Cesoni, R., Genta, S., Maggiore, P. Failure rate evaluation method for HW architecture derived from functional safety standards (ISO 19014, ISO 25119, IEC 61508), Reliability Engineering and System Safety, 165 (2017) 124–133.
[29] Herrold, G R. Failure rate by mode of failure data (Failure/success data approach used in performance reliability analysis of designs and referred to as failure rate by mode of failure data), National Symposium on Reliability and Quality Control, 11th, Miami Beach, Florida; USA, 12-14 January, 1965
[30] Al-Najjar, B., Determination of potential failure Initiation Time using Cumulative Sum Chart, IFAC (International Federation of Automatic Control), 49-28 (2016) 043–048. [31] Rose, N.D., Hungr, O. Forecasting potential rock slope failure
in open pit mines using the inverse-velocity method,
International Journal of Rock Mechanics & Mining Sciences, 44 (2007) 308–320.
pp.275-280.
[33] Belyi, D., Popova, E., Mortonm, D.P., Damien, P. Bayesian failure-rate modeling and preventive maintenance optimization, European Journal of Operational Research, 262 (2017) 1085–1093.
[34] Peck, D., Matthews, H.S., Fischbeck, P., Hendrickson, C.T. Failure rates and data driven policies for vehicle safety inspections in Pennsylvania, Transportation Research Part A, 78 (2015) 252–265.
[35] Jürgensen, J.H., Nordström, L., Hilber, P. Individual failure rates for transformers within a population based ondiagnostic measures, Electric Power Systems Research, 141 (2016) 354– 362.
[36] Dashdondog, E., Harada, S., Shiba, Y., Omura, I. Failure rate calculation method for high power devices in space applications at low earth orbit, Microelectronics Reliability, 64 (2016) 502–506.
[37] Dongiovanni, D.N., Iesmantas, T. Failure rate modeling using fault tree analysis and Bayesian network:DEMO pulsed operation turbine study case, Fusion Engineering and Design, 109–111 (2016) 613–617.
[38] Chen, J. The application of functional theory to the design of new wind turbine blades, Journal of Chongqing University, 2011, 34(7):14-19.
[39] Echavarría, E., Bussel, G.J.W., Tomiyama, T. Finding functional redundancies in offshore wind turbine design,
Wind energy, 2012, 15(4):609-626.
[40] Rosenberg, R.C., Karnopp, D.C. A Definition of the Bond Graph Language, Journal of Dynamic Systems, Measurement, and Control, Trans. of the ASME, 1972, 94(3):179-182. [41] Rosenberg, R.C. Reflections on Engineering Systems and
Bond Graphs, Journal of Dynamic Systems, Measurement, and Control, Trans. of the ASME, 1993, 115:2(B):242-251. [42] Shoureshi, R., McLaughlin, K. Application of Bond Graphs
for Thermofluid Processes and Systems, Journal of Dynamic Systems, Measurement, and Control, Trans. of the ASME, 1985, 107(4):241-245.
[43] Tan, J.G., Stelson, K.A., Janni, K.A. Compressible-Flow Modelling With Pseudo Bond Graphs, Journal of Dynamic Systems, Measurement, and Control. Trans. of the ASME, 1994, 116(2):272-280.
[44] Bouamama, B. O., Samantaray, A. K., Staroswiecki, M., & Dauphin-Tanguy, G. Derivation of constraint relations from bond graph models for fault detection and isolation.
Simulation Series, 2003, 35(2), 104-109.
[45] Bryant, M.D. A Bond Graph Model of an Electromagnetic Launcher - Part 1: Structure and Details, IEEE Transactions on Plasma Science, vol. 39, no. 1 (2011) p. 29-39.
[46] Bryant, M.D. A Bond Graph Model of an Electromagnetic Launcher - Part 2: Simulation Results, IEEE Transactions on Plasma Science, vol. 39, no. 1 (2011) p. 40-47.
[47] Benmoussa, S., Bouamama, B.O., Merzouki, R. Bond Graph Approach for Plant Fault Detection and Isolation: Application to Intelligent Autonomous Vehicle, IEEE Transactions on Automation Science and Engineering, vol. 11, no. 2 (2014) p. 585-593.
[48] Venkata, P.T., Nambi, A.U.S., Prasad, V.R., Niemegeers, I. Bond Graph Modeling for Energy-Harvesting Wireless Sensor Networks, Computer, 2012, 45(9): 31-38.
[49] Bakka, T., Karimi, H.R. Bond graph modeling and simulation of wind turbine systems, Journal of Mechanical Science and Technology, 2013, 27(6):1843-1852.
[50] Tapia R, Medina, A. Doubly-fed wind turbine generator control: A bond graph approach, Simulation modelling practice and theory, 2015, 53:149-166.