IMAGE RETRIEVAL USING MULTI TEXTON
CO-OCCURRENCE DESCRIPTOR
1AGUS EKO MINARNO, 2NANIK SUCIATI
1
Universitas Muhammadiyah Malang, Malang, Indonesia 2
Institut Teknologi Sepuluh Nopember, Surabaya, Indonesia
E-mail: [email protected] , [email protected]
ABSTRACT
One of many method for image retrieval is Multi Texton Histogram (MTH) that incorporated feature extraction technique. Though the MTH is able to represent the image very well, it’s still has weaknesses. First, the MTH is only using local features to represent image. Second, in the process of pixel pair detection using texton, there is information missing that caused image representation may degrade. This study proposes a new method in order to extract image features for the image retrieval system. The proposed method is named Multi Texton Co-Occurrence Descriptor (MTCD). The MTCD is extracting color, texture and shape features simultaneously using texton, and then calculating image representation globally using Gray Level Co-occurrence Matrix (GLCM). This study used 300 Batik images and 15000 Corel images as datasets. Image similarity is calculated using Canberra and MTCD performance is measured using precision and recall. Our experiments show that by adding 2 new textons and GLCM, the precision rate is increased by 2.86% for Batik dataset, by 3.40%for Corel 5,000 and by 3.06% for Corel 10,000. We conclude that MTCD performance is superior than MTH.
Keywords:Batik, Image retrival, Texton, Gray Level Co-occurrence Matrix
1. INTRODUCTION
Image retrieval is one of many topic in computer vision and pattern recognition study. Although many studies have been conducted in this research area, this problem is still challenging. Study of image retrieval is started in around 1970 when the use of text is not optimal [1], because every image need a label. The problem is raised when a large number of images should be labeled by human. A manual labeling suffers for inefficiency and subjectivity. From the early of 1990 until today, the study of image retrieval is attracted many researchers. There are Query By Image Content (QBIC) that is builded by IBM, Netra that is builded by UC Santa Barbara, Blobworld that is builded by UC Berkeley, MARS that is builded by the University of Illinois, Image Rover that is builded by Boston University and many more [2]. Most of those technologies are incorporating color, texture and shape features independently or simultaneously. Color feature is the most popular and the easiest feature for discriminating images. J. Huang has been proposed a method for images indexing used 3 dimensional tables that based on color and pixel distance. The
tables are describing a spatial relationship on images on color shifting. The aim of indexing is to easier searching process on the database when there is a query image [3]. Study on texture has been proposed in pattern recognition, classification and object detection. Julesz has analyze texton interaction for discriminating texture. A texton may be composed by several pixels. The study showed that texton with a simple statistic method is able to present visual perception to discriminate texture significantly [4]. Texture study is also conducted by Haralick using Gray Co-Occurrence matrix (GLCM). GLCM uses statistical method at first order and second order to produce 14 features. The features example are mean, variance, correlation, energy and homogeneity [5]. The one of feature extraction method for image retrieval that uses Corel data is MTH. However, MTH still has difficulties to represent features. Firstly, MTH is only using local feature when representing an image. Secondly, in the process of pixel pair detection using texton, there is information missing that caused image representation may degrade.
loss of information may be neglected. The proposed steps are started by extracting color, texture and shape features simultaneously using texton, and then calculating GLCM as global representation of image. Texton is used to detect pixel pair concurrency in quantized RGB color and quantized edge orientation and GLCM is used to represent an image globally using energy, entropy, contrast and
correlation features. The proposed feature
extraction method is named Multi Texton Co-Occurrence Descriptor (MTCD).
2. RELATED WORK
Jain et al. has proposed an image retrieval method that used shape and color features on 400 logo images [6]. Then, Liu et al. in 2008 was developed an image retrieval method that utilized texton as proposed by Julesz. The method is known as Texton Co-Occurrence Matrix (TCM). TCM is utilizing 5 types of texton as the kernel for extracting features and producing micro structure map. They used 2.000 images from Corel dataset
and Vistex MIT in their experiment [7]. Then, Liu
et al. modified TCM to become MTH in order to improve TCM performance. The difference of TCM and MTH is on the type of texton and the shifting of texton. MTH is utilizing 4 different textons to TCM and shifted for each two pixels
instead of one pixels in TCM [8]. Liu et al. ,again ,
improved their method by proposing Micro Structure Descriptor (MSD). MSD uses 3x3 kernel variation to extract features. MSD compares center value of kernel to 8 neighbor values. Only values that equal to the center value are accumulated as
histogram [2]. Naturally, human visualization is
able to differentiate edge orientation and color difference in an image. This became motivation for Liu et al. to propose Color Difference Histogram
(CDH) for image retrieval system that
accommodates psychological theory that based on
human visual perception [9]. In 2014, the
improvement of MSD has been proposed by Minarno et al. Their method is called Enhanced Micro Structure Descriptor (EMSD). EMSD is build by adding edge orientation feature to the histogram of MSD [10]. The another paper has been proposed also by Minarno using combination of CDH and GLCM. The proposed method show the combination is yielding better performance
[11]. Geometric feature extraction of Batik image
proposed by Fanani for optimizing clothing design [12].
3. MULTI TEXTON CO-OCCURRENCE DESCRIPTOR
The main idea in this study is combining feature extraction method that proposed by Liu et al., MTH, and feature extraction method that proposed by Haralick, GLCM. However, there is a problem in MTH in the case of the lost of pixel
information. Therefore, in this study, we
contributed to improve MTH by adding new textons to detect information that lost. The second contribution is the use of GLCM to detect global features and combining with local features that extracted by MTH. The feature extraction method in MTCD has three main steps. First, detecting local features uses MTH. Second, detecting global features used GLCM. Finally, representing all detected features as histogram.
3.1 Multi Texton Histogram
3.1.1 Edge Orientation Quantization
Edge orientation is important for creating human vision perception to an image. Study by Zenzo describes how to get gradients of color image [13]. Each RGB component is detected for horizontal orientation (gxx), vertical orientation (gyy) and combined orientation (gxy) using Sobel operator. Gradient is composed using magnitude and direction components. In order to get the maximum direction change in gradient, the equation (1) is used:
φ(x,y) = 1/2 arctan(2gxy/(gxx-gyy))
(1)The magnitude of direction is calculated using the equation (2) and (3).
G1 (x,y)={1/2 [(gxx+gyy)+(gxx-gyy)
cos 〖2φ+2gxysin2φ〗 ]}^(1/2) (2)
G2(x,y)={1/2 [(gxx+gyy)+(gxx-gyy)
cos 〖2(φ+π/2+2gxysin2(φ+π/2〗 ]}^(1/2) (3)
The following equation is to find maximum
gradient value (Fmax):
Fmax=max (G1,G2) (4)
Where:
(5)
3.1.2 Color Quantization
histogram is well used as feature for image retrieval. In this study, we used RGB color space. Components of RGB color space are quantized in m bins. For example, if 4 bins are used, the value of component R, G and B are between 0 and 63.
3.1.3 Texton Detection
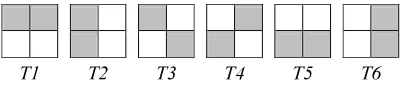
The next step after color quantization and edge orientation quantization is texton detection. In the previous study, Liu used 4 types of texton to create histogram in MTH. Textons that used in MTH are shown in Figure 1. MTCD is improving MTH by adding two textons, so there are 6 textons. The new textons are horizontal bottom and vertical right. The aim of the addition is to prevent the loss of information when pixels are co-occurred on horizontal bottom and vertical right. Textons that used in MTCD can be seen in Figure 2 which T1, T2, T3 and T4 are the original MTH textons and T5 and T6 are the additional textons.
V1 V2 V3 V4
[image:3.595.301.509.74.271.2]Grid
T1 T2 T3 T4
Figure. 1: Grid and MTH Textons. (Left) Grid; (T1- T4) MTH Texton.
[image:3.595.93.284.359.403.2]
T1 T2 T3 T4 T5 T6
Figure. 2: MTCD Textons
[image:3.595.307.509.430.625.2]Feature extraction process in MTCD is utilizing 6 textons that are convoluted on the quantized color image and the quantized edge orientation image. The convolution step is conducted from left to right and from top to the bottom by two pixels. The grid dimension that used is 2x2 pixels that are marked as v1, v2, v3 and v4. If there are two same pixels, then the grid is detected as texton. The calculation of texton’s is based on the quantization value. As an example, when detecting using T1 on quantized RGB image, if there is a grid that matched T1 and the quantized R value of the detected pixels are 10, then R component with value 10 is increased. The total numbers of each component with a particular value are stored as histogram and used as texton features. The illustration of MTCD texton detection is shown in Figure 3 (e-h).
Figure. 3: Difference MTH and MTCD Texton Detection. (a-d) Texton Detection of MTH; (e-h) texton
Detection of MTCD.
3.2 Gray level Co-Occurrence Matrix
The use of GLCM in MTCD is contributing to
the addition of 4 features, those are energy, entropy,
contrast and correlation. The first step of GLCM is
converting RGB image into grayscale image. The second step is creating co-occurrence matrix. The third step is deciding spatial relationships between reference pixel and neighbor pixel. Parameters that
used are angle value (θ) and distance value (d).
Figure. 4: GLCM constructions. (a) An original image, (b) GLCM indices, (c) Co-occurrence matrix, (d)
Probability value
[image:3.595.89.289.443.493.2]extraction is shown in Figure 4. In this study, each GLCM feature is utilizing the pixel distance at 1 on 4 directions (0°, 45°, 90° dan 135°) to detect co-occurrence. If GLCM has LxL matrix which (L) is the number of original image gray level and if the probability (P) of pixel (i) and neighbor pixel (j) in distance (d) and angel orientation, then energy, entropy, contrast and correlation features can be calculated following equations (6), (7), (8) and (9).
Angular Second Moment or energy is used to
measure image homogeneity. If energy value high the image is highly homogen. Equation 6 is for measuring energy.
(6)
Entropy is the opposite of energy. This feature is representing the randomness of an image. Entropy is calculated using equation 7.
(7)
Contrast is representing image gray level. The image with smooth texture causes low contrast value. On the opposite, image with harsh texture cases high contrast value. Contrast is measured by equation 8.
(8)
Correlation is used to measure linear
relationship between pixels. Correlation is
calculated using equation 9.
(9)
Where :
,
,
,
3.3 MTCD Feature Representation
All of MTCD features are derived from quantized RGB color, quantized edge orientation and GLCM features. The value of quantized RGB color that detected by texton represents colors spatial structure of the image. Then, the value of quantized edge orientation that computed using Sobel operator and that detected by texton represents texture and shape. If RGB color is quantized into 4 bins, then the total number of color features is 64. Moreover, if edge orientation is quantized into 18 bins, then there are 18 edge orientation features. When 4 features of GLCM are measured from 4 direction (0°, 45°, 90° and 135°), then resulting 16 global features. So, totally, there 64 + 18 _ 16 = 98 features in MTCD. These features are used to representing each image in database, and then are used to measure the similarity between query image and collection images.
4. RESULT AND DISCUSSION
4.1 Dataset
Data that usually used for image retrieval is
Brodatz, OUTex, Vistex, Corel, and Batik. In this
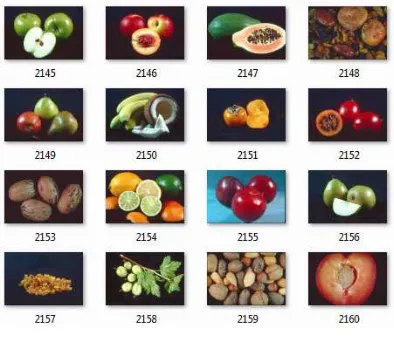
study, Corel dataset that used is obtained from (http://www.ci.gxnu.edu.cn/cbir/Dataset.aspx) and Batik dataset is obtained from the Laboratory of Vision, Image Processing and Graphics (VIP-G) Institut Teknologi Sepuluh November. This study is evaluating the performance of MTCD using Corel and Batik datasets. Between these two datasets, the Corel dataset is more widely used in previous study. Corel dataset contains natural images that represent shape and color features. The use of Batik dataset is because there are numerous repetitive motif represent the texture features.
Figure 5 and Figure 6 are an example of images in Corel and Batik dataset respectively.
Figure 5: Example of Batik Dataset
Figure 6: Example of Corel Dataset
4.2 Distance Measure
The similarity between query images and images in the database is measured using modified Canberra distance (Liu, 2013). If images in
database are T=[T1,T2,…Tn] and query images are
Q=[Q1,Q2,…Qn] then distance D between T dan Q
is:
(10)
Where and . The
The results of image retrieval are shown based on a
distance measurement value from the closest to the farthest.
4.3 Performance Evaluation
For measuring performance, we used precision and recall that described as follow:
Precision= Img /ImgRet (11)
Recall = Img / ImgDb (12)
Where, Img is the number of relevant images
that has been retrieved. ImgRet is the number of
images that has been retrieved. ImgDb is the
number of relevant images in the database.
Precision is used to see whether the retrieved
images are correct in order. Recall is used to
evaluate the ability of the image retrieval system to find relevant images from the database.
4.4 Retrieval Result
The different between MTH and MTCD is in the use of local features only in MTH and the use of local and global features in MTCD. Local features in MTH are produced by the detection process utilizing four textons on edge orientation image and color orientation image. In the opposite, features of MTCD are detected using six textons on the same images as MTH. The global features of MTCD are produced using GLCM consisting energy, entropy, contrast and correlation features. Our experiment, then, conducted to see whether the addition of two textons will increase MTH performance or not.
We also interested to know whether the use of global features by utilizing GLCM may improve retrieval performance or not. It is also important to test MTCD to Batik dataset and comparing to Corel dataset. This is because images in Batik dataset have special motifs in various color, texture, shape and size. The comparison of image retrieval performance is performed for twelve retrieval images from Corel dataset and 4, 6, 8 retrieval images from Batik dataset. We are also conducted several test scenario in order to know:
a. The suitable quantization size of edge
orientation in MTCD.
b. The suitable quantization size of color in
MTCD.
c. The effect of adding 2 textons.
d. The effect of GLCM features.
e. The effect the use of additional textons and
The experiment firstly was conducted on 300 Batik images in 50 categories. Each category is consisted of 6 images. From these 6 images, 1 image is randomly chosen as the data test, so totally we have 50 data test. Second, we conducted experiment on Corel 5,000 and Corel 10,000 in 50 and 100 categories respectively. There are 100 images per category. From these 100 images, 50 images are chosen randomly as the data test, so totally there are 2,500 images for Corel 5,000 dataset and 5,000 images for Corel 10,000 dataset.
The first test on the quantization size of edge orientation was carried out in order to know the best size. The test was conducted on MTH with 4 textons and MTH with 2 additional textons. The test was run for 5 types of size; those are 6, 12, 18, 24, 36. When applying the scenario to Batik data set for 4, 6 and 8 image’s retrieval, the quantization size at 18 performs best. The overall result can be seen in Table 1.
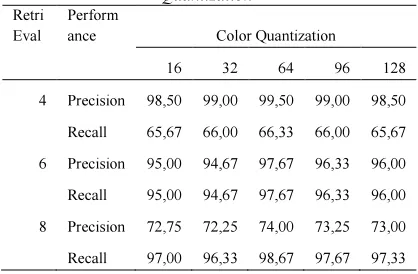
The second test is similar to the first test, but it is for the quantization size of color. The test was run for 5 types of size; those are 16, 32, 64, 96 and 128. The test was the only concern on MTCD with 6 textons. The result shows that the best quantization size of color with MTCD is 64. The overall result is shown in Table 2.
The third test was performed to compare the performance of MTH with 4 textons to MTH with 2 additional textons. In general, we need to know the effectiveness of textons addition. The result of this test is presented in the Table 3. It seems that the additional textons may improve precision around 1% for Batik dataset and around 0.5% for both Corel dataset. There are also improvements of recall value for all datasets. Therefore, we conclude that the additional of 2 textons is able to improve MTH performance.
[image:6.595.303.511.110.230.2]The fourth test was conducted to evaluate the use of global features that extracted by GLCM with MTH. The result is presented in Table 3. In the table, we can see that the average precision and the average recall for retrieving 4, 6 and 8 images from Batik dataset are increased at 2.28% and 2.45% respectively. However, the use of global features may increase computation complexity because the number of total features is increased.
Table 1. Average Retrieval Precision Of Edge Orientation Quantization
Ret rieval
Perform
ance Edge Orientation Quantization
6 12 18 24 36
4 Precision 99,50 99,50 99,50 99,50 98,50
Recall 66,33 66,33 66,33 66,33 65,67
6 Precision 96,67 97,33 97,67 97,00 94,00
Recall 96,67 97,33 97,67 97,00 94,00
8 Precision 74,25 74,00 74,00 74,00 73,50
[image:6.595.303.512.267.404.2]Recall 99,00 98,67 98,67 98,67 98,00
Table 2. Average Retrieval Precision Of Color Quantization
Retri Eval
Perform
ance Color Quantization
16 32 64 96 128
4 Precision 98,50 99,00 99,50 99,00 98,50
Recall 65,67 66,00 66,33 66,00 65,67
6 Precision 95,00 94,67 97,67 96,33 96,00
Recall 95,00 94,67 97,67 96,33 96,00
8 Precision 72,75 72,25 74,00 73,25 73,00
Recall 97,00 96,33 98,67 97,67 97,33
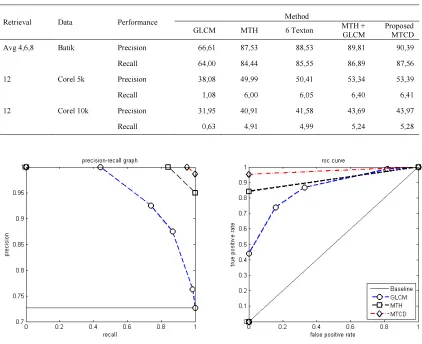
The final test was conducted to evaluate the effectiveness of the addition of 2 new textons for MTH combined with the use of global features (MTCD test). Totally, there are 98 features that used, which consisted of 18 edge orientation features, 64 color features and 16 global features. The result is presented in the Table 3. In this scenario, we compare the use of original MTH to MTCD. The result shows an increasing precision at 2.86% for Batik dataset, 3.40%for Corel 5,000 and 3.06% for Corel 10,000. It is clear that the use of additional textons and global features may improve precision significantly. Moreover, it seems that MTCD precision is increased when the number of image collection is increased.
The comparison between MTH and MTCD is also presented in Figure 7. Time consumtion to extract features from an image using GLCM is 0.067 second, using MTH is 0.118 second and using MTCD is 0.157 second. If n is quantization size of gray co-occurrence matrix, then GLCM
complexity is O(n2), MTH complexity is O(n2) and
MTCD complexity is O(2n2) or can be written as
O(n2).
5. CONCLUSION
addition of 2 new textons to detect a particular pixel’s pair that can’t be detected by MTH textons. MTCD is also utilizing GLCM to extract global features. Analysis and test has been conducted in order to know performance improvement by utilizing MTCD. Based on all tests, we can see that MTCD which incorporates 2 new textons and GLCM features is superior than MTH. The use of 2
new textons increase 1% until 3.06% of precision for Batik dataset, Corel 5,000 dataset and Corel 10,000 dataset.
[image:7.595.89.511.256.600.2]The test result of MTCD for Batik and Corel datasets shows that the addition of two textons and the use of GLCM features are able to increase image retrieval recall and precision compared to original MTH.
Table 3. Average Comparison MTH vs MTCD Using Batik 300, Corel 5k and Corel 10k
Retrieval Data Performance Method
GLCM MTH 6 Texton MTH +
GLCM
Proposed MTCD
Avg 4,6,8 Batik Precision 66,61 87,53 88,53 89,81 90,39
Recall 64,00 84,44 85,55 86,89 87,56
12 Corel 5k Precision 38,08 49,99 50,41 53,34 53,39
Recall 1,08 6,00 6,05 6,40 6,41
12 Corel 10k Precision 31,95 40,91 41,58 43,69 43,97
Recall 0,63 4,91 4,99 5,24 5,28
REFRENCES:
[1] Rui, Yong, Thomas S. Huang, and Shih-Fu Chang, "Image retrieval: Current techniques, promising directions, and open issues",
Journal of visual communication and image
representation, Vol 10, No. 1, 1999, pp.
39-62.
[2] Liu, Guang-Hai, Zuo-Yong Li, Lei Zhang, and Yong Xu, "Image retrieval based on
micro-structure descriptor", Pattern
Recognition, Vol. 44, No. 9, 2011, pp.
2123-2133.
[3] Huang, Jing, Shanmugasundaram Ravi
Kumar, Mandar Mitra, and Wei-Jing Zhu, "Image indexing using color correlograms",
U.S. Patent, No. 6, 2001, 246, 790.
[4] Julesz, Bela, "Textons, the elements of texture
perception, and their interactions", Nature,
Vol. 290, No. 5802, 1981, pp. 91-97.
[5] Haralick, Robert M., "Statistical and structural
approaches to texture", Proceedings of the
IEEE, Vol. 67, No. 5, 1979, pp. 786-804.
[6] Jain, Anil K., and Aditya Vailaya, "Image
retrieval using color and shape", Pattern
recognition, Vol. 29, No. 8, 1996, pp.
1233-1244.
[7] Liu, Guang-Hai, and Jing-Yu Yang, "Image retrieval based on the texton co-occurrence matrix", Pattern Recognition, Vol. 41, No. 12, 2008, pp. 3521-3527.
[8] Liu, Guang-Hai, Lei Zhang, Ying-Kun Hou, Zuo-Yong Li, and Jing-Yu Yang, "Image retrieval based on multi-texton histogram",
Pattern Recognition, Vol. 43, No. 7, 2010,
pp. 2380-2389.
[9] Liu, Guang-Hai, and Jing-Yu Yang, "Content-based image retrieval using color difference
histogram." Pattern Recognition, Vol. 46, No.
1, 2013, 188-198.
[10] Minarno Agus-Eko, Munarko Yuda,
Bimantoro Fitri, Kurniawardhani Arrie,
Suciati Nanik, "Batik Image Retrieval Based on Enhanced Micro Structure Descriptor",
Asia-Pasific Conference on Computer Aided
System Engineering, IEEE-APCASE, Bali:
IEEE, 2014, pp. 91-96.
[11] Minarno Agus-Eko, and Suciati Nanik. Image
Retrieval Based on Color Difference
Histogram and Gray Level Co-occurrence
Descriptor. Telkomnika Telecommunication,
Computing, Electronics and Control. 2014;
12(3).
[12] Fanani A, Yuniarti A, and Suciati N. Geometric Feature Extraction of Batik Image Using Cardinal Spline Curve Representation.
Telkomnika Telecommunication, Computing,
Electronics and Control. 2014; 12(2).
[13] S.D Zenzo, “A note on the gradient of multi
image”, Computer Vision, Graphic, and
Image Processing, Vol. 33, No.1, 1986, pp.