The design and application of polymeric materials in a
novel light modulated accelerometer.
GRASSHAM, Paul J.
Available from Sheffield Hallam University Research Archive (SHURA) at:
http://shura.shu.ac.uk/19712/
This document is the author deposited version. You are advised to consult the publisher's version if you wish to cite from it.
Published version
GRASSHAM, Paul J. (1992). The design and application of polymeric materials in a novel light modulated accelerometer. Doctoral, Sheffield Hallam University (United Kingdom)..
Copyright and re-use policy
Sheffield City Polytechnic Library
ProQuest Number: 10697013
All rights reserved
INFORMATION TO ALL USERS
The quality of this reproduction is dependent upon the quality of the copy submitted.
In the unlikely event that the author did not send a com plete manuscript and there are missing pages, these will be noted. Also, if material had to be removed,
a note will indicate the deletion.
uest
ProQuest 10697013
Published by ProQuest LLC(2017). Copyright of the Dissertation is held by the Author.
All rights reserved.
This work is protected against unauthorized copying under Title 17, United States C ode Microform Edition © ProQuest LLC.
ProQuest LLC.
789 East Eisenhower Parkway P.O. Box 1346
THE DESIGN AND APPLICATION OF POLYMERIC MATERIALS
IN A NOVEL LIGHT MODULATED ACCELEROMETER
by
Paul J. Grassham B.Sc.(Hons)
A thesis submitted in partial fulfilment of the requirements
of the Council for National Academic Awards for the degree of
Doctor of Philosophy
Sponsoring Establishment: School of Engineering Sheffield City Polytechnic Pond Street
Sheffield SI 1WB
Preface
All work reported in this thesis was carried out at Sheffield City Polytechnic during the
period October 1988 to March 1992.
The candidate has not, during the period of registration for the CNAA degree of Ph.D,
been a registered candidate for any other CNAA award or for any University degree.
The results presented in the thesis are, to the best of my knowledge, original except
where reference and acknowledgement has been made to other authors. No part of this
thesis has been submitted for a degree at any other University or College.
The following courses were attended during the
work:-(1) "Numerical Methods and Programming", Part of Module 2 of the M.Sc in
Metallurgical Process Management, October 1988 - February 1989, Sheffield
City Polytechnic.
(2) "Analytical Scanning Electron Microscopy for Scientists and Engineers", Short
Course held at Sheffield City Polytechnic, April - June 1990.
"The finding and manipulation o f fringes in a Michelson interferometer is often regarded as one o f the classically difficult and frustrating excercises in optics
Acknowledgements
The author would like to take this opportunity to express his appreciation to a number
of people for their contribution over the duration of this research programme.
Firstly to the Science and Engineering Research Council for their financial support
which enabled the completion of this research.
I express my gratitude to Dr David Clegg for taking over the responsibility of Director
of Studies in January 1990 and also for his help and guidance during the period since
especially during the writing of this thesis.
Thanks are also due to the technical staff in the School of Engineering, especially Mr
Roy Gunson, Mr Peter Haythome, Mr Paul Slingsby, Mr Roger Tindle and to Mr
Richard Wilkinson.
A special voice of thanks is paid to Mrs Michelle Smith for numerous helpful
discussions and for allowing me to take over part of her laboratory. Also many thanks
to Dr Steve Bradbury for proof reading this thesis and for his useful comments.
Much gratitude is also due to BASF Plastics, Bayer UK Ltd, Ciba-Geigy Plastics, ICI
Chemicals & Polymers Ltd and Wardle Storeys Ltd for supplying the test materials and
associated information used in this research.
Finally, I would like to pay tribute to Sally for her undying patience, support and sheer
endurance during many trying times. Also to my friends for their constant
The Design and Application of Polymeric Materials
in a Novel Light Modulated Accelerometer
Paul J Grassham
Abstract
A novel accelerometer based on light modulation has been designed and a prototype device manufactured. The device utilises the change in refractive index brought about by stress induced by the applied vibration. A detailed mathematical analysis of several feasible sensing designs has been performed to aid the design process.
A mathematical model has been developed to assess the performance characteristics of the light modulated accelerometer the results of which were also used as a design tool.
The prototype accelerometer was tested, from 1 g to 50 g between frequencies of 25 Hz to 2000 Hz, on a vibration system under three modulation schemes. The acceleration response of the device was seen to be linear over the testing range whilst the frequency response dropped off initially and levelled off at approximately 1 kHz.
An experimental accelerometer was also assembled on the vibration table so that various materials could easily be tested without having to undergo precise machining. The acceleration and frequency responses showed similar behaviour to those obtained with the prototype accelerometer. However, the actual response levels varied with each material.
To aid in the development of the accelerometer the stress-optic and thermo-optic coefficients have been determined for a range of polymeric materials.
The stress optic coefficient was determined for polycarbonate, polymethyl methacrylate, polvinyl chloride and araldite epoxy resin using a circular polariscope and two interferometer configurations up to the yield stress of the materials tested. Each material showed a constant coefficient over the testing range. The results obtained using each technique were in good agreement with each other and the limited literature data available.
The thermal variation of refractive index was also determined for the same materials. The Abbe refractometer was used for the determination between 5 and 140°C using five wavelength sources and two interferometer configurations using a HeNe laser from -50°C to approximately 30° above the glass transition temperatures.
The change in index was found to be linear over the temperature range tested. However, at the glass transition temperature a change in gradient was observed with each material.
Contents
1 Introduction
1
2 Electromagnetic Theory and The Optical Fibre
4
2.1 Maxwell’s Equations 4
2.2 Modes in Optical Fibres 5
2.3 Mode Coupling 7
2.4 Mode Cut-Off 8
2.5 Optical Waveguide Profiles 9
2.5.1 Step Index Profile 10
(a) Multimode Fibre 10
(b) Single Mode Fibre 11
2.5.2 Graded Index Profile 11
3 Fibre Optic Sensors
13
3.1 Historical Development 13
3.2 Introduction to Fibre Optic Sensors 15
3.3 Intensity Modulated Sensors 16
3.3.1 Microbending 16
3.3.2 Reflective 20
3.3.3 Moire Fringe 24
3.3.4 Optical Wedge 28
3.3.5 Moving Ball Lens 29
3.3.6 Frustrated Total Internal Reflection 29
3.3.7 Level 30
3.3.8 Switching 31
3.4 Phase Modulated Sensors 32
3.4.1 Mach Zehnder 32
3.4.2 Michelson 34
3.4.3 Sagnac 34
3.4.4 Fabry Perot 35
3.5 Polarisation Modulated Sensors 37
3.6 Wavelength Modulated Sensors 42
3.7 Spectral Distribution Modulated Sensors 45
4 The Optical Properties of Materials
46
4.1 Refractive Index 46
4.2 Snell’s Law 46
4.3 Fresnel’s Equations 47
4.4 Dispersion and the Lorentz Theory 47
4.5 Molecular Polarisability 50
5 The Design of a Vibration Measuring System
64
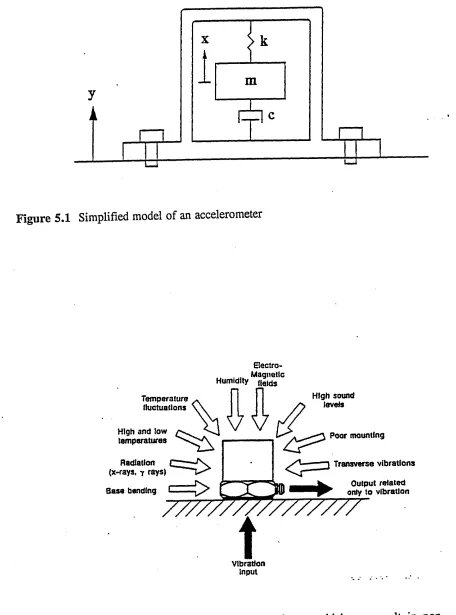
5.1 Vibration Measuring Instruments 64
5.1.1 The Piezoelectric Accelerometer 64
5.1.2 Mathematical Analysis of Accelerometer Operation 65
5.1.3 Accelerometer Design 6 8
5.1.4 Vibration Preamplifiers 69
5.1.5 Accelerometer Performance 69
(a) Environmental Effects 69
(b) Mounting Techniques 71
5.1.6 Accelerometer Characteristics 72
5.2 The Design of the Transducer System 74
5.2.1 Choice of Light Source 74
5.2.1.1 The Incandescant Source 74
5.2.1.2 The Light Emitting Diode 75
5.2.1.3 The Laser 75
(a) The HeNe Laser 76
(b) The Injection Laser Diode 76
5.2.1.4 Conclusions 77
5.2.2 Light Coupling Possibilities 78
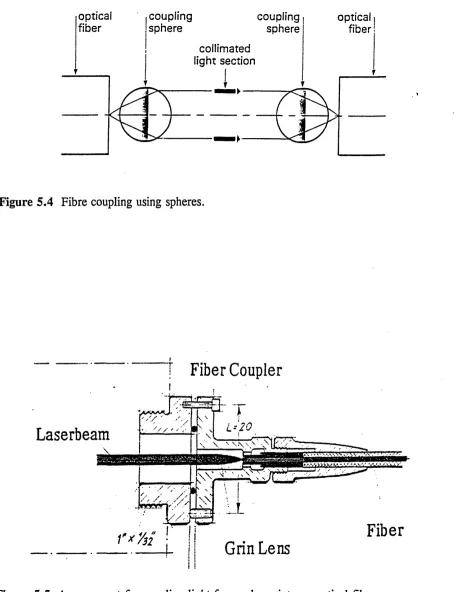
5.2.2.1 The Gradient Index Lens 78
5.2.2.2 The Coupling Sphere 79
5.2.2.3 The Laser to Fibre Coupler 80
5.2.2.4 The Fibre Collimator 81
5.2.2.5 Conclusions 81
5.2.3 Light Modulated Accelerometer Design 82 5.2.3.1 Spring Mass Element Design 82
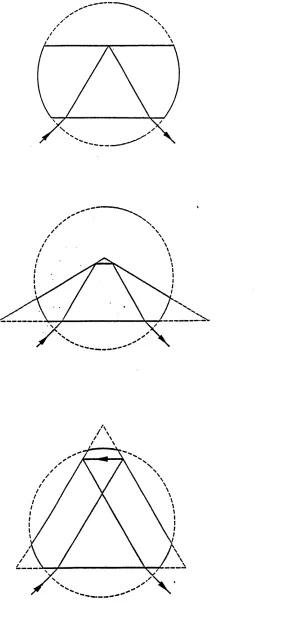
5.2.3.2 Sensing Element Design 82
(a) Simple Reflection 83
(b) n Type Reflection 85
(c) x Type Reflection 87
(d) In Line Reflection 89
(e) Conclusions 91
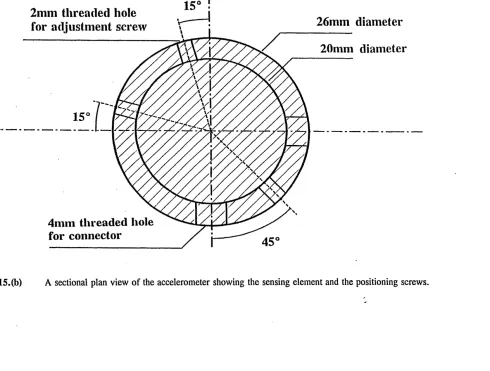
5.2.3.3 Accelerometer Design 91
(a) Sensing Element 92
(b) Light Input/Output Connection 93 5.2.3.4 Prediction of Accelerometer Performance 95
5.2.4 Choice of Light Detector 99
5.2.4.1 Photoemissive detectors 99
5.2.4.2 Thermal detectors 100
5.2.4.3 Semiconductor detectors 101
(a) PIN Photodiodes 102
(b) Avalanche Photodiodes 103
5.2.4.4 Conclusions 104
6 Experimental Procedure
106
6.1 Determination of Material Properties 106
6.1.1 Sample Preparation 107
6.1.1.1 General Samples 107
6.1.1.2 Optical Coating 107
(a) Sputter Coater 107
(b) Edward’s Vacuum Coating Unit 108
6.1.1.3 Differential Scanning Calorimetry 110
6.1.2 Determination of Stress Properties 111
6.1.2.1 Description of Stressing Apparatus 111
(a) Principal Stress Determination 111
6.1.2.2 Determination of Stress Expansion 113 6.1.2.3 Determination of Stress-Optic Coefficient 115
(a) Circular Polariscope 115
(b) Fizeau Interferometry 117
(c) Michelson Interferometry 119
6.1.2.4 Determination of Compressive Yield Stress 120
6.1.3 Determination of Thermal Properties 122
6.1.3.1 Description of Thermal Equipment 122
(a) Low Temperature Apparatus 123 (b) High Temperature Apparatus 123
6.1.3.2 Determination of Thermal Expansion 124 6.1.3.3 Determination of Thermo-Optic Coefficient 124
(a) Abbe Refractometer 124
(b) Fizeau Interferometry 125
(c) Michelson Interferometry 125
6.1.3.4 Prediction of Thermo-Optic Coefficient 126 6.1.3.5 Differential Scanning Calorimetry 129
6.2 Characteristics of Accelerometer 131
6.2.1 Measurement of System Losses 131 6.2.2 Description of Vibration Test Equipment 131 6.2.3 Vibration Testing of Polymeric Samples 133 (a) Intensity Modulated Mode 133
(b) Phase Modulated Mode 133
(c) Polarisation Modulated Mode 134 6.2.4 Vibration Testing of Prototype Accelerometer 135
6.3 Data Acquisition and Analysis 135
6.3.1 Hardware Details 135
6.3.2 Software Details 136
(a) Low Acquisition Rate 136
7 Results
137
7.1 Stress Results 137
7.1.1 Principal Stresses 137
7.1.2 Stress Expansion 137
7.1.3 Stress Optic Coefficient 138
(a) Circular Polariscope 138
(b) Fizeau Interferometer 139
(c) Michelson Interferometer 139
7.1.4 Compressive Strength 140
7.2 Thermal Results 141
7.2.1 Thermal Expansion 141
7.2.2 Determination of refractive index at 632.8 nm and 20° 141
7.2.3 Thermo-Optic Coefficient 141
(a) Abbe Refractometer 141
(b) Fizeau Interferometer 142
(c) Michelson Interferometer 143
7.2.4 Prediction of Thermo-Optic Coefficient 143 7.2.5 Differential Scanning Calorimetry 143
7.3 Transducer Characteristics 145
7.3.1 Light Losses in Transducer System 145 7.3.2 Vibration Testing of Polymeric Materials 147
(a) Intensity Modulation 147
(b) Phase Modulation 147
(c) Polarisation Modulation 148
7.3.3 Performance of Prototype Accelerometer 148
(a) Intensity Modulation 148
(b) Phase Modulation 148
(c) Polarisation Modulation 149
8 Discussion
150
8.1 Experimental Errors 151
8.1.1 Interferometry 151
(a) Expansion Tests 152
(b) Optic Coefficient Tets 153
8.1.2 Circular Polariscope 154
8.1.3 Abbe Refractometry 154
8.1.4 Differential Scanning Calorimetry 155
8.2 Stress Results 157
8.2.1 Stress Expansion 157
8.2.2 Stress Optic Coefficient 157
(a) Circular Polariscope 157
(b) Fizeau Interferometry 158
(c) Michelson Interferometry 159
8.2.3 Stress Optic Behaviour of Polymers 160
8.2.4 Compressive Strength 162
8.3 Thermal Results 163
8.3.1 Thermal Expansion 163
8.3.2 Refractive Index at 20°C and 632.8nm 163
8.3.3 Thermo-Optic Coefficient 164
(a) Abbe Refractometer 164
(b) Fizeau Interferometry 165
(c) Michelson Interferometry 165
8.3.4 Prediction of Thermo-Optic Coefficient 166 8.3.5 Thermo-Optic Behaviour of Polymers 168 8.3.6 Differential Scanning Calorimetry 169
8.4 Accelerometer Design and Vibration Testing 170
8.4.1 Light Losses 170
8.4.2 Vibration Testing of Polymeric Materials 170 8.4.3 Performance Characteristics of Prototype Accelerometer 171
8.5 General Discussion 173
9
Conclusions
176
10
Further Work
179
11
References
183
Figures
191
Appendix A - M easurement Errors
1 Introduction
With the technological advances made over the past twenty five years, with regard to
both lasers and optical fibres, optical measurement techniques in industry have become
more common place. The laser provides coherent light in extremely narrow and highly
collimated beams whilst the optical fibre provides a versatile light guide and also a
means of light modulation.
The laser is now seen in domestic equipment such as audio and visual disc players. The
optical fibre is common in remote visual inspection, telecommunication truck systems
and local area networks. Both the laser and the optical fibre are closely related to
electronics technology and are members of a range of opto-electronic components being
developed and improved [1].
Early workers in the development of optical fibre cables realised the sensitivity to
external influences and sought ways to minimise such effects. It was soon realised that
this sensitivity could be used as the basis of various sensing devices.
Over the past fifteen years there has been a plethora of optical sensing devices designed
and reported in the literature. These devices have been classified in the way in which
the optical fibre is utilised: extrinsic sensors where the optical cable merely acts as a
light guiding medium and intrinsic devices where the fibre itself is the sensitive element
[2]. Optical methods have been useful and offer much promise of further development
because light can be generated in a number of ways and can be conveniently modified
by other physical phenomena [1-5].
Many of the engineering applications of such sensors are likely to rely on the inherent
freedom from electromagnetic interference, safety in hazardous environments, high
electrical isolation enabling their use for high voltage applications, for data collection
from points at electrical potential and may be used for distributed sensors of extreme
length due to low losses achievable in optical fibres [6]. However, it is unlikely that
sophisticated and expensive fibre optic systems that can be made to operate in the
laboratory will stand up to the harsh environment of the process industries [7].
Therefore, relatively simple optical sensors with fibre optic links are required [8].
Vibration analysis is used to monitor the behaviour of a wide range of machines,
systems and installations in a wide variety of environments. Conventional devices, be
they mechanical, electro-mechanical or piezoelectric, cannot function where there is
high electrical voltage, where there is high electromagnetic interference, in the presence
of flammable or explosive fluids/gases and in marine environments.
To date, the optical vibration sensing devices designed and tested have employed
mechanical systems which have displayed poor performance characteristics compared
to those more conventional devices listed above. Hence, the aim of this programme of
research was to design and manufacture a solid state light modulated accelerometer
utilising the change in refractive index in polymeric materials brought about by the
applied vibration.
However, very little literature data exists on the variation of refractive index induced
by various environmental conditions and that information available has been somewhat
contradictory. Michel et al [9] has shown that for three polymeric glasses the refractive
index exhibits a linear relationship with temperature between the various transition
points which occur in these materials. Work carried out by Waxier et al [10], however,
with stress for these materials. As a consequence, a fundamental part of the research
programme has been involved with the determination of these parameters.
Another important aspect has been to study the factors affecting the stress and thermo-
optic coefficients in order to develop a greater understanding of their relation to
material structure. This knowledge could then enable the prediction of the coefficients
which would be of use in this research work, and generally, as a material selection tool,
cutting down on time consuming investigatory methods.
A prototype accelerometer has been designed and manufactured using a polymeric
sensing element. Some considerable time has been spent in the design of the sensing
element. A mathematical model has been developed in order to predict the performance
of the device and has also been used as a optimisation tool in the design of the
2 Electromagnetic Theory and the Optical Fibre
2.1 Maxwell’s Equations
The programme of work undertaken set out to discover the relation between the optical
behaviour of dielectric materials and their composition and structure.
Therefore, it is of fundamental importance to understand the laws which govern the
propagation of light in dielectric media.
These laws are a culmination of the work carried out in the early part of the 19th
century by Oersted, Ampere and others. The field concept, introduced by Faraday, was
not generally used until Maxwell showed that all electric and magnetic phenomenon
could be described by only four equations involving electric and magnetic fields.
These equations, referred to as the theory of electromagnetism, are known as Maxwell’s
equations and have been reported in detail in many texts [11-15]. It is customary to
write them in differential vector notation, thus
V-D - p VxE -dt
2.1
V-B - 0 Vxtf - J+— dt
The dynamic response of the atoms and molecules in the propagation medium is taken
into account through what are called the constitutive relations. Assuming the relations
D - eE 2.2
where e is the dielectric constant
J - oE 2.3
where a is the conductivity, and
B - v-H 2.4
where (jl is the permeability
The constants e, a and contain the description of the material to which the equations
are applied.
From Maxwell’s equations, it can be shown that light is a transverse electromagnetic
wave which travels through space at the speed of light c. It can also be shown that the
oscillating electric and magnetic fields in an electromagnetic wave are perpendicular to
each other and the direction of propagation.
2.2 Modes in an Optical Fibre
For a detailed understanding of the propagation of light in an optical fibre, it is
necessary to solve Maxwell’s equations subject to the cylindrical boundary conditions
of the fibre. This has been carried out in detail by several workers [16-20].
The mathematics describing this situation are very complex and their analysis is beyond
practical implications.
By solving Maxwell’s equations for the given boundary conditions, the exact
characteristic equation or eigenfunction can be determined. The solutions or eigenvalues
represent the propagation modes of this structure.
As an example of the complexity, the characteristic equation for a step index fibre is
elflY2 J vW ) . H ^ 'ijy a )
1---+ j y a
---e2 k Jv(ko) H (1)(jya)
ay2f v(Ka) . H w '(jya)
k/v(k a) H<l)(jya) € 2
'2.5
where
k = radial wave number
lq, = free space propagation coefficient
7 = a + j/3, the longitudinal propagation coefficient
a = fibre radius
v = order of Bessel function J and Hankel function H
A solution is obtained when a $ value satisfying the equation is found corresponding
to a given set of e, ko, a and v. Each solution is referred to as a mode of the fibre
waveguide.
For a round fibre, several mode types propagate with each mode assuming a unique
distribution with radial and circumferential variations.
TE (transverse electric) modes exist where the electric field vector is normal to the
direction of propagation and similarly for the magnetic field vector, the TM (transverse
magnetic) modes. Using the ray approach to optical fibres the TE and TM modes
correspond to meridional rays.
electric and magnetic field components present. The modes are designated by v and /z,
where v is the order of the Bessel and Hankel functions and \x is the n* root of the
Bessel function J,(ka). These hybrid modes correspond to skew rays.
The theory is simplified by the assumption that the difference in index between the core
and cladding materials is very small. This results in considerable mathematical
simplification and very great simplification in the description of the mode fields, since
it leads to the linearly polarised (LPr/l) field notation developed by Gloge [21]. In this
case, v is the azimuthal mode number and is used to give half the number of light
points in each concentric light ring. The radial mode number jx is used to give the
number of concentric light rings of the mode. The first ten modes of an optical
waveguide are shown in figure 2.1 [22]. The fundamental mode is called LP0i and the
next higher mode, LPn. Using the ray approach, the order of a mode is dependent on
the angle the ray makes with the core-cladding interface. The higher the angle the ray
makes with the interface, the higher the mode number.
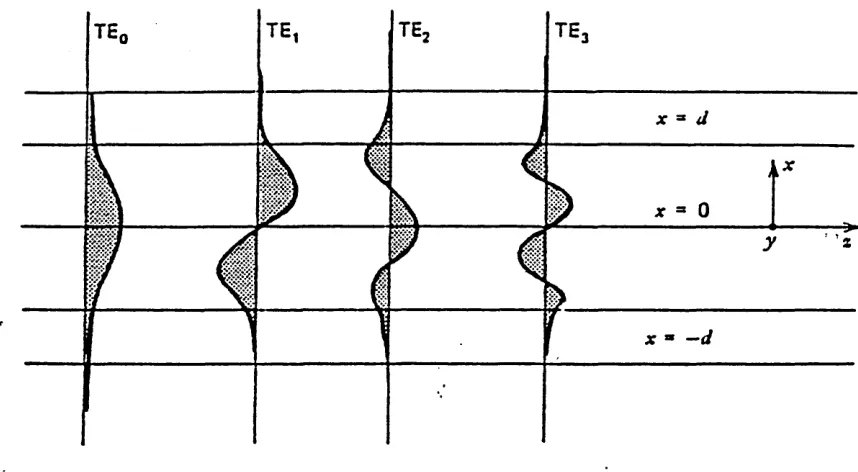
2.3 Mode Coupling
Figure 2.2 shows the field pattern of several low order modes in a planar dielectric slab
waveguide. The order of the mode is equal to the number of field maxima across the
guide and is also related to the angle made with the plane of the waveguide. The steeper
the angle, the higher the order of the mode.
It is evident from this figure that the electric field of the guided modes are not
completely confined to the core, but, instead, extend partially into the cladding. For low
order modes the fields are tightly concentrated near the centre of the slab with little
distributed more toward the edges and penetrate further into the cladding.
Further solutions of Maxwell’s equations for the same boundary conditions reveals the
existence of radiation modes that are not trapped in the core. The radiation field
basically results from the optical power that is outside the fibre acceptance angle being
refracted out of the core. This results in the appearance of cladding modes since some
of this radiation is trapped due to the finite radius of the cladding.
I As the light propagates along the fibre, mode coupling occurs between the cladding
modes and the higher order core modes. A diffusion of power back and forth between
j
j the modes occurs which generally leads to a loss in power from the core modes. In jpractice, the cladding modes will be suppressed by a lossy coating which covers the
fibre or they will scatter out of the fibre after travelling a certain distance because of
roughness on the cladding surface.
! A third type of mode that is present in an optical fibre is called a leaky mode. Leaky
modes are only partially confined to the core region and attenuate by continuously
radiating their power out of the core as they propagate along the fibre. This power j
radiation out of the waveguide is essentially based upon the upper and lower bounds 1
that the boundary conditions for the solutions of Maxwell’s equations impose on the
I
propagation constant 0 .
2.4 Mode Cut-Off
A mode is cut off when its field in the cladding ceases to be evanescent and is detached
from the guide, that is, the field in the cladding does not decay. The rate of decay of
the field in the cladding is determined by the value of the constant 7. For large values
values of 7, the field reaches out into the cladding, and for 7 = 0 the field detaches
itself from the guide.
An important parameter connected with the cut-off condition is the normalised
frequency V (also known as the V number) and is defined by
The cut-off parameters for all modes are obtained for a given order v and corresponding
root fx from Bessel functions. Figure 2.3 shows the allowed regions for various modes
plotted against the V number for a step index fibre.
It can be seen therefore that for V < 2.405 that only one mode can propagate, this
being the fundamental mode LP0i (HEn). Using equation 2.6 enables the conditions for
a single mode fibre to be determined.
2.5 Optical Waveguide Profiles
The term refractive index profile is used to describe the radial change of the refractive
index from the axis of the fibre in the core glass toward the cladding glass. The
propagation of the modes in an optical fibre depends on the shape of this refractive
index profile.
The two main types are the step index profile and the graded index profile. These are
shown schematically in figure 2.4. The number of modes N guided in the core glass is
dependent on the normalised frequency V and also the refractive index profile [23] by
the following equations.
For step index profile
2.7
and for a graded index profile
2.8
2.5.1 Step Index Profile
2.5.1.1 Multimode Fibre
Typical dimensions of a multimode step index fibre as shown in figure 2.4(a) are:
With the above parameters, the acceptance angle is approximately 14°.
In this type of waveguide, light is guided by many modes (thousands). Each mode
travels a different distance and therefore arrives at different times at the end of the
fibre. The distortion caused by the delay in time is called modal dispersion and causes
a pulse of light to broaden in time.
This is bad for optical transmission as it reduces the transmission speed and
transmission bandwidth. Core diameter 2a Cladding diameter D Core refractive index nj Cladding refractive index n2
100 fim
140 fim 1.48 1.46
Light can only enter the fibre within a specific acceptance angle 6 which is given by
This modal dispersion can be eliminated by operating the fibre under single mode
conditions.
2.5.1.2 Single Mode Fibres
As already seen, in order to have just the one mode propagating, the normalised
frequency V must be less than 2.405 (figure 2.3). This limits the size of the core for
a given set of conditions. Typical dimensions for a single mode fibre are:
Mode field diameter 2w 10 ^m
Cladding diameter D 125 m
Core refractive index n2 1.46
Refractive index difference A 0.003 = 3%
Acceptance angle 6.5°
So the core diameter and the acceptance angle are much smaller than in the case of a
multimode fibre (figure 2.4(b)) which increases the difficulty in launching light into the
fibre.
2.5.2 Graded Index Profile
The undesirable feature of step index multimode fibres is the modal dispersion. This
can be greatly reduced by using a refractive index profile such that the refractive index
of the core diminishes parabolically from a maximum ^ at the fibre axis to n2 at the
cladding.
Typical dimensions of a graded index fibre:
Core diameter 2a 50 /xm
Cladding diameter D 125 m
Maximum core refractive index n2 1.46
Refractive index difference A 0.01
Due to the continuous change in refractive index, the rays are refracted continuously
and their direction of propagation is changed (figure 2.4(c)). The rays oscillating around
the fibre axis will still travel a longer path than the light ray along the axis, however,
due to the lower refractive index these rays will travel faster which evens out the time
3 Fibre Optic Sensors
3.1 Historical Development
The use of light in communication is not a new idea. In Agamemnon, the play by
Aescylus written in the 5th century BC, the author writes that the news of Troy’s
downfall was passed on by fire signals via a long chain of relay stations from Asia
Minor to Argos [24]. In 1790, Claude Chappe built an optical telegraph system which
comprised of a chain of towers with moveable signalling arms. Using this system,
information was transmitted 423 km from Paris to Strasbourg within six minutes [25].
Alexander Graham Bell developed the photophone in 1880 whereby voice signals could
be transmitted by means of light [26]. However, this idea did not find practical
application owing to the detrimental effect that the weather and visibility had on the
quality of transmission.
Some ten years before Bell’s invention, John Tyndall suggested a solution to the
problems of transmission when he demonstrated that light could be guided in a stream
of water [27]. The light was guided due to total internal reflection, the principle of
which is applicable to todays optical fibres.
Following the work by Bell and Tyndall, it took until 1934 for a patent to be issued for
an optical telephone system. The system designed by Joseph French described how
voice signals could be transmitted by an optical cable network [28]. The cables, which
were to be made of solid glass rods or some other material, were to have a low
attenuation coefficient at the operating wavelength.
and Townes developed the laser, the first being successfully operated by Maiman in
1960 [29]. In 1962 it was recognized that laser could be manufactured from
semiconductor materials and at the same time semiconductor photodiodes were
developed which could be used as the receiver.
The final piece in the jigsaw, the optical cable came some time later.
Kao and Hockham [30] suggested in 1966 that glass fibres be used for light guidance.
However, these fibres would have to show attenuation values of not more than 20
dB/km to be able to construct useful transmission systems and in 1965 optical
waveguides still exhibited attenuations of the order 1000 dB/km.
The major breakthrough came in 1970 when step index fibres having attenuation values
less than 20 dB/km at 633 nm were manufactured by Kapron et al [31] at Coming Glass
Works. By 1972, optical fibres with graded index profiles achieved 4 dB/km.
Today, attenuation values of 0.2 dB/km at 1550nm are achieved in single mode fibres
and the performance of the transmitters and receivers has also improved appreciably.
With the advent of low loss optical fibres, early workers became aware of the high
sensitivity of fibres to external perturbations and sought ways to minimise these effects.
An alternative approach was suggested by some workers who proposed exploiting the
3.2 Introduction to Fibre Optic Sensors
Over recent years there has been a great of interest in the design and development of
fibre optic sensors for scientific and industrial applications which has been due to the
advances made in fibre optics technology for telecommunications and data transmission
since the late 1960’s. As a result a vast amount of work has taken place on the
development of fibre optic cables, connectors, fusion splicers, sources, detectors and
test equipment which has greatly increased availability and has brought about a
considerable reduction in costs. The advantages of optical sensors over more
conventional electricity based sensors are:
1 Freedom from electromagnetic interference (EMI)
2 Safety in hazardous (explosive vapour) environments
3 High electric isolation
4 Passive operation ie. no power required at remote sensing point
5 May be used for distributed sensors over long distances because of low
losses achievable in optical transmission fibres
6 Can be made compatible with optically based data transmission systems
Optical sensors may be divided into two distinct classes. Firstly, those in which the
optical fibre is itself the sensing medium (continuous or intrinsic sensors) and secondly,
those which are optical in nature but make use of the optical fibre as a light guiding
medium to and from the sensor (point or extrinsic sensors). Optical sensors may also
be classified in the way the physical variable to be measured modulates the light. Light
may be modulated by intensity, phase, polarisation, wavelength and spectral
distribution. Sensors based on each of the modulation techniques mentioned are
3.3 Intensity Modulated sensors
Designs based on intensity modulated sensors account for approximately half of all
device designs published owing to the simplicity and potentially low cost of the
technique. However optical sources are all prone to intensity drift with ageing and so
a reference channel is needed.
The various designs published are reported in detail in this section.
3.3.1 Microbending Sensors
The microbend sensor capitalises on a phenomenon which is a source of loss in the
telecommunications industry. Slight perturbations at the core cladding interface of the
optical fibre known as microbends cause the light in the core to be coupled into the
cladding and hence lost through radiation. Microbending loss is a significant design
consideration in system applications of low loss optical fibres or loss modulation
transducers.
Gambling et al [32] conducted a theoretical study of the transition and pure bend loss
which can arise in a single mode fibre containing random bends. As a result, a
modified mode coupling theory was produced which could be applied to general
problems connected with curved fibres and has been used to predict transition losses.
Using this modified mode coupling theory, Gambling calculated that the loss induced
at a transition between straight and curved sections of fibre and it was found that the
radiated power was oscillatory at the beginning of the bend, which implies the existence
of an exchange of power between the HEn mode and the radiation modes. This relates
In an attempt to improve the stability and reproducibility of microbend devices,
Lipscombe et al [35] performed a study of the effect of a single microbend on a single
mode fibre. The experimental study showed the occurrence of oscillations in the output
of a single mode fibre undergoing microbending as Gambling had proved theoretically.
In studying the effects of microbending on optical transmission for communication,
Gloge [36] and Marcuse [37] have shown that random bends in the axis of the fibre
need not be of large amplitude to cause significant losses in fibre transmission.
Gardner [38] obtained qualitative data on microbending loss by winding fibres under
controlled tension onto a drum whose surface was not perfectly smooth. The tension
forced the fibre to partially conform to the surface roughness resulting in random
bending of the fibre axis which caused a measurable increase in the optical loss.
From his experiments, Gardner showed that by coating the fibre in a compliant
medium, DuPont’s Elvax 265, led to a reduction in the magnitude of the microbending
loss. It was also demonstrated that the value of the numerical aperture had a
considerable effect on the microbend loss.
Many workers have built and tested prototype sensors based on microbending.
In order to determine the potential sensitivity of a loss modulation transducer, Fields
et al [39] investigated the simple bending loss transducer shown in figure 3.1. The
transducer consisted of two mating ridge plates placed around a multimode step index
silica fibre one of which was illuminated by a He-Ne laser, 632 nm wavelength. The
upper plate was subjected to a load which produced a quasi sinusoidal distortion of the
fibre. Figure 3.2 shows the transmission of the transducer as a function of the applied
mode coupling theory ie. bound modes of high mode number (high launch angle) are
more easily converted into radiation modes.
Fields et al calculated the minimum detectable pressure variation to be 1.3X10⁴ Pa
which is equal to that calculated by Bucaro et al [40] for an ideal fibre interferometric
sensor.
Fields et al [41-42] took this further and developed a fibre optic hydrophone. The
device is illustrated in figure 3.3. A multimode step index fibre passes between a pair
of mating ridge plates containing ten periods of wavelength A = 2 mm. The
experimental arrangement is shown in figure 3.4. The minimum detectable pressure for
this device was 95 dB (re 1 ^Pa) and occurs at approximately 1.1 kHz. This low figure
is due to the resonance of the structure reflecting its unsophisticated acoustic design.
Lagakos et al [43-44] built and tested a prototype fibre optic displacement sensor. The
sensor configuration is shown in figure 3.5 with the experimental set up in figure 3.6.
The cladding modes were stripped immediately prior to the sensing section.
Microbending, induced by displacement, introduced mode coupling causing a significant
increase in the light power in the cladding modes. The dark background made the
cladding modes more sensitive to detection than the core modes.
Davis et al [45] showed that this dark field microbend modulated sensor (DFMM)
arrangement could be employed in a fibre optic sensor array configuration employing
time division multiplexing. The sensor array consisted of 25 channels extending over
a distance of approximately 550 metres. The separation between channels was 22 metres
corresponding to a 220 nanosecond difference in optical time of flight. A 200
sequence of pulses was coupled into the sensor bus by the DFMM sensor cladding tap.
This sequence of pulses, modulated by the signal, propagated to the photodetector.
An array such as this could be used to obtain data from a number of sensors deployed
over a large area.
Harmer [46] described the construction and performance of a strain gauge based on
microbending loss in an optical fibre and showed that sensitivity could be achieved with
a reasonable environmental performance.
Another paper by Harmer [47] described a novel form of fibre optic refractometer
where the critical angle of light at the probe liquid interface could be varied and
controlled by introducing alternating bends in a multimode fibre. The refractometer was
adapted for measurement of battery charge state in lead acid batteries. The probe tip
consisted of a polystyrene fibre with three microbends. Ends of the fibre were epoxied
into a red light emitting diode and photodetector. Temperature compensation was made
3.3.2 Reflective Sensors
In 1967 Kissinger [48] took out a U.S. patent on a fibre optic proximity probe using
the guiding properties of optical fibres to give intensity modulation relating to the
distance between the tip of a fibre probe and a reflecting target (figure 3.7).
Menadier et al [49], Lagace et al [50] and Frank [51] have all published designs based
on this principle.
By using adjacent pairs of optical fibres, one transmitting and one receiving an optical
signal, the distance to a reflecting surface can be measured by detecting the amount of
light reflected. When the sending and receiving elements are in contact with the surface,
no light is reflected to the receiving element. As the distance between the two
increases, the cone of light from the transmitting element illuminates an increasingly
larger area on the work surface. In effect, this area becomes the source of a secondary
cone of light which in turn increasingly illuminates the receiving element. The
relationship between surface displacement and receiver illumination remains essentially
linear until the entire surface of the receiving element is illuminated by the reflected
light at which point the curve reaches its peak. This is illustrated in figure 3.8. As the
distance increases beyond this point, the illumination of the receiver decreases in
approximately inverse proportion to the square of the distance.
Through the use of a large number of fibres, the fotonic sensor achieved the first
claimed practical application of this principle.
Many designs based on this principle have been reported for use in fibre optic medical
Matsumoto et al [59] constructed the catheter tip transducer shown in figure 3.9. The
bundle of fibres in the catheter are divided into two parts. One part is used for pressure
measurement and the other for measurement of oxygen saturation. The pressure
measuring optical fibres consist of two sections; one for transmitting light and the other
for receiving light signals.
A metal tip containing the side hole was incorporated at the end of the catheter. The
side hole was covered with a pressure sensitive watertight membrane, beneath which
is a cantilever plate which moves with the pressure sensitive membrane. The end of the
cantilever has a reflector which is parallel to the cross section of the fibre bundle. Any
pressure on the membrane will press down the cantilever plate whereupon the reflector
will change its position and angle with respect to the cross section of the fibre bundle.
This change in position alters the amount of light which is reflected back through the
outlet fibre and which is detected by the photoelectric transducer element. The output
voltage of the element is thus proportional to the applied pressure.
The ratio of the area of inlet to outlet was chosen as one to ten in order to optimise the
ratio of the signal component to the stationary component of reflected light from the
outlet fibre and hence avoid saturating the photosensitive transducer.
Figure 3.10 shows relationship between the reflected intensity and the reflector
deflection for different distances in an experimental model.
The primary disadvantage of these types of optical pressure sensors lies in their inherent
environmental sensitivity. Because these devices measure absolute intensity, the output
signal will be affected by intensity loss resulting from source intensity fluctuations and
distance to the diaphragm will be strongly affected by changes in this distance resulting
from environmental effects such as vibration and thermal expansion.
In order to minimise these environmental sensitivity problems, Lawson and Tekippe
[60] designed a pressure transducer that relied on diaphragm curvature rather than
diaphragm displacement. The diaphragm deflection is derived from the ratio of light
received by the collection fibres to that from the inside collection fibres. Because of this
’ratioing’ procedure, this sensing technique automatically compensates for variation in
the source intensity, for losses in the input fibres and for variations in the reflectivity
of the diaphragm surface.
Furthermore, since the pressure determination depends on the diaphragm curvature
instead of the distance between the fibres and the diaphragm, this technique is not
affected by temperature or vibration effects that cause a displacement of the fibre
bundle relative to the diaphragm. The system was also made to operate in a linear
fashion. When the pressure differential across the diaphragm is zero the diaphragm will
be flat and an equal amount of light will be reflected to the inside and outside fibres.
With positive pressure the diaphragm will be concave and more light will be reflected
to the outside collection fibres. With negative pressure the converse will be the case.
A miniaturised prototype reflectance sensor suitable for in-vivo medical applications
was constructed and tested. The output signal, L n ^ / I J was recorded as a function of
gauge pressure and was observed to be linear. The dynamic range was calculated to be
115 dB.
Although the size and pressure range of this prototype was engineered for in-vivo
military and commercial areas in which small size and environmental insensitivity are
desired.
The reflection from a moving cantilever beam is the basis of a device developed
commercially by ASEA Ltd [61] and now manufactured by Takaoka [62]. The sensing
principle is shown in figure 3.11. The sensor is located at the end of a single strand
optical fibre and is excited by light from a near infra-red LED which is transmitted
from the instrument. Two optical signals of differing wavelengths return through the
same fibre; one is a measurement signal, the other a reference. The measurement signal
is generated by the effect that light collimated in a graded index lens is reflected in a
cantilever beam which is deflected by acceleration. The light is then focused back
towards the fibre, but due to the angular deflection of the collimated light beam, the
focal point has been moved and the intensity of the light that returns in the fibre is
modulated by acceleration. The reference signal makes it possible to compensate for
losses in fibres and connectors and is generated from a neodymium doped glass inside
the sensor by means of photoluminescence. This device, being mechanical in nature,
has a very narrow frequency response of the order of 10-1000 Hz compared to existing
3.3.3 Moire Fringe
High precision optical displacement sensors with sub micron resolution have been used
in hostile environments in the machine tool industry since the mid 1950’s [63].
If two optical gratings, consisting of alternate parallel strips of clear and opaque
materials of equal width, are overlaid, light will either be transmitted or obstructed
depending on whether or not the clear areas coincide. If the lines on one grating are
aligned at a small angle relative to those on the other then the loci of their intersections
will be visible as dark moire fringes running approximately at right angles to the grating
lines.
Translation of one grating over the other in a direction perpendicular to its rulings
causes these fringes to move in a direction perpendicular to this movement. If a
collimated light source is used to illuminate an area of the overlaid gratings and a
photoelectric device is positioned to detect the transmitted light then a periodic electrical
signal is produced as the gratings are translated, its periodicity corresponding with a
grating movement of one grating period.
The measurement accuracy of the system is fundamentally limited only by the precision
with which the gratings have been ruled.
The potential offered by moire fringes for use with optical fibres as a universal process
control displacement sensor was recognised by Jones and Spooncer [64] who initially
foresaw their use in incremental, fringe counting applications as a way of overcoming
the need for referencing which exists in analogue intensity modulated systems. However
long term semi-static measurements such as those encounted in process control
loss of datum caused by noise pick up or power supply interruptions. Recent work by
Jones and Spooncer [65-68] has been aimed at producing an absolute moird fringe
displacement sensor by using two gratings with their lines parallel, as an optical shutter.
Sayce [69] suggests that gratings with spatial frequencies of less than 25 lines/mm can
be considered as being purely mechanical in their action whereas finer gratings become
increasingly dominated by diffraction effects.
In an amplitude modulated system effects other than changes in the measurand such as
variations in emission from the light source or in fibre attenuation may alter the light
level.
Compensation may be provided (at a cost) if a reference light signal is installed but the
problem can be avoided if amplitude measurement is replaced by moire fringe
counting.
Murray [70] has described experimental pressure and temperature sensors using
gratings.
In work carried out by Jones et al [71] infra red (IR) light (820nm) from a light
emitting diode (LED) was coupled into a 300/zm diameter core step index fibre, with
a numerical aperture of 0.48 approximately lm long (maximum launch power 70mW),
led to the modulator and returned via a second similar link to a PIN photodiode
operated at zero bias to reduce noise.
The sensor, shown in figure 3.12, consisting of two parallel gratings about 5mm x
10mm is interposed between the sapphire spheres. One grating is fixed relative to the
and to provide a restoring force, is traversed across the fixed grating in a direction
perpendicular to the grating lines. The typical output/displacement characteristics of the
modulator, I(x), are shown in figure 3.13 for two different bar/space ratios.
Both the 1:1 and 7:3 gratings showed good linearity with a new serrisoidal profile but
the 7:3 grating showed higher sensitivity and better modulation depth and extinction
ratio. As the grating pitch reduces, the characteristic changes from the serrisoidal shape
to an almost sinusoidal profile at 25 lines/mm, with reduced linearity range and
modulation depth.
In other work carried out by Jones and Spooncer [64], gratings were used which have
a line spacing of 4/j.m. For each grating cycle the output rose to 14mV and fell to 7mV
and fringes could be counted visually. Identification of both the peaks and the troughs
of the cycle gave a resolution of 2/*m. Initial results were encouraging with fringe
counts of 100 in either direction corresponding precisely with a 0.4mm micrometer
movement.
The moire fringe modulator is a good prospect for development as an accurate
measuring instrument. It has adequate resolution and a digital output which does not
suffer from the problems of amplitude measurement. It has relatively low attenuation
and a linear output displacement characteristic. It can still however only give an
absolute output which limits its usefulness. An absolute form of output must be
developed before moire fringe modulation can be considered for use as an optical
transducer in a process plant.
In a paper by Spillman [72], a multimode fibre optic hydrophone is described which is
Light from one multimode fibre is collimated by a gradient index microlens and passed
through an opposed grating structure after which it is focussed down onto an output
fibre by a second microlens. The opposed grating structure is coupled to 2 flexible
diaphragms which are attached to the top and bottom of the hydrophone housing.
Deflection of the diaphragms by ac pressure changes causes relative motion of the two
gratings and thereby modulating the amount of light coupled between input and output
fibres.
The minimum detectable displacement for this device was calculated as 3.4E-03A and
3.3.4 Optical wedge amplitude modulator
An optical wedge is a variable optical attenuator which may be straight or circular. It
is normally graded so that the attenuation varies logarithmically with translational or
angular displacement. The principle is shown in figure 3.15. The wedge used in trials
by Jones and Spooncer [71] was of a translational form.
The configuration forms a simple optical displacement transducer in which the
logarithm of the output voltage is proportional to input displacement. It also has
advantages in that
1 the light beam geometry is unchanged by the displacement modulation so that
the system is independent of variations in light intensity across the beam
2 the diameter of the light beam is sufficiently large (3mm) to average minor
irregularities in the optical transmission of the wedge and to limit the effects of
vibration
Displacement output characteristics of the modulator were measured at various light
levels corresponding to optical powers launched into the system of between 12.5mW
and 140mW. Traverses over a distance of 10mm at each light level gave characteristics
which were almost logarithmically linear; maximum deviation from linearity was
0.1mm. The gradient of the characteristics equivalent to the sensitivity of the system
varied by approximately ±3%.
Additional wedges could be combined to give even greater sensitivity, but increased
sensitivity coupled with better repeatability can be obtained using parallel grating
Similar devices have been used in high sensitivity fibre optic hydrophones [72-73].
3.3.5 Moving Ball Lenses
This technique offers a high opto-mechanical sensitivity and the principle is illustrated
in figure 3.16. The light of the transmitting fibre, intensity Iq, is focused by a ball lens
onto the faces of two receiving fibres. A displacement of the ball lens, in the plane
containing the receiving fibres, changes the distribution of the light into those fibres and
it has been shown by Dotsch et al [74] that the log of the ratio y i 2 exhibits a linear
dependence on the displacement of the lens.
One advantage of sensors utilising this principle is that the ratio of light intensity in the
two receiving fibres is independent of the primary intensity and is therefore immune to
the usual drift problem associated with intensity modulated sensors.
Dotsch et al [74] demonstrated the possible use of the moving lens arrangement in
optical switches, differential pressure sensors and in particular temperature sensing
applications. A temperature sensor was produced the output (the ratio I j/y of which
showed a linear response over the 20 - 90° C temperature range.
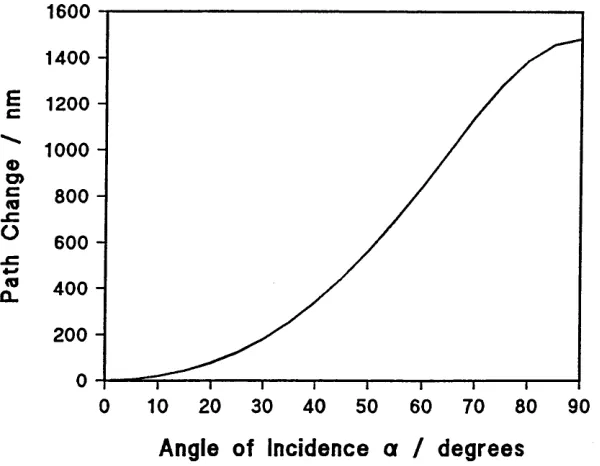
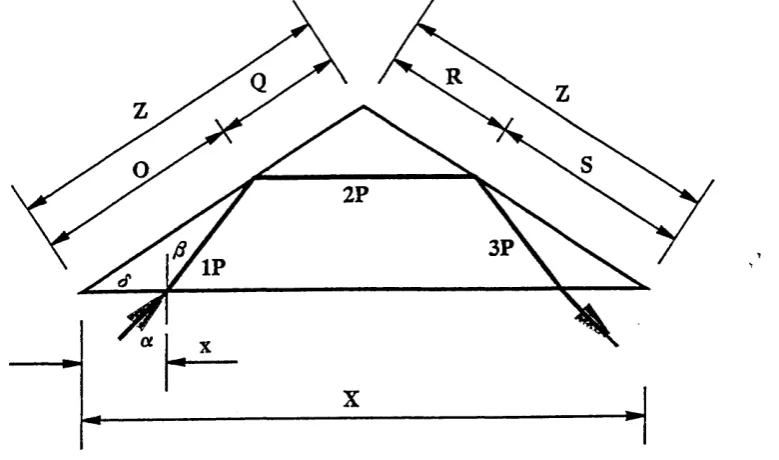
3.3.6 Frustrated Total Internal Reflection
The mechanism of frustrated internal reflection (FTIR) may be exploited to produce
modulation of light passing through an optical fibre as shown in figure 3.17 [75]. The
two fibre ends are polished at an angle to the fibre axis large enough to cause TIR for
all modes propagating in the fibre. By bringing the two fibre ends sufficiently near to
one another a large fraction of light power can be coupled between the two fibres.
Modulating the gap thickness x between the two fibres causes the amount of light power
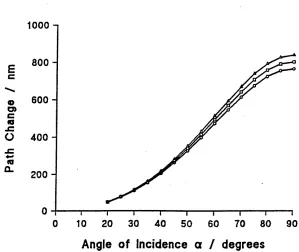
program to model the sensitivity of the structure shown in figure 3.17 as a function of
vertical displacement.
Figure 3.18 shows the results of this model. It can be seen that changing the fibre gap
by a small fraction of a wavelength of light produces a large change in relative
intensity of the transmitted light from one fibre to the other. The optical sensitivity
increases as r approaches 90°.
An experimental sensor based on FTIR was constructed as shown in figure 3.19. Fibres
with an 85mm diameter, NA = 0.2 were used and were cut at 76°. Light from a
He-Ne laser was used.
Although the constructed device was less sensitive than theoretical predictions, its
performance is substantially better than any other multimode fibre optic hydrophone
reported to date.
3.3.7 Level Sensors
In 1954 Geake [77] described an optical dipstick - a probe using the critical internal
reflection of light to detect a liquid surface. The basic arrangement is shown in figure
3.20. If a transparent rod has as 90° conical or bevelled end, light travelling down the
rod will be totally internally reflected twice and will pass straight back up the rod -
provided that the tip of the rod is dry; if it is wet then the light leaves the rod at the tip
and does not return up the rod. Plastics such as perspex, polystyrene or polycarbonate
are usually satisfactory as gauge materials while in solvents, glass, pyrex or quartz
may be used.
type of gauge element which uses a single U shaped rod; the rod acts as a light pipe
when dry but light leaves it at the bend when it is wet. These arrangements do not
discriminate between liquids. However, Geake [80] describes a possible arrangement
which operates within a restricted range of refractive index and is able to detect the
interface between two specific liquids. This is required in processes where a tank i
contains two immiscible liquids and one wishes to know the level of the lower one.
3.3.8 Switching
A very high percentage of monitoring concerns switching at prescribed values of the
measurands. Thus for example, process plants and aircraft contain numerous
microswitches and valves and it is not surprising therefore that manufacturers now
produce switches of one form or another.
Control or alarm switches for the common physical variable utilise a basic mechanical
sensing mechanism which operates an electrical microswitch at a predetermined set
point.
The optical microswitch with fibre links can be employed in all applications where a
standard electrical microswitch is currently used and a typical arrangement using an
opaque shutter is shown in figure 3.21 [81]. In the off state there is a low light
3.4 Phase Modulated Sensors
3.4.1 Mach Zehnder Interferometer
Tveten et al [82] and Miles et al [83] have reported details of a simplified device
employed to demonstrate the principle of operation of a fibre optic accelerometer. The
accelerometer consisted of a mass suspended between two fibres or a mass suspended
from a single fibre as shown in figure 3.22. When the device is accelerated in the
indicated direction, a strain 5L/L is introduced in the supporting fibres proportional to
the acceleration a.
The measurement of the small change in optical path induced in the fibre was
accomplished using an all fibre Mach Zehnder interferometer. The accelerometer
exhibited detection sensitivity of less than 1 jxg with excellent linearity as a function of
acceleration. Any practical device based on this principle would require the inertial
mass to be constrained to eliminate lateral movement.
Davis et al [84] have also tested similar devices.
A fibre optic accelerometer which incorporates two right circular cylinders wrapped
with separate single mode optical fibres has been tested by Furlong et al [85]. The
cylinders are affixed on opposite ends in their housing structure. When one cylinder
experiences an acceleration induced radial reduction, the other undergoes a radial
expansion of the same amount. This configuration has two main advantages. Firstly, the
sensitivity is increased by a factor of two when the phase information is processed
differentially and secondly, effects of lateral acceleration are cancelled out. Furlong et
al report that this device displays excellent frequency response and linearity
Bucaro et al [86] have demonstrated the feasibility of employing acousto optic
interactions in an optical fibre to produce a sensitive acoustic detector. The
experimental configuration is shown in figure 3.23. The technique utilises the phase
modulation of an optical beam in a submerged optical fibre coil by sound waves
propagating in a fluid. Analysis of the results indicated that the sensitivity of the
technique compares well with that of the best available hydrophone.
Devices based on Mach Zehnder interferometer have also been used to measure
magnetic fields [87-88] and pressure [89].
The possibility of detecting weak magnetic fields by the magnetostrictive perturbation
of optical fibres was proposed by Yariv and Windsor [90]. The basic principle of
operation is associated with the measurement of the longitudinal strain induced in the
optical fibre by a magnetostrictive jacket.
The magnetostrictive materials used by Jones et al [87] were all amorphous metals.
They were either in the form of a jacket sputtered onto the cladding of the fibre for
approximately 50 mm of its length or metallic glass ribbons to which the bared fibre
was bonded. Results were obtained for various configurations of magnetostrictive
j
; jacket. t
f
Initial investigations by Dandridge et al [88] attempted to evaluate the sensitivity of
fibre optic magnetic sensors for fields in the range from 10-5 Oe to 10 Oe for time
varying signals ranging from 100 Hz to 10 kHz. Figure 3.24 illustrates the linearity of
3.4.2 Michelson Interferometer
An alternative interferometer configuration is the Michelson which is similar to the
Mach Zehnder. The advantage in this case is that only a single fibre direction coupler
is required and consequently the theoretical fringe visibility is unity. Another advantage
is in remote sensing where only a single fibre is needed between the source and sensor.
Parmigiani [91] has reported high sensitivity vibration measurements by Michelson
polarising interferometer with an optical fibre probe. The smallest detected velocity of
vibration was 30.1 fim/s over a frequency range of 1-400 Hz. The feasibility of the
technique had been reported earlier by Ueha et al [92].
A multimode fibre Michelson interferometer has been demonstrated by Imai et al [93]
where bulk optic components were used and sensing was carried out using an external
mirror. Kashap & Nayar [94] reported an all-fibre Michelson interferometer to measure
acoustic signals. This consisted of a single mode fibre directional coupler with mirrors
formed on the cleaved ends of both fibres on the same side of the coupler. The results
indicated a similar performance to that of a Mach Zehnder interferometer.
3.4.3 Sagnac Interferometer
An optical device capable of detecting the rotation of a securely coupled reference
system was first demonstrated by Sagnac in 1913 [95]. The device is a ring
interferometer in which light beams propagate in opposite directions over the same
closed path.
Bukhman et al [96] described a method of measuring rotation velocities in a fibre optic
ring interferometer which was able to measure velocities of rotation as low as 0.3
Goldstein and Goss [97] constructed and tested a single axis rotation sensor utilising a
200 metre single mode fibre in a 30 centimetre diameter coil. Figure 3.25 shows a
schematic diagram of the sensor system. The output of silicon detectors viewed two
complementary interference patterns electronically differenced to obtain a rotation
dependent signal. The response was linear over a rotation range of 104 to 10'1
rads/second.
Udd has described a series of fibre optic acoustic sensors based on the Sagnac effect.
Details were also given on how the sensitivity of the system could be optimised [98].
3.4.4 Fabry Perot Interferometer
Sensors which can be interrogated by the use of colour offer some progress towards a
true digital system. One approach to using colour is to consider the Fabry Perot white
light interferometer [99] as a general purpose displacement sensor for use in physical
measurement. When addressed by a broadband source, multiple reflections between the
two lightly silvered mirror surfaces results in a number of transmission fringes in the
output spectrum. The position of these fringes is a unique representation of the mirror
spacing. A changing physical parameter, for example temperature or pressure, can be
translated into mirror displacement and hence a shift in the transmission fringes.
Cox and Jones [100] investigated a temperature sensor, based on Fabry Perot
interferometry, as shown in figure 3.26. The main problems associated with this device
was the alignment of the mirrored surfaces which led to a loss is fringe sharpness.
Initial results were promising.