Developing Resource Efficient Heart Arrhythmia
Classifier
Atif Jan, Numan Khurshid and Muhammad Irfan Khattak
University of Engineering and Technology, Peshawar, Pakistan
ABSTRACT
This paper presents development of optimal digital circuit for the Heart Disease Classification using Cartesian Genetic Programming (CGP) for different types of arrhythmia. Extensive research work has already been carried out in this domain but non-linear nature of the technique remained one of the hurdles in its hardware prototyping. Efficient circuit development for resource constraint environment of the classifier remained an unsolved problem due to its algorithmic complexity. CGP system is trained to generate a classifier circuit based upon the fiducial points extracted out of the Electrocardiography (ECG) signals of dataset. Experimental results reported on heart disease data from machine learning repository of MIT-BIH showed satisfactory results as compare to other contemporary methods used in the field..
Keywords
Cartesian Genetic Programming, Neuro-evolution, CVD, Cardiac Arrhythmias, Classification, Fiducial points, LBBB beats,RBBB beats.
1.
INTRODUCTION
Cardiovascular diseases (CVD) generally comprises of diseases involving blood vessels (such as veins, capillaries and arteries) and heart or both of them. 60 to 100 beats per minute (bpm) is the normal heart rate range. The beat rate of the heart varies with the change in emotions and is also controlled by the human brain. Cardiac arrhythmias are caused by the abnormal heart rate. The two categories of the arrhythmias based on the beat rate are bradycardia (for heart rate >100bpm) and tachycardia (for heart rate <60bpm). Generally, the arrhythmias are not considered as a fatal disease; however, some severe cases can cause death. Therefore, proper attention should be given to the arrhythmia patient. The severe arrhythmia episode exist only for few munities and thus, not capture-able in the normal Electrocardiogram (ECG). Holter monitoring can clearly reveals the existence of the irregularities in the beat rate of the human heart.
Currently, classification of the arrhythmias is performed using digital systems based on computer. Pre-processing filters are used to clean the digitized ECG signal. After filtering, the fiducial points are computed. Extraction of the morphological features from the fiducial points are then performed and finally, fed to arrhythmias classifier. The classification of ECG beats has been carried out in literature using a number of computational intelligence techniques.
Recently, a lot of techniques have been used for the identification of different heart diseases. Numerous Data Mining techniques are used for the detection of various types of heart diseases. Polat et al in [3] has used a hybrid algorithm based on artificial immune recognition system (AIRS) and fuzzy weighted pre-processing, for the identification of heart disease. By using dataset of heart patient from Cleveland Clinic Foundation, the author succeeded in achieving
satisfactory results. Similarly in [4], Rani classified the heart disease of same dataset using Artificial Neural Network (ANN) and obtained remarkable results by varying the training and testing folds of the available data by that time. In [5], Evolutionary Artificial Neural Network has been used for the classification of heart disease. This technique proved better as compared to conventional back propagation ANN algorithm as EANN has the capability to reach the global minimal point. [5]
Furthermore, Nahina Islam has used the Fractal Analysis technique data for the identification of three types of heart diseases that is Left Bundle Branch Block (LBBB), Premature Ventricular Contraction (PVC) and Atrial Premature Beat (APB). In her work, the Electrocardiogram (ECG) signals of a healthy and a sick person by using fractal dimensions. The author obtained raw data of ECG from MIT-BIH Arrhythmia Database. The author concluded from his work that the fractal dimensions of a APB patients lies in the range of 1.54-1.58, whereas that of LBBB patient is expected in the range of 1.71-1.74, for PVC patient it is found that the range will be 1.48-1.53 and the fractal dimensions of a normal person is in the range of 1.65-1.67.[6]
Likewise, Onsy Abdel-Alini in [13] has developed an algorithm for the identification of various valve related heart diseases based upon the heart beat sounds obtained by traditional Stethoscope. Each of the First Heart Sound (FHS) and Second Heart Sound (SHS) is identified after separation. In his research work it is found that the valve related disease can be classified by the time separation between FHS and SHS relative to cardiac cycle time. Then features from the processed data are extracted using Fast Fourier Transform (FFT). The data is classified based on different types of heart diseases using a feed forward Artificial Neural Network (ANN). This concluded that the heart diseases can also be efficiently classified by the ANN using heartbeat sounds as dataset. The existing techniques using ANN provide the satisfactory results but the nonlinear nature of these algorithms has proved to be a hurdle in designing of simple digital classifier.
In this paper, a digital circuit is evolved for classification of three types of heart arrhythmias (such as left branch bundle block, arterial premature beat and normal beat). The ECG data of heart patients is obtained from the MIT-BIH [1] database for experimentation [dear atif insert a reference here]. Initially, the prominent features of ECG signal are obtained using a modified version of Pan-Tompkins algorithm. The resulting Fiducial points are then used for evolution of digital circuit using a binary classifier named as Cartesian Genetic Programming (CGP). CGP is selected due to its linear nature and computational efficiency.
CGP method.. Section IV consists of the experimental setup while results as well as conclusion are drawn in Section V.
2.
CARTESIAN GENETIC
PROGRAMMING- A BRIEF OVERVIEW
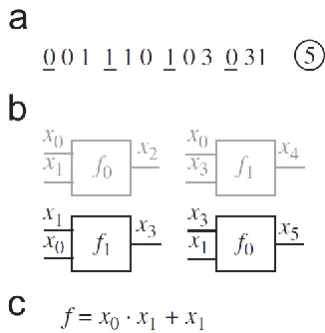
Cartesian Genetic Programming (CGP) developed by Miller and Thomson is a major breakthrough in Genetic Programming. It is a of graph based Evolutionary Programming technique which has proven to be a powerful and effective system in a wide array of experimental domain [7]. In CGP a finite length of integers represents genotype. The genotype consists of functional nodes, where each node is comprised of inputs, output and function. The inputs can be program inputs or inputs from the previous nodes while output can be program output or output to the following node(s). One of many mathematical functions like OR, AND, XOR etc may be contained by each node. The output(s) of the genotype can from the program input(s) or the output(s) of any node.
Evolutionary strategy of 1+ λ (where λ=4) is adapted to evolve the genotypes from one generation to the next. In this strategy the parent genotype is unchanged and 4 offsprings are produced by after mutation of parent‟s genotype.
A simple example of CGP in Fig. 1 is shown where Fig. 1(a) shows a 2x2 (rows x columns) genotype for an application with 2-bit input and 1-bit output. The function used are logical „OR‟ and logical „AND‟. The input to each node is set to 2. Genotype is decoded to extract phenotype after mutation. While decoding genotype to phenotype, some of the nodes‟ output remain unconnected and do not contribute to program output. These ignored nodes are referred to as non-coding nodes and are not used in phenotype of the system. Therefore, the number of nodes in phenotype can vary from zero to number of nodes defined in genotype. Genes are subdivided into two main types. Function genes represent the address of the computational node functions in the user defined look-up table while connection genes correspond to the address of the source of input to the functional node. An input is in a feed forward manner from either program input or output of the node in the previous columns. The value of level-back controls the connectivity of graph; if it is one a particular node can only take input from the nodes in immediate column on the left. The nodes in the same column cannot be connected to each other which make the graph directed and feed forward as shown in the Fig. 1.
CGP is considered to be one of the most effective algorithms to develop an efficient digital system [9]. Evolutionary algorithms specifically CGP is particularly attractive for demanding medical applications such as these because of their scalability, ease of implementation and ability to find solutions to highly non-linear problems. Precise implementation of these algorithms also depends on the nature of the patient data and consideration has also been given to how such data should be collected and processed.[10]
2.1
CGP Algorithm
The CGP Algorithm involves the following steps as shown in Fig 2.
1) BEGIN
Initiate the algorithm using the input variables given below. 2) INPUTS
R Total Nodes N.
S System Inputs Vector I.
T 1D CGP Output Vector (Estimated Speaker Feature Vector) with size Nout. U The total population of Genotypes
produced in each evolutionary run Ngen. V Alternate Node Functions nod
func[1...Nfun] (Nfun, total alternate node functions).
W Number of Inputs to a Node Nin. X Mutation Rate Mrate%.
Y Maximum Number of Evolutionary Generations Maxgen.
Z Fitness Threshold Fthresh.
3) INITIAL Create an Initial Population of Ngen Genotypes using equation 1 and equation 2 by employing a pseudorandom generator (PRG) [8]. Using equation 1 each input of every node in the system is connected randomly either to the output of a node preceding it or directly to a system input. Using equation 2 each node is assigned a node function.
genotype(α;β;γ) = PRG([I genotype(α;β-1) …, genotype(α; 1)]) (1)
Where α (α = 1,2,...,Ngen) gives the genotype being initialized from a total Ngen genotypes, while β (β = 1,2,...,N) is the node being initialized within the α genotype and γ (γ = 1,2,...,Nin) specifies the node β‟s input.
genotype(α; β; function) = PRG(nod func[1; …;Nf]) (2)
The system output for α (α = 1,2,...Ngen) genotype is specified using equation 3. These are the outputs which will be averaged to produce the frame size.
O(α;m) = PRG([I : genotype(α; β-1);…; genotype(α; 1)]) (3)
Where m = 1, 2…Nout.
4) FITNESS EVALUATION Percentage Accuracy is calculated for the output produced by each genotype as a criterion for fitness evaluation.
Fitness is taken in terms of the least amount of percentage accuracy produced. From the Ngen genotypes select as parent the fittest genotype. It must be noted here that in case a parent and child have the same fitness than the child must be selected as the new parent [12]. Compare the fitness of the parent against a predefined threshold Fthresh to ascertain whether the required degree of fitness is achieved. If a parent fulfills the required fitness criteria or the evolutionary runs for the CGP evolution reach Maxgen than proceed to step 6. Otherwise continue to the next step.
5) MUTATE Mutate the selected parent by Mrate% to create Ngen-1 offspring following 1 + λ evolutionary strategy (i.e. 1 parent λ offspring [12]) giving a total of Ngengenotypes whose fitness will again be evaluated in step 4.
Fig 1: Overview of Cartesian Genetic Programming
3.
PROPOSED ARRYTHMIA
CLASSIFIER
Disturbances in electrical pathways of the heart cause Arrhythmias. An effective technique for their detection is the ECG. Conventionally a physician observes the shape of ECG to diagnoses the patient‟s heart condition. However in many emergency cases and to verify the diagnosed disease a fast and automatic detection method is required. In this paper Automatic Detection of arrhythmias using computational intelligence has been described. Fig 2 illustrates the framework of our Arrhythmia classification where input features for classification are produced by adopting the fiducial point detection approach as described in [11].Please use a 9-point Times Roman font, or other Roman font with serifs, as close as possible in appearance to Times Roman in which these guidelines have been set. The goal is to have a 9-point text, as you see here. Please use sans-serif or non-proportional fonts only for special purposes, such as distinguishing source code text. If Times Roman is not available, try the font named Computer Modern Roman. On a Macintosh, use the font named Times. Right margins should be justified, not ragged.
3.1
Data Set
A well-known database of MIT-BIH for Arrhythmia has been experimented to test the validity of the experimental results. It contains 48 ECG recordings under its Arrhythmia category sampled at of 360 samples/sec. Each recording contains its beat to beat attribute file comprising respective R-peak sample number and Arrhythmia type Mnemonics (Total 19 Mnemonics).
3.2
Fiducial Points Detection
In this paper some important features of the ECG complexes are extracted, and subsequently applied to a CGP classifier. The algorithm used for feature extraction is inspired by Pan-Tompkin‟s algorithm and worked efficiently to extract the fiducial points of the ECG. The steps for fiducial point detection are explained briefly in [11].
3.3
Classification using CGP
Each input is normalized before applying it to the network using the following formula.
𝑃𝑎𝑟𝑎𝑚(𝑁𝑜𝑟𝑚 =
𝑃𝑎𝑟𝑎𝑚 − 𝑃𝑎𝑟𝑎𝑚 (𝑚𝑖𝑛 ) 𝑃𝑎𝑟𝑎𝑚 𝑚𝑎𝑥 −
𝑃𝑎𝑟𝑎𝑚 (𝑚𝑖𝑛 )
)
(1)
Cartesian Genetic Programming is used to classify the diseases. In the training phase the classifier is trained by using normalized feature of ECG as input for particular disease and the evolved circuit is considered as the phenotype. This phenotype is then used as digital signature of the disease in testing phase.
Input
Fiducial Point Detection
ECG Signal CGP
Classifier
Training Training
Testing Testing
Result (Arrhythmia
Type)
Training
Testing
Decision
Fig 2: Proposed Methodology
4.
SIMULATION RESULTS AND
DISCUSSION
Categorized in the given tables according to experimental parameters. Percentage accuracy is considered to be the performance parameter of the system and can be expressed as Percentage Accuracy =𝑇𝑟𝑢𝑒 𝑃𝑜𝑠𝑖𝑡𝑖𝑣𝑒 +𝑇𝑟𝑢𝑒 𝑁𝑒𝑔𝑎𝑡𝑖𝑣𝑒𝑇𝑜𝑡𝑎𝑙 𝑛𝑢𝑚𝑏𝑒𝑟 𝑜𝑓 𝑠𝑎𝑚𝑝𝑙𝑒𝑠 𝑋100%
(2)
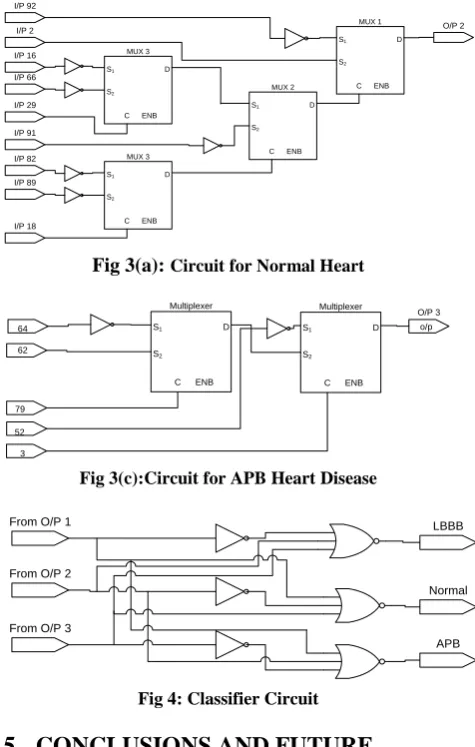
[image:3.595.315.558.157.237.2]Where True Positive are the samples of the true speaker detected as true and True Negative are not the samples of true speaker and have been rejected by the system. MIT-BIH database for Arrhythmias has been employed for experimentation. Initially the data is preprocessed by the Pan Tompkins algorithm to get fiducial points. The obtained fiducial points are provided as input to the network. Experiments are performed for the Normal beat, LBBB (Left Branch Bundle Block) beat and Atrial Premature beat (APB). The performance for networks of different size is analyzed and given in tables below. Table I and II shows the testing results for the above mentioned Arrhythmias for 1-Dimensional node networks of different sizes averaged for the result obtained for various seed values. According to the experimented results maximum percentage accuracy of 98.5% has been achieved for Normal beat, whereas accuracy of 91.0% has been achieved in case of LBBB. Table III and IV shows the testing results for the above mentioned Arrhythmias for 2-Dimensional node networks of different sizes averaged for the result obtained for various seed values. According to the experimented results maximum percentage accuracy of 95.0% has been achieved for Normal beat, whereas accuracy of 91.2% has been achieved in case of LBBB. Hardware implementation of the most accurate systems developed from their respective genotype has been illustrated in terms of their gate level schematics in Fig 3. Fig 3(a) showing identifier digital circuit for LBBB disease while Fig 3(b) and 3(c) represents circuitry for Normal and APB disease respectively. CGP Classifier circuit is illustrated in Fig 4 feeding in outputs of all the three identifier circuits.
Table 1: Percentage Accuracy (Fold 1) Of Testing Results For 1-Dimensional Network
Sr. No.
Network Size (1Row x Columns)
Percentage Accuracy
APB LBBB Normal
1 10 88.2 79.5 83.2
3 30 89.0 78.2 83.2
4 40 85.3 79.5 93.0
5 50 78.2 87.6 83.5
Table 2:Percentage Accuracy (Fold 2) Of Testing Results For 1-Dimensional Network
Sr. No.
Network Size (1Row x Columns)
Percentage Accuracy
APB LBBB Normal
1 10 93.5 83.5 83.2
2 20 98.5 80.0 85.3
3 30 93.5 87.6 98.5
4 40 93.5 91.0 87.6
[image:4.595.47.290.0.750.2]5 50 78.2 80.0 83.2
Table 3:Percentage Accuracy (Fold 1) Of Testing Results For 2-Dimensional Network
Sr. No.
Network Size (Rows x Columns)
Percentage Accuracy
APB LBBB Normal
1 1x10 85.0 91.0 82.0
2 2x10 92.0 93.0 84.6
3 3x10 94.0 75.0 81.0
4 4x10 89.0 81.2 84.6
[image:4.595.314.552.73.447.2]5 5x10 83.7 85.7 82.0
Table 4: Percentage Accuracy (Fold 2) Of Testing Results For 2-Dimensional Network
Sr. No.
Network Size (Rows x Columns)
Percentage Accuracy
APB LBBB Normal
1 1x10 87.6 88.0 90.0
2 2x10 91.0 88.0 89.0
3 3x10 94.0 87.0 83.0
4 4x10 86.0 91.2 95.0
5 5x10 90.0 81.2 76.5
S1
S2
D
C ENB
Multiplexer O/P 1
3
66
67
o/p
S1
S2
D
C ENB
Multiplexer
2
S1
S2
D
C ENB
Multiplexer
51
52
Fig 3(a): Circuit for LBBB HeartDisease
S1
S2
D
C ENB MUX 2
S1
S2
D
C ENB MUX 3 S1
S2
D
C ENB MUX 3
I/P 91 I/P 16
I/P 66
I/P 29
I/P 82
I/P 89
I/P 18
S1
S2
D
C ENB MUX 1
I/P 2 I/P 92
O/P 2
Fig 3(a): Circuit for Normal Heart
S1
S2
D
C ENB
Multiplexer
O/P 3
64
62
79
o/p S1
S2
D
C ENB
Multiplexer
52
3
Fig 3(c):Circuit for APB Heart Disease
From O/P 1
From O/P 2
From O/P 3
LBBB
Normal
APB
Fig 4: Classifier Circuit
5.
CONCLUSIONS AND FUTURE
WORK
Development of efficient digital circuit for Heart Disease Detection using CGP has been proposed in this letter. The objective was to determine the morphological features of ECG waveform of patient to be used for classification of disease. Experimental results confirmed the evolution of efficient digital circuits using CGP for valid arrhythmia type detection. In the next phase of our research we intend to use similar techniques for other disease including cancer and hepatitis. The techniques developed in this work will also open new avenues for development of resource efficient hardware of heart disease detection systems in general. Moreover, resource efficient filters for extraction of morphological features could be considered using same classification technique.
6.
REFERENCES
[1] G.B. Moody, R.G. Mark. “The impact of the MIT-BIH Arrhythmia Database”. IEEE Eng in Med and Biol 20(3):45-50 (May-June 2001).
[2] J. F. Miller., P. Thomson, , “Cartesian Genetic Programming”, vol. 1802, P 121-132, Jan 2000
[3] K. Polat, , S. Güneş, , and S. Tosun, , “Diagnosis of heart disease using artificial immune recognition system and fuzzy weighted pre-processing,” Pattern Recognition. vol. 39, no. 11, pp. 2186–2193, Nov. 2006.
[image:4.595.47.287.76.403.2] [image:4.595.49.287.483.733.2][5] K. S. Kavitha, , K. V Ramakrishnan, , and M. K. Singh, , “Modeling and design of evolutionary neural network for heart disease detection,” vol. 7, no. 5, 2010.
[6] N. Islam, N. Imtiaz, and B. Hamid, , “Detection of Some Major Heart Diseases Using Fractal Analysis,” vol. 4, no. 2, pp. 63–70.
[7] J.F. Miller, , Cartesian Genetic Programming, Springer, 2011.
[8] N. Nisan, , “Pseudorandom generators for space-bounded computation,”Combinatorica, vol. 12, no. 4, pp. 449– 461, 1992.
[9] M. Irfan, , Q. Habib, G.M Hassan., K.M.Yahya, , S. Hayat, ., "Combinational digital circuit synthesis using Cartesian Genetic Programming from a NAND gate template," Emerging Technologies (ICET), 2010 6th International Conference on , vol., no., pp.343,347, 18-19 Oct. 2010
[10]S.L. Smith, "Cartesian Genetic Programming and its Application to Medical Diagnosis," Computational Intelligence Magazine, IEEE, vol.6, no.4, pp.56,67, Nov. 2011
[11]A. M. Ahmad, G. M. Khan, and S. A. Mahmud, ,"Classification of Arrhythmia Types Using Cartesian Genetic Programming Evolved Artificial Neural Networks," pp. 282- 291, 2013.
[12]J. F. Miller, "An empirical study of the efficiency of learning boolean functions using a Cartesian Genetic Programming approach", "Proceedings of the Genetic and Evolutionary Computation Conference", Florida, USA, 1999