Comparative Study of Wavelet and Wavelet Packet
Transform for Denoising Telephonic Speech Signal
Gautam Kumar
(M.Tech) Student Department of ECE Galgotias University,
Greater Noida,India
Sugandh Kumar
Assistant Professor Department of ECE Galgotias University,
Greater Noida,India
Nitendra Kumar,
PhD Department of MathematicsSchool of Engg. & Tech. Sharda University Greater
Noida, India
ABSTRACT
In communication systems and other speech related systems, background noise is a severe problem. The speech signal gets polluted by the noises that are from transmission medium and surroundings. Noise degrades the quality and the intelligibility of the speech signals. Addition of noise is by various factors like heavy machines, pumps, vehicles, using radio communication device or over noisy telephone channel. The basic idea behind the project work is to denoise the noisy telephonic speech signal. This work is based on studying and implementing wavelets as denoising algorithm. The Wavelet Transform (WT) and Wavelet Packet Transform (WPT) implemented for the work is Discrete. Haar, Daubechies, Symlet and Coiflet wavelets are implemented for denoising of telephonic speech signal. Performance of telephonic speech signal is evaluated on the basis of SNR (signal to noise ratio) and RMSE (root mean square error). SNR and RMSE are calculated for both Soft Thresholding and Hard Thresholding.
Keywords
Wavelet, Wavelet Packet Transform, Thresholding.
1.
INTRODUCTION
One of the most essential functions of human being is communication which is via speech. There are various ways through which humans can retrieve information from the outside world to communicate with each other. Most important sources of information are written texts, images and speech. Speech stands out the most simple, convenient and efficient one. Speech is a very basic way to convey information with the emotion of a human voice to one another. People use speech to communicate messages. Over the past few decades there has been tremendous increase in the level of ambient environmental noise. This is due to the rapid growth of technology. Speech signal often gets degraded or superposed by background noise. Noise reduction has become the most important field for speech enhancement. Enhancement of speech can be used to increase the quality of speech by processing device like digital hearing aids, mobiles and other man-made machine interface in our daily life to make them more robust in noisy environmental conditions [1]. Speech is transmitted and received using various media. During transmission and reception of speech, distortions are introduced and have bandwidth constraints. The distortions introduced, lowers the intelligibility and clarity of speech messages.Noise reduction aims at reducing the level ofnoise from noisy speech signal and extracting the clean speech [2]. Enhancement of speech can be carried out by denoising of speech signal. Denoising has long been a focus of research and yet there always remains room for improvement. In general, Speech enhancement has three main objectives:
The perceptual aspects of the processed speech such as quality and intelligibility are improved i.e. to make it sound better in order to reduce listener fatigue.
To improve robustness of speech coder which tend to be severely affected by the presence of noise.
[image:1.595.316.544.229.446.2] To increase accuracy of speech recognition systems operating in noisy environment [3].
Figure 1: A Simplified Diagram of Denoised Speech Signal
1.1
Basic Noise Theory
Background noise is the most common source of noise. It can be present at any location. Channel noise and quantization noise are some other types of noise due to which the speech signal gets corrupted. Channel noise affects both analog and digital transmission. Quantization noise, results from over compression of speech signals, multi-talker babble is also present in some situations [1]. Noise is defined as an unwanted signal that interferes with the communication or measurement of another signal. A noise itself is an information-bearing signal that conveys information regarding the sources of the noise and the environment in which it propagates. Noise is random in nature [4].
1.2
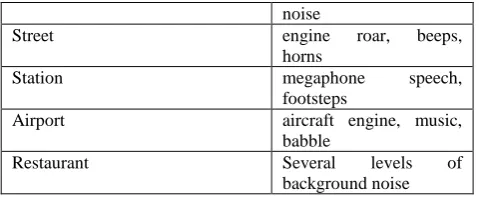
Common Noisy Environments
The speech signal also gets polluted by some of the common noisy environments [5].
Table 1: Common Noisy Environments
Environment Noise Specifies
Car car engine roar, horn
noise, music noise
Babble people speaking in the
background
Exhibition music, babble, camera clicks
[image:1.595.310.549.673.765.2]noise
Street engine roar, beeps,
horns
Station megaphone speech,
footsteps
Airport aircraft engine, music,
babble
Restaurant Several levels of
background noise
2.
BASIC PRICIPLE OF WAVELET
TRANSFORM
A wavelet is a small wave [6]. It has wave-like oscillation characteristics with amplitude beginning at zero, increases and then decreases back to zero. It has its energy concentrated in time. It has flexible mathematical foundation and allows simultaneous time and frequency analysis [7]. Wavelet is a mathematical tool that is used to extract information from many different kinds of data including audio signals and images.Wavelet Transform is an exciting new technique for solving difficult problems in engineering, mathematics and physics [6]. It splits the signal into a bunch of signals. Wavelet Transform provides a novel approach for the analysis of signals and has a multi-resolution capability [7]. Wavelet Transform provides the simultaneous representation of time– frequency information of the signal [7]. Wavelet Transform is superior to Fourier Transform and Short Time Fourier Transform (STFT) [8].Wavelet transforms is a great tool for de-noising signals. In fact, it is a series of different frequencies block signals which are de-composed by their respective resolutions of original spectral. The frequency of each point in original spectrum is obvious. The flexible window is provided by emergence of wavelet analysis. If
(t) L (R)
2 (L (R)
2 is a real space of square integrable), its Fourier transform is
( )
, when contents the admissible condition [9]:(t)dt
0
(1)
(t)
is called a basic wavelet or generating wavelet. The continuous wavelet is obtained by generating function
(t)
after expansion and translation:a,b
1
t
b
(t)
(
); a, b
R, a
0
(2)
a
a
Equation (2) is called a wavelet sequence. Where a is called the extension scale, when a increases, the local property weaken, the local property enhances. The overall properties enhance. When a decreases, the local property weaken; b is
called the shift operator.
t
b
(
)
a
is recorded as
a ,t, it isa wavelet function which is flexed by a, translated by b of the generating function
(t)
.The wavelet transform of
(t)
is1/2
f
t
b
W (a, b)
a
(t) (
)dt
(3)
a
If the Fourier transform
( )
of function
(t)
meets the admissible conditions:2
( )
C
d
(4)
So wavelet transform is reversible, its inverse is:
f (a,b)
2
1
1
(t)
W (a, b)
(t) dadb
(5)
C
a
2.1
Signal Decomposition in Wavelet
Transform (WT)
[image:2.595.48.288.71.170.2]‘S’- Signal ‘A1’- Low Frequency Information ‘B1’- High Frequency Information [4].
Figure 2: Signal Decomposition in Wavelet Transform
2.2
Signal Decomposition in Wavelet
Packet Transform
Wavelet Packet is an extension to Wavelet Transform and an important generalization of wavelet analysis [10]. It was pioneered by Ronald Coifman, Yves Meyer and Victor Wickerhauser. Nowadays, Wavelet Packet Transform (WPT) is becoming an efficient tool in signal processing and has good ability of decomposing frequency [10]. It has special abilities to accomplish higher discrimination by analyzing the higher frequency domains of a signal. The frequency domains are divided in the wavelet packet and these divided frequency domains can be easily selected and classified according to the characteristics of the analyzed signal. It is used for noise reduction, data compression etc.
Figure 3: Signal Decomposition in Wavelet Packet Transform
2.3
Types of Wavelets
One-Dimensional Discrete Wavelet Packet Transform is used in this work for denoising purpose. Four different types of wavelets are used in this work for denosing the telephonic speech signal based on SNR and RMSE are:
[image:3.595.317.536.73.186.2]Haar Wavelet: It is a mathematical tool which was proposed by the mathematician Alfred Haar in the year 1909. It is a sequence of rescaled “square shaped” functions which together form a wavelet family [11]. It is the first and simplest possible wavelet.
Figure 4: Haar Wavelet
[image:3.595.329.529.233.373.2]Daubechies Wavelet: It is a family of wavelets transforms. It was discovered by Ingrid Daubechies in 1988. It is based on the concepts similar to Haar wavelet transform. It differs in how scaling functions and wavelets are defined [12].
Figure 5: Daubechies Wavelet
Symlet Wavelet: These are symmetrical wavelets proposed by Daubechies. Symlets are modification to the db family [12]. The name of Symlet family wavelets are written as SymN. ‘N’ is the order and ‘Sym’ represents the surname of the wavelet [13].
Figure 6: Symlet Wavelet
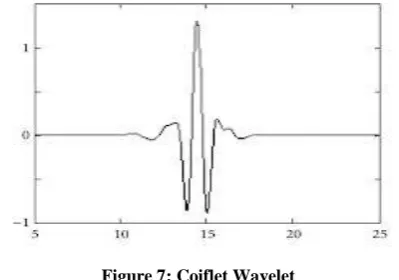
Coiflet Wavelet: It is a discrete wavelet. It is having scaling functions with vanishing moments. It is near symmetric. It has N/3 vanishing moments and scaling functions N/3-1.
Figure 7: Coiflet Wavelet
3.
TEST ANALYSIS AND EVALUATION
3.1
Signal – to – noise ratio (SNR)
In order to verify the performance of the proposed de-noising approach, computer generated noises with variable amplitudes are added to well-known benchmark signals; moreover, the classical algorithms are performed for comparison. A number of quantitative parameters can be used to evaluate the performance of the de-noising procedure in terms of the reconstructed signal quality. In this case, the following parameters are compared:
It is a measure that compares the level of a desired signal to the level of background noise. It is defined as the ratio of signal power to noise power. It is expressed in decibels (dB).
SNR=
signal
noise
P
P
N 2
k 1
N 2
k 1
x (k)
SNR db
10 ln
[x(k)
x '(k)]
Where
x '(k)
is the de-noise signal, andx(k)
is the original signal. The constant, N, is the number of sample composing the signals [9].3.2
Root-mean square error (RMS)
[image:3.595.75.258.338.481.2] [image:3.595.90.247.545.672.2] RMSE=
MSE
N 2
k 1
[x(k)
x '(k)]
RMSE
N
3.3
Thresholding
Thresholding is a wavelet denoising technique [2]. It is simple, non-linear technique operating on one wavelet coefficient at a time. It exploits the capabilities for signal denoising of wavelet transform. A small threshold selection yields a close result to the input but the result may be noisy. A large threshold selection leads to smooth signal. Paying much attention to smoothness can destroy the details of the data [12]. There are two types of thresholding available:
3.3.1 Hard Thresholding:
It is the simplest thresholding method. It does not have nice mathematical properties. It is the usual process of setting to zero the elements whose absolute values are lower than the threshold [2]. All coefficients in hard thresholding below a predefined threshold value are set to zero [12].Hard Threshold is defined as:
,
0,
x x T
y
x T
Here ‘T’ is the Threshold [2].
3.3.2 Soft Thresholding:
It has better mathematical properties in comparison to soft thresholding. Extension of hard thresholding is soft thresholding. It first sets to zero the elements whose absolute values are lower than the threshold. After setting the values to zero, it shrinks the nonzero coefficients to zero [2]. In soft thresholding, the coefficients are linearly reduced in value [12].Soft Threshold is defined as:
( ).(
),
0,
x T
sign x
x T
y
x T
Here ‘T’ is the Threshold [2].
4.
EXPERIMENTAL SETUP FOR
DENOISING TELEPHONIC SPEECH
SIGNAL
4.1
Data Set
The telephonic speech used for work was recorded using cell phones Nokia C5-03 and Samsung GT-E 2252. The original telephonic speech signal was created on April 6, 2014 at
11:08:36AM. Size of the speech signal was 34.3KB and the type of file was (.amr). Length of the speech signal was 44seconds.Later the speech signal was modified on April 20, 2014 at 1:38:48PM. The speech signal was converted into (.wav file). Size of the speech signal was increased to 687KB. Bit Rate- 128kbps.
4.2
Steps
This work is carried on MATLAB software. Telephonic Speech signal is imported using ‘WAVREAD’ command. Graph of original signal is plotted i.e. noisy speech signal. Again in MATLAB, ‘Wavelet 1-D’ in the Wavelet Toolbox is selected. The telephonic speech signal is imported from workspace. After importing the telephonic speech signal, the wavelet, wavelet family and wavelet order is selected. Then the telephonic speech signal is denoised for Wavelet Transform as well as for Wavelet Packet Transform using soft and hard thresholding. Also, the comparative study is done for the telephonic speech on the basis of SNR and RMSE. The graph for denosed speech in comparison to the original telephonic speech signal is plotted.
5.
RESULT AND DISCUSSION
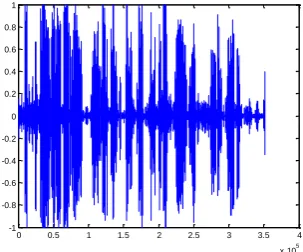
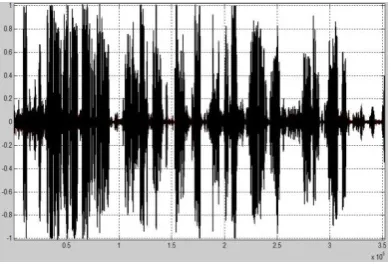
[image:4.595.54.236.74.149.2]De-noising of telephonic speech signal was carried on different wavelet Transform family and Wavelet Packet Transform on the basis of Signal to Noise Ratio (SNR) and Root Mean Square Error (RMSE).Both SNR and RMSE were calculated for soft and hard thresholding.
Figure 8: Plot of Original Telephonic Speech Signal
5.1
SNR and RMSE calculated at different
levels and families for Wavelet Transform
Table 2: For Haar Wavelet
SNR(dB) (Soft)
RMSE (soft)
SNR(dB) (hard)
RMSE (hard)
11.0629 0.0390 16.5565 0.0228
9.3724 0.0445 15.7388 0.0250
8.4949 0.0471 15.4120 0.0259
0 0.5 1 1.5 2 2.5 3 3.5 4
x 105 -1
[image:4.595.352.504.378.504.2]Table 3: For Daubechies Wavelet
Name of Wavelet
SNR(dB) (Soft)
RMSE (soft)
SNR(dB) (hard)
RMSE (hard)
(Db 12) N=2
20.1197 0.0149 25.9690 0.0078
(Db 13) N=2
20.3153 0.0145 26.1795 0.0076
(Db 20) N=2
20.9450 0.0136 26.8323 0.0071
(Db 12) N=3
18.5920 0.0173 25.1802 0.0085
(Db 13) N=3
18.7903 0.0170 25.3872 0.0083
(Db 20) N=3
19.4389 0.0158 26.0515 0.0077
(Db 12) N=4
17.9290 0.0184 24.8615 0.0088
(Db 13) N=4
18.1280 0.0181 25.0691 0.0086
(Db 20) N=4
[image:5.595.309.548.185.525.2]18.7845 0.0168 25.7391 0.0080
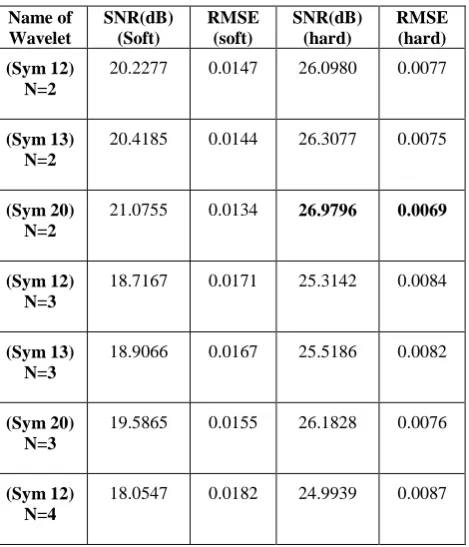
Table 4: For Symlet Wavelet
Name of Wavelet
SNR(dB) (Soft)
RMSE (soft)
SNR(dB) (hard)
RMSE (hard)
(Sym 12) N=2
20.2277 0.0147 26.0980 0.0077
(Sym 13) N=2
20.4185 0.0144 26.3077 0.0075
(Sym 20) N=2
21.0755 0.0134 26.9796 0.0069
(Sym 12) N=3
18.7167 0.0171 25.3142 0.0084
(Sym 13) N=3
18.9066 0.0167 25.5186 0.0082
(Sym 20) N=3
19.5865 0.0155 26.1828 0.0076
(Sym 12) N=4
18.0547 0.0182 24.9939 0.0087
(Sym 13) N=4
18.2501 0.0178 25.2042 0.0085
(Sym 20) N=4
18.9348 0.0166 25.8662 0.0079
Table 5: For Coiflet Wavelet
Name of Wavelet
SNR(dB) (Soft)
RMSE (soft)
SNR(dB) (hard)
RMSE (hard)
(Coif 3) N=2
18.6222 0.0176 24.3903 0.0093
(Coif 4) N=2
19.4508 0.0160 25.2574 0.0085
(Coif 5) N=2
20.0268 0.0150 25.8588 0.0079
(Coif 3) N=3
17.0757 0.0204 23.5775 0.0103
(Coif 4) N=3
17.9149 0.0186 24.4588 0.0093
(Coif 5) N=3
18.5093 0.0175 25.0621 0.0086
(Coif 3) N=4
16.3918 0.0217 23.2546 0.0106
(Coif 4) N=4
17.2449 0.0198 24.1436 0.0094
(Coif 5) N=4
17.8386 0.0186 24.7429 0.0090
Maximum SNR and minimum RMSE for Wavelet Transform was calculated at Sym 20 (N=2).
[image:5.595.52.287.475.749.2]SNR: 26.9796dB. RMSE: 0.0069.
Figure 9: Plot of Denoised Telephonic Speech Signal for WT at (Sym 20, N=2)
0 0.5 1 1.5 2 2.5 3 3.5 4
x 105 -1.5
[image:5.595.351.529.568.735.2]Figure 10: Comparison of Denoised & Original Telephonic Speech Signal for WT at (Sym 20, N=2)
5.2
SNR and RMSE calculated at different
levels and families for Wavelet Packet
Transform
Table 6: For Haar Wavelet
SNR(dB) (Soft)
RMSE (soft)
SNR(dB) (hard)
RMSE (hard)
11.2574 0.0383 16.7793 0.0222
9.7388 0.0430 16.0558 0.0241
[image:6.595.308.549.149.496.2]9.1310 0.0446 15.8220 0.0248
Table 7: For Daubechies Wavelet
Name of Wavelet
SNR(dB) (Soft)
RMSE (soft)
SNR(dB) (hard)
RMSE (hard)
(Db 12) N=2
20.6722 0.0140 26.5768 0.0073
(Db 13) N=2
20.8577 0.0137 26.7657 0.0071
(Db 20) N=2
21.4484 0.0128 27.4332 0.0066
(Db 12) N=3
19.4492 0.0158 26.0251 0.0077
(Db 13) N=3
19.6381 0.0155 26.2115 0.0076
(Db 20) N=3
20.2729 0.0144 26.9085 0.0070
(Db 12) N=4
19.0040 0.0165 25.7039 0.0080
(Db 13) N=4
19.1919 0.0161 25.9222 0.0078
(Db 20) N=4
19.8268 0.0151 26.5936 0.0073
Table 8: For Symlet Wavelet
Name of Wavelet
SNR(dB) (Soft)
RMSE (soft)
SNR(dB) (hard)
RMSE (hard)
(Sym 12) N=2
20.7772 0.0138 26.7170 0.0071
(Sym 13) N=2
20.9585 0.0135 26.9373 0.0070
(Sym 20) N=2
21.5797 0.0126 27.5840 0.0065
(Sym 12) N=3
19.5983 0.0155 26.1857 0.0076
(Sym 13) N=3
19.7823 0.0152 26.3524 0.0075
(Sym 20) N=3
20.4488 0.0141 27.0554 0.0069
(Sym 12) N=4
19.1294 0.0162 25.8380 0.0079
(Sym 13) N=4
19.3315 0.0159 26.0242 0.0077
(Sym 20) N=4
[image:6.595.48.292.450.757.2]19.9765 0.0148 26.7293 0.0071
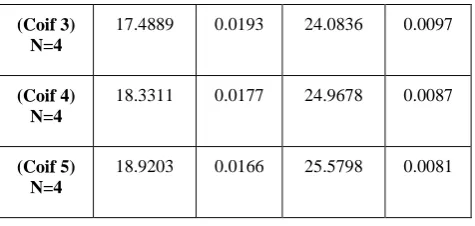
Table 9: For Coiflet Wavelet
Name of Wavelet
SNR(dB) (Soft)
RMSE (soft)
SNR(dB) (hard)
RMSE (hard)
(Coif 3) N=2
19.2133 0.0164 24.9732 0.0087
(Coif 4) N=2
20.0277 0.0150 25.8693 0.0079
(Coif 5) N=2
20.5815 0.0141 26.4754 0.0074
(Coif 3) N=3
17.9440 0.0186 24.3638 0.0094
(Coif 4) N=3
18.7933 0.0169 25.2808 0.0084
(Coif 5) N=3
[image:6.595.305.548.529.767.2](Coif 3) N=4
17.4889 0.0193 24.0836 0.0097
(Coif 4) N=4
18.3311 0.0177 24.9678 0.0087
(Coif 5) N=4
18.9203 0.0166 25.5798 0.0081
Maximum SNR and minimum RMSE for Wavelet Transform was calculated at Sym 20 (N=2).
[image:7.595.49.287.70.183.2]SNR: 27.5840dB. RMSE:0.0065.
Figure 11: Plot of Denoised Telephonic Speech Signal for WPT at (Sym 20, N=2)
Figure 12: Comparison of Denoised & Original Telephonic Speech Signal for WPT at (Sym 20, N=2)
6.
CONCLUSION
De-noising of speech signal has been achieved successfully using wavelets.Based on the Wavelet Transform and Wavelet Packet analysis, the denoising effect was better in Wavelet Packet Transform. SNR calculated were much lower at different levels of Haar and Coiflet wavelets in comparison to
Daubechies and Symlet wavelets.For the calculation of SNR and RMSE, Level 2 (N=2) performed better than all other levels used. The reconstructed signal i.e. denoised speech signal in Haar wavelet was not close to the original signal. There was information loss in Haar Wavelet. The peaks were vanishing in case of soft thresholding.Symlet wavelet showed better results as compared to Daubechies and Haar wavelet. Maximum SNR and minimum RMSE was achieved at Symlet 20 (N=2) for Wavelet Packet Transform. SNR= 27.5840 dB. RMSE= 0.0065.When denoised using hard thresholding, reconstructed signal was found to be similar to the original signal. Hard thresholding performed better than soft thresholding. Higher order of Symlet Wavelets can be implemented for better SNR and RMSE.
7.
REFERENCES
[1] Dr. Mahesh S. Chavan, Mrs. Manjusha N.Chavan and Dr. M.S.Gaikwad 2010, “Studies on Implementation of Wavelet for De-noising Speech Signal”, International Journal of Computer Applications (0975-8887) Volume 3-No.2, pp 1-7.
[2] Dr. Parvinder Singh Dinesh Singh and Deepak Sethi, 2011, “Reduction of Noise from Speech Signal using Haar and Biorthogonal Wavelet”, IJECT Vol. 2, Issue 3, pp 263-269.
[3] Soon Ing Yann, 2003, “Transform based Speech Enhancement Techniques”, PhD Thesis, Nanyang Technological University, pp 1-4.
[4] Mahesh S. Chavan and Nikos Mastorakis, 2010, “Studies on implementation of Haar and Daubechies Wavelet for Denoising of Speech Signal”, International Journal of Circuits, Systems and Signal Processing, Issue 3, Volume 4, pp 83-96.
[5] Slavy G. Mihov Ratcho M. Ivanov and Angel N. Popov, 2009, “De-noising Speech Signals by Wavelet Transform”, Annual Journal of Electronics, ISSN 1313-1842.
[6] M.Siffuzzaman, M.R Islam and M.Z.Ali, 2009, “Application of Wavelet Transform and its Advantages Compared to Fourier Transform”, Journal of Physical Sciences, ISSN: 0972-8791, Vol.13, pp 121-134. [7] S. Salivahanan and C. Gnanapriya “Digital Signal
Processing”, Tata McGraw Hill, Second Edition. [8] Roopali Goel and Javed Ahmed, 2013 “Contrast of
Wavelets Order Behavior for Sine Signal”, International Journal of Innovative Technology and Exploring Engineering (IJITEE), ISSN: 2278-3075, Volume-2, Issue-6, pp 287-290.
[9] Nitendra Kumar, Prof. A. H. Siddiqi and Dr. Khursheed Alam, 2014, “Raman Spectral Data De-noising Based On Wavelet Analysis”, International Journal of Computer Application (IJCA), Vol. (102).
[10]Wang Na, Zheng Dezhong, Xu Shuang and Zhang Shuqing, 2008, “A New Algorithm For Speech Enhancement Using Wavelet Packet Transform Based on Auditory Model”, International Conference on Computer Science and Software Engineering, IEEE Computer Society, 978-0-7695-3336-0/08, pp 1000-1003.
[11]Sai Lakshmi Bhamidipati, Sai Sudha Mindagudla, Harsha Vardhan Devalla, Hima Sagar Goodi and Hemanth Nag, 2014, “Analysis of Different Discrete
0 0.5 1 1.5 2 2.5 3 3.5 4
x 105 -1.5
[image:7.595.69.265.484.654.2]Wavelet Transform Basis Functions in Speech Signal Compression”, IOSR Journal of VLSI and Signal Processing (IOSR-JVSP), e-ISSN: 2319-4200, p-ISSN No.: 2319-4197, Volume 4, Issue (1), pp 34-38.
[12]V.S.R Kumari and Dileep Kumar Devarakonda, 2013, “A Wavelet Based Denoising of Speech Signal”, International Journal of Engineering Trends and Technology (IJETT), ISSN: 2231-5381, Volume 5 No. (2), pp 107-114.