N A N O E X P R E S S
Open Access
Solid-phase electrochemical reduction of
graphene oxide films in alkaline solution
Wan J Basirun
2*, Mehran Sookhakian
1, Saeid Baradaran
3, Mohammad R Mahmoudian
4and Mehdi Ebadi
1Abstract
Graphene oxide (GO) film was evaporated onto graphite and used as an electrode to produce electrochemically reduced graphene oxide (ERGO) films by electrochemical reduction in 6 M KOH solution through voltammetric cycling. Fourier transformed infrared and Raman spectroscopy confirmed the presence of ERGO. Electrochemical impedance spectroscopy characterization of ERGO and GO films in ferrocyanide/ferricyanide redox couple with 0.1 M KCl supporting electrolyte gave results that are in accordance with previous reports. Based on the EIS results, ERGO shows higher capacitance and lower charge transfer resistance compared to GO.
Keywords:Carbon materials; Thin films; FTIR; Raman
Background
Graphene, a one-dimensional carbon sp2-bonded
com-pound is finding considerable attention in the develop-ment of advance nanomaterials. Chemically modified graphene is studied for their importance in biomedical sensors, composites, field-effect transistors, energy conver-sion, and storage applications due to its excellent elec-trical, thermal, and mechanical properties. Reduced graphene oxide (RGO) can be produced by the reduction of graphene oxide (GO) by various methods. High temperature annealing of GO above 1,000°C is an effective method to produce RGO [1]. Sodium borohydride [2] and hydrazine [3-5] are also acceptable chemical methods for the reduction of GO to produce the RGO. Among the methods to synthesize RGO are by chemical exfoliation of GO in propylene carbonate followed by thermal reduction [4,5]. Another method of reduction of GO is by using hydrohalic acids [6]. Nutrients such as vitamin C [7,8] and metallic element such as aluminum powder [9] are also viable reducing agents for the production of RGO from GO. Hydrothermal reduction is also an effective method for the reduction of GO to RGO [10]. Electrochemical reduction to produce RGO or better known as electro-chemically reduced graphene oxide (ERGO) is considered a green method which offers safer procedures compared
to other chemical methods of reduction without the use of dangerous chemicals such as hydrazine. A suspension of GO was evaporated on glassy carbon and used as an electrode and reduced by voltammetric cycling in 0.1 M
Na2SO4 solution to produce ERGO films [11].
Electro-chemical reduction of GO suspensions were also done in acidic media using phosphate buffer solution at pH 4 [12] and basic pH at 7.2 [13]. Direct electrochemical reduction of GO onto glassy carbon has also been reported [14] in sulfuric acid [15] and in NaCl solution [16]. Electro-phoretic deposition of GO to produce ERGO is also an effective method to produced solid films of ERGO [17]. Several authors [11,13,14,18] have performed voltammetric cycling of exfoliated GO sheets from colloidal suspensions and found that electrochemical reduction for different functional groups in GO are dependent on the reduction potential. In this work, voltammetric cycling was used to electrochemically reduce GO films to ERGO in KOH solution.
Methods
Chemicals
All chemicals such as KOH, KCl, K4[Fe(CN)6], and K3
[Fe(CN)6] were of Analar grade and procured from
Sigma Aldrich (St. Louis, MO, USA).
Synthesis of GO
GO was synthesized using a modified Hummers' method [19]. GO was dispersed in a beaker filled with distilled
* Correspondence:[email protected] 2
Nanotechnology & Catalysis Research Centre, Institute of Postgraduate Studies, University Malaya, Kuala Lumpur 50603, Malaysia
Full list of author information is available at the end of the article
water and sonicated for 5 h. GO dispersion with a con-centration of 0.3 mg cm−3was poured on a graphite sheet in the jar and evaporated overnight in an oven at 60°C.
Material characterization
Field emission scanning electron microscopy (FESEM) using a Quanta 200F instrument (FEI, Hillsboro, OR, USA), was used to capture the images of the evaporated GO and ERGO layers on the graphite sheet. Fourier transformed in-frared (FTIR) spectroscopy was carried out using Spectrum 400 instrument while Raman spectroscopy was done with a Renishaw inVia Raman microscope (Wotton-under-Edge, UK) using(λ=514nm)laserexcitation.
Electrochemical methods
Cyclic voltammetry (CV) and electrochemical imped-ance spectroscopy (EIS) were done using a potentiostat / galvanostat, Autolab PGSTAT-302N from Ecochemie (Utrecht, the Netherlands). A general purpose electro-chemical software installed in the computer interfaced with a USB card (USB_IF030) was used to run the CV experiments while frequency response analysis (FRA) software was used to run the EIS experiments. The CV and EIS experiments were done in a single compartment cell. A mercury oxide (Hg/HgO) reference electrode (RE) and graphite rod counter electrode (CE) was used in the voltammetric cycling for the reduction of GO films in 6 M KOH solution at a scan rate of 50 mV·s−1. The CV experiments performed in 6 M KOH solution and [FeII(CN)6]3−/4−redox couple in 0.1 M KCl supporting electrolyte were done on stationary electrodes. A two-electrode configuration was used in the EIS experiments using the working electrodes (WE), and a saturated calo-mel electrode (SCE) as the reference and counter elec-trode (RE-CE). The EIS measurements were performed over a frequency range of 100 kHz to 10 mHz, with an ac-quisition of 10 points per decade, and with a signal ampli-tude of 5 mV around the open circuit potential. Analysis of the impedance spectra was done by fitting the experi-mental results to equivalent circuits using the nonlinear least-square fitting procedure with the chi-squared value
minimized to 10−4. All experiments were performed at
room temperature 300 K.
Results and discussions
Voltammetric reduction of GO to ERGO
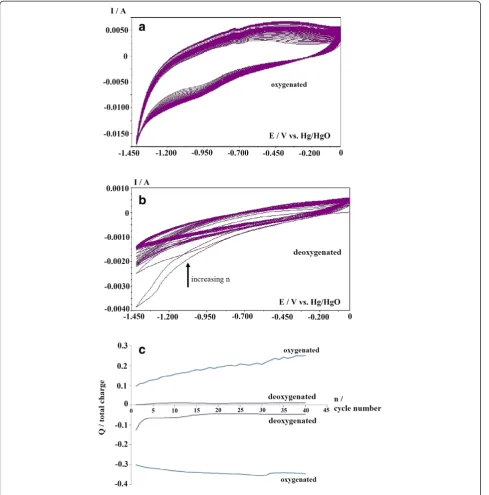
Figure 1a,b shows the CV plots of GO films over 40
cycles in a 6 M KOH solution at 25 mV·s−1 without
nitrogen bubbling (oxygenated) and with nitrogen bubbling (deoxygenated), respectively, while Figure 1c shows the charge for the negative and positive scans under both conditions and for each cycle number. It can be observed that the current and charge for both positive and negative scans for the oxygenated solution
are higher than those of the deoxygenated solution. This discrepancy is due to the oxygen reduction reaction (ORR) on the GO surface for both the positive and nega-tive scans in the oxygenated condition, which can be expressed as follows:
O2þ2H2Oþ4e−→4OH
It should be noted that different types of graphene such as graphene nanosheets [20] and porous graphene [21] are also good electro-catalysts for ORR in lithium-air cells. Graphene-based materials are also finding importance in the ORR such as chemically converted graphene [22], nitro-gen-doped graphene [23], polyelectrolyte-functionalized graphene [24], and graphene-based Fe-N-C materials [25]. Therefore, the higher current and charge for each scans for the oxygenated solutions are due to the ORR which occurs concurrent with the reduction of GO to ERGO. When the solution was deoxygenated, the total charge for the negative scan was always higher than the total charge for the positive scan. This trend reveals that there was a net reduction current for each scan that could be attributed to the elec-trochemical reduction of GO to ERGO in the deoxygenated solution.
FTIR and Raman spectra
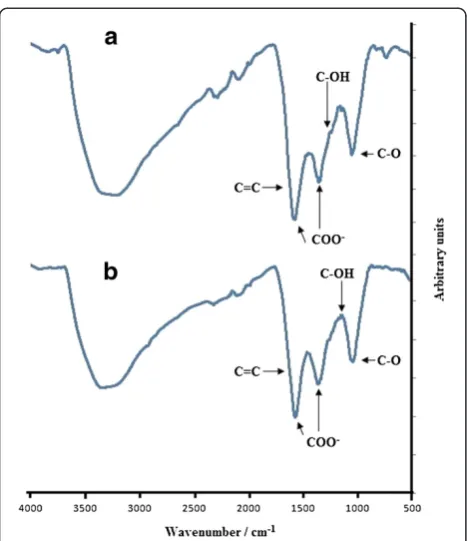
Figure 2a shows the FTIR of GO and ERGO films. The FTIR spectrum shows all the characteristic bands for GO: C-O stretching at 1,051 cm−1, C-OH stretching at 1,218 cm−1, OH bending at 1,424 cm−1, stretching of the sp2
-hybridized C=C bond at 1,625 cm−1, C=O stretching at
1,730 cm−1, and finally the OH stretching at 3,400 cm−1 [26]. The FTIR of ERGO retains all characteristic bands of GO, except that the peak of C=O stretching at 1,730 cm−1 has completely disappeared, which shows that the C=O functional group in GO was reduced during the voltammetric cycling. The FTIR of ERGO also shows the appearance of new peaks at 2,950 and 2,870 cm−1, which are due to the CH2and CH vibrations, respectively. The C=C peak is still present at around 1,610 cm−1which also
suggests that the CH2 and CH vibrations at 2,950 and
2,870 cm−1, respectively, could be due to the reduction of
the COOH groups in GO to CH2OH.
Figure 2b shows the Raman spectra for GO and ERGO, respectively, where two typical peaks for GO can be found at 1,361 and 1,604 cm−1, corresponding to the D and G bands, respectively. The D band is assigned to the
breath-ing mode of A1gsymmetry due to the phonon interaction
near the K zone boundary, while the G band is attributed to the E2gphonon mode of the sp2-bonded carbon atoms [27]. The D and G bands of ERGO were shifted to lower
wave numbers of 1,352 and 1583 cm−1, respectively,
graphene-related materials where the intensity of the D band is related to the disordered structure of the sp2 lat-tice [13]. For example, pristine graphite which has the lowest disorder density in the sp2 lattice gave a ratio of 0.23, while thermally reduced graphene oxide which has the highest disorder density gave a ratio of 1.35 [13]. In this work, the ratio of the ID/IG peak for ERGO is 1.03, while the ID/IG peak for GO (measured from the nearest
baseline) is 1.02. This result is in accordance with previous reports of 1.08 and 1.05 for ERGO and GO, respectively [13]. This result indicates that GO reduction to ERGO did not increase the defect density significantly. It can be sug-gested that the sp2lattice was maintained even after re-duction of GO to ERGO and this is also in accordance
with the FTIR of ERGO where the sp2-hybridized C=C
[image:3.595.57.547.89.585.2]In order to prove that ERGO is the result of electro-chemical reduction of GO in 6 M KOH by voltammetric cycling, GO films were immersed in deoxygenated 6 M KOH solutions for 1 h and 4 days at room temperature. Figure 3a,b shows the FTIR of GO immersed in deoxy-genated 6 M KOH for 1 h and 4 days, respectively. The distinct differences shown in these figures and FTIR of pure GO are the disappearance of the C=O peak at
1,730 cm−1and the appearance of two strong new peaks
at 1,598 and 1,368 cm−1(for a 1-h immersion) and 1,584
and 1,374 cm−1 (for a 4-day immersion). Both peaks
(1,598 and 1,584 cm−1) and (1,368 and 1,374 cm−1) are
attributed to the carboxylate COO− group, which has
strong vibrations at 1,610 to 1,550 cm−1 and 1,420 to
1,300 cm−1 [28,29]. The presence of the COO− ion is
due to the reaction between KOH and the acidic COOH groups in GO. It should be noted that the peaks due to
COO− are stronger than the peak due to OH vibration
at 3,400 cm−1in the FTIR spectrum of GO immersed in
KOH. This is in contrast to the pure GO spectrum where all the peaks are relatively weaker than the OH peak. The complete disappearance of the C=O peak in the FTIR spectrum of GO immersed in KOH also shows that the peak at 1,730 cm−1(C=O) is solely due to the carboxylic COOH group in GO. This also proves that the COOH groups in GO were not reduced to aldehyde HC=O and ketone C=O groups during immersion in 6 M KOH solution. The peaks for the C-OH stretching at
1,218 cm−1, OH bending of C-OH at 1,424 cm−1,
[image:4.595.58.541.88.520.2]are no longer visible due to the strong vibration of the
COO− group in the FTIR spectrum of GO immersed in
the KOH solution. In both spectra, vibration at 2,950 and 2,870 cm−1attributed to the CH2and CH, respect-ively, did not occur, which shows that the C=C was not
reduced to CH2 and CH, and the COOH was also not
reduced to CH2OH. Therefore, immersion of GO in
de-oxygenated 6 M KOH did not reduce GO to RGO, but
the ionization of the COOH groups into COO− had
taken place at room temperature. However, at higher temperatures (90°C), Fan [30] reported that exfoliated GO can be reduced to graphene in the absence of redu-cing agents in strong alkaline solutions.
FESEM and EIS
Figure 4a,b,c shows the FESEM images of the graphite surface, the evaporated GO films, and ERGO, respect-ively. It can be seen that the graphite surface consists of compressed flakes of graphite due to the manufacturing process of the material. The FESEM image of the evapo-rated GO films presents a uniform serevapo-rated surface due to the evaporation of the material onto the graphite sur-face. With GO electroreduction to ERGO in deoxygen-ated KOH solution, the same surface morphology was maintained as seen in Figure 4c. The GO film was formed from stacked individual layers of GO on the graphite substrate, as the compressed graphite flake sur-face is no longer visible in Figure 4b,c. Therefore, the
electrochemical reduction of the GO film was limited to the surface layer of the film.
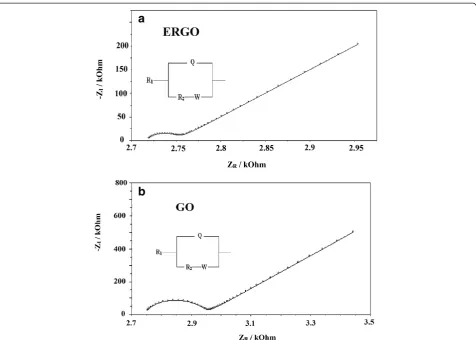
[image:5.595.57.291.86.357.2]Electrochemical impedance spectroscopy were done on both GO and ERGO surfaces in the presence of 23 mM of both [FeII(CN)6]4− and [FeIII(CN)6]3−, with 0.1 KCl as the supporting electrolyte. Figure 5a,b shows the Nyquist plots for GO and ERGO, respectively. The Nyquist plots for both GO and ERGO show one semi-circle at higher frequencies which is consistent with the redox reaction of the [FeII(CN)6]4−/ [FeIII(CN)6]3−couple across the WE-electrolyte interface. This semi-circle rep-resents the parallel combination of the charge transfer
Figure 4FESEM of (a) graphite surface (b) evaporated GO on graphite, and (c) ERGO on graphite.
[image:5.595.307.537.241.703.2]resistance and double-layer capacitance across the electrode-electrolyte interface. The Nyquist plot for GO and ERGO also shows the presence of a War-burg element at lower frequencies which is consistent with the diffusion limiting condition of the redox
couple in the solution. The R1(Q[R2W]) equivalent
circuit model was found to accurately fit the experi-mental data, where an excellent agreement between the experimental data and the simulation of the equivalent circuit model was obtained, with the chi-squared (x2
) value was minimized to 10−4. The
con-tinuous lines are the simulated data while the sym-bols represent the experimental data in Figure 5a,b.
The equivalent circuit model can be explained as
fol-lows: the R1 is the solution resistance between the
RE-CE and the WE. TheR1is in series with a parallel ar-rangement of the constant phase element (CPE -
de-noted as Q in the equivalent circuit) and the R2-W
elements. The CPE was introduced instead of a pure capacitor in the simulations to obtain a good agreement between the experimental and simulation data. The CPE impedance can be defined as ZCPE = Q−1.(jω)−n where “n” is related to the slope of log Z vs. logf in the Bode
plot, ω is the angular frequency and Q is the
combin-ation of properties related to both the surface and the electro-active species, and is independent of frequency.
The CPE depends on both the parameterQand the
ex-ponent“n,” but it should be stressed thatQis often ap-proximated to capacitance. The CPE is in parallel arrangement withR2-W elements, whereR2is the charge transfer resistance which is in series with the Warburg element W. The circuit diagram is consistent with earlier results using the [FeII(CN)6]4−/ [FeIII(CN)6]3−redox couple in solution [13].
For a simple parallel resistance-capacitance combin-ation, the conversion of the CPE parameter into capaci-tance can be estimated from the following equation [31]:
[image:6.595.61.538.87.427.2]C¼Q ωm;In−1 Figure 5Nyquist plots in the presence of 23 mM [FeII(CN)
6]3−/4−with 0.1 KCl supporting electrolyte. (a)GO, and(b)ERGO.
Table 1 Parameters of GO and ERGO obtained using EIS
WE Q(S·sn) n R2(Ω·cm2) W(S·s1/2) C(F cm-2)
GO 1.5 × 10⁻⁶ 0.9096 196.9 1.99 × 10⁻³ 6.66 × 10⁻⁷
[image:6.595.306.541.689.733.2]where C is the capacitance and ωm,I = 2πf and f is the
frequency at which the imaginary impedanceZIis
max-imum, and Q is the CPE parameter. Table 1 shows the
results from the simulation experiments for both GO
and ERGO. It can be seen that ERGO has lower charge transfer resistance compared to GO, which is consistent with previous works [13], where the charge transfer
[image:7.595.61.538.82.646.2]re-sistance of ERGO and GO is 333 and 831 Ω·cm2,
Figure 6Cyclic voltammetry at 50 mV·s−1with 23 mM [FeII(CN)
6]4−/ [FeIII(CN)6]3−redox couple andIvs.v1/2plots.Cyclic voltammetry in
respectively. The charge transfer resistance of ERGO reported by Pumera [13] was deposited from GO at a
constant potential of −1.2 V vs. Ag/AgCl in phosphate
buffer solution at pH 7.2. The ID/IG peak for ERGO and
GO obtained in this work in the “FTIR and Raman
spectra” section is lower than previous report [13], and
the FTIR results also shows the presence of the sp2
hybridized C=C at around 1,610 cm−1which could explain the lower charge transfer resistance in this work. Clearly, the electrolyte medium and the experimental conditions greatly influenced the charge transfer resistance value of ERGO. This higher charge transfer resistance of ERGO is primarily due to its higher electrical conductivity [32]. The chemical reduction of GO using sodium hydrosulfite to produce RGO also gave an electrical conductivity of seven orders of magnitude higher than GO [33]. The higher electrical conductivity of ERGO could facilitate faster electron transfer to the [FeII(CN)6]4−/[FeIII(CN)6]3− redox couple, thus ERGO has lower charge transfer resistance R2 compared to GO. The higher charge transfer resistance of GO compared to ERGO in Table 1 has a good correlation with the higher electrical resistivity of GO compared to RGO obtained by Zhou [33]. It can be seen also that the value of surface capacitance for ERGO is nearly five times higher compared to that for GO. This could be due to the electrochemical reduction of the C=O and epoxy C-O-C in the GO to produce more polarized C-OH groups in ERGO, thus increasing the ion accumulation on the ERGO surface. The lower capacitance of GO compared to ERGO is also in accordance with previous reports, thus GO is not useful for supercapacitor applications [34-38].
Cyclic voltammetry in [FeII(CN)6]3−/4−redox couple
Cyclic voltammetry with the [FeII(CN)6]4−/[FeIII(CN)6]3− redox couple in 0.1 M KCl supporting electrolyte was done on both the GO and ERGO films with a SCE as the reference. Figure 6a,b shows the voltammetric reponse for
GO and ERGO films at 50 mV·s−1. In Figure 6a, the
anodic and cathodic currents of the redox couple for the GO film has almost similar baseline currents, as shown by the two straight lines very close to each other. The base-line for the anodic and cathodic currents has larger separation for ERGO films as shown in Figure 6b. This is due to the larger surface capacitance of the highly polarized ERGO surface, which was mentioned earlier
in the “FESEM and EIS” section. Both anodic and
cathodic currents for the GO film show straight lines from the plots ofIvs.ν1/2as shown in Figure 6c. From the Randles-Sevcik equation¼0:4463nF RTnF1=2AcD1=2v1=2,
the diffusion coefficient (D) of the [FeII
(CN)6]4−/[FeIII (CN)6]3−redox couple in 0.1 M KCl was estimated to be 5.9 × 10⁻¹⁰m2·s−1.
Conclusion
Solid-phase electrochemical reduction of GO films on graphite in alkaline solution produced ERGO which was confirmed with FTIR and Raman spectra. The EIS re-sults obtained using [FeII(CN)6]4−/[FeIII(CN)6]3− redox couple in 0.1-M KCl supporting electrolyte indicated that the charge transfer resistance for ERGO is lower than GO and is consistent with the higher electrical con-ductivity of ERGO. The results also reveal that the cap-acitance of ERGO is larger than GO, due to its higher polarity of ERGO. This result is also supported by voltammetry of both GO and ERGO in [FeII(CN)6]4−/ [FeIII(CN)6]3− redox couple in 0.1-M KCl supporting electrolyte, where ERGO surface has a larger separation of the anodic and cathodic baseline currents due to the larger capacitance compared to the GO surface.
Competing interests
The authors declare that they have no competing interests.
Authors’contributions
MS and SB synthesized and characterized GO. ME and MRM ran experiments of CV and EIS. WJB wrote the manuscript. All authors read and approved the final manuscript.
Acknowledgements
The authors would like to thank University Malaya and Ministry of Higher Education for providing financial assistance with grant number FP033-2013A and RG181-12SUS for this work.
Author details
1Department of Chemistry, University Malaya, Kuala Lumpur 50603, Malaysia. 2Nanotechnology & Catalysis Research Centre, Institute of Postgraduate
Studies, University Malaya, Kuala Lumpur 50603, Malaysia.3Department of
Mechanical Engineering, Faculty of Engineering, University Malaya, Kuala Lumpur 50603, Malaysia.4Department of Chemistry, University of Farhangian,
15916, Tehran, Iran.
Received: 21 July 2013 Accepted: 12 September 2013 Published: 24 September 2013
References
1. Becerril HA, Mao J, Liu Z, Stoltenberg RM, Bao Z, Chen Y:Evaluation of solution-processed reduced graphene oxide films as transparent conductors.ACS Nano2008,2(3):463–470.
2. Shin HJ, Kim KK, Benayad A, Yoon SM, Park HK, Jung IS, Jin MH, Jeong HK, Kim JM, Choi JY, Lee YH:Efficient reduction of graphite oxide by sodium borohydride and its effect on electrical conductance.Adv Funct Mater 2009,19(12):1987–1992.
3. Gao W, Alemany LB, Ci L, Ajayan PM:New insights into the structure and reduction of graphite oxide.Nat Chem2009,1:403–408.
4. Stankovich S, Dikin DA, Piner RD, Kohlhaas KA, Kleinhammes A, Jia Y, Wu Y, Nguyen ST, Ruoff RS:Synthesis of graphene-based nanosheets via chemical reduction of exfoliated graphite oxide.Carbon2007,
45(7):1558–1565.
5. Zhu Y, Stoller MD, Cai W, Velamakanni A, Piner RD, Chen D, Ruoff RS:
Exfoliation of graphite oxide in propylene carbonate and thermal reduction of the resulting graphene oxide platelets.ACS Nano2010,
4(2):1227–1233.
6. Pei S, Zhao J, Du J, Ren W, Cheng HM:Direct reduction of graphene oxide films into highly conductive and flexible graphene films by hydrohalic acids.Carbon2010,48:4466–4474.
8. Zhang J, Yang H, Shen G, Cheng P, Zhang J, Guo S:Reduction of graphene oxide via L-ascorbic acid.Chem Commun2010,46:1112–1114.
9. Fan Z, Wang K, Wei T, Yan J, Song L, Shao B:An environmentally friendly and efficient route for the reduction of graphene oxide by aluminum powder.Carbon2010,48:1670–1692.
10. Sookhakian M, Amin YM, Basirun WJ:Hierarchically ordered macro-mesoporous ZnS microsphere with reduced graphene oxide supporter for a highly efficient photodegradation of methylene blue.
Appl Surf Sci2013,283:668–677.
11. Shao Y, Wang J, Engelhard M, Wang C, Lin Y:Facile and controllable electrochemical reduction of graphene oxide and its applications.
J Mater Chem2010,20:743–748.
12. Zhou M, Wang Y, Zhai Y, Zhai J, Ren W, Wang F, Dong S:Controlled synthesis of large-area and patterned electrochemically reduced graphene oxide films.Chem Eur J2009,15:6116–6120.
13. Ambrosi A, Bonanni A, Sofer Z, Cross JS, Pumera M:Electrochemistry at chemically modified graphenes.Chem Eur J2011,17:10763–10770. 14. Chen L, Tang Y, Wang K, Liu C, Luo S:Direct electrodeposition of reduced
graphene oxide on glassy carbon electrode and its electrochemical application.Electrochem Commun2011,13:133–137.
15. Ramesha GK, Sampath S:Electrochemical reduction of oriented graphene oxide films: an in situ Raman spectroelectrochemical study.
J Phys Chem C2009,113(19):7985–7989.
16. Wang Z, Zhou X, Zhang J, Boey F, Zhang H:Direct electrochemical reduction of single-layer graphene oxide and subsequent functionalization with glucose oxidase.J Phys Chem C2009,113(32):14071–14075.
17. An SJ, Zhu Y, Lee SH, Stoller MD, Emilsson T, Park S, Velamakanni A, An J, Ruoff RS:Thin film fabrication and simultaneous anodic reduction of deposited graphene oxide platelets by electrophoretic deposition.
J Phys Chem Lett2010,1:1259–1263.
18. Mahmoudian MR, Alias Y, Basirun WJ:The electrical properties of a sandwich of electrodeposited polypyrrole nanofibers between two layers of reduced graphene oxide nanosheets.Electrochim Acta2012,72:53–60.
19. Hummers WS Jr, Offeman RE:Preparation of graphitic oxide.
J Am Chem Soc1958,80(6):1339–1339.
20. Sun B, Wang B, Su D, Xiao L, Ahn H, Wang G:Graphene nanosheets as cathode catalysts for lithium-air batteries with an enhanced electrochemical performance.Carbon2012,50(2):727–733.
21. Xiao J, Mei D, Li X, Xu W, Wang D, Graff GL, Bennett WD, Nie Z, Saraf LV, Aksay IA, Liu J, Zhang JG:Hierarchically porous graphene as a lithium-air battery electrode.Nano Lett2011,11(11):5071–5078.
22. Li F, Yang H, Shan C, Zhang Q, Han D, Ivaska A, Niu L:The synthesis of perylene-coated graphene sheets decorated with Au nanoparticles and its electrocatalysis toward oxygen reduction.J Mater Chem2009,19:4022–4025. 23. Qu L, Liu Y, Baek JB, Dai L:Nitrogen-doped graphene as efficient metal-free
electrocatalyst for oxygen reduction in fuel cells.ACS Nano2010,
4(3):1321–1326.
24. Wang S, Yu D, Dai L, Chang DW, Baek JB:Polyelectrolyte-functionalized graphene as metal-free electrocatalysts for oxygen reduction.
ACS Nano2011,5(8):6202–6209.
25. Byon HR, Suntivich J, Horn YS:Graphene-based non-noble metal catalysts for oxygen reduction reaction in acid.Chem Mater2011,23(15):3421–3428. 26. Golsheikh A, Huang NM, Lim HN, Chia CH, Harrison I, Muhamad MR:One-pot
hydrothermal synthesis and characterization of FeS2(pyrite)/graphene
nanocomposite.Chem Eng J2012,218:276–284.
27. Sun Y, Wu Q, Shi G:Graphene based new energy materials.Energy Environ Sci2011,4:1113–1132.
28. Infrared Correlation Charts. InCRC Handbook of Chemistry and Physics, 90th Edition (CD-ROM Version 2010).Edited by Lide DR. Boca Raton FL: CRC Press/ Taylor and Francis; 2010:1461.
29. Coates J:Interpretation of Infrared Spectra, a Practical Approach. InEncyclopedia of Analytical Chemistry.Edited by Meyers RA. Chichester: Wiley; 2000:10815–10837.
30. Fan X, Peng W, Li Y, Li X, Wang S, Zhang G, Zhang F:Deoxygenation of exfoliated graphite oxide under alkaline conditions: a green route to graphene preparation.Adv Mater2008,20(23):4490–4493.
31. Hsu CH, Mansfeld F:Concerning the conversion of the constant phase element parameter Y0 into a capacitance.Corrosion2001,57(9):747–748. 32. Eda G, Fanchini G, Chhowalla M:Large-area ultrathin films of reduced
graphene oxide as a transparent and flexible electronic material.
Nat Nanotechnology2008,3:270–274.
33. Zhou T, Chen F, Liu K, Deng H, Zhang Q, Feng J, Fu Q:A simple and efficient method to prepare graphene by reduction of graphite oxide with sodium hydrosulfite.Nanotechnology2011,22:045704.
34. Chen Y, Zhang X, Zhang D, Ma Y:High power density of graphene-based supercapacitors in ionic liquid electrolytes.Mater Lett2012,68:475–477. 35. Zhang D, Zhang X, Chen Y, Wang C, Ma Y:An environment-friendly route
to synthesize reduced graphene oxide as a supercapacitor electrode material.Electrochim Acta2012,69:364–370.
36. Mhamane D, Unni SM, Suryawanshi A, Game O, Rode C, Hannoyer B, Kurungot S, Ogale S:Trigol based reduction of graphite oxide to graphene with enhanced charge storage activity.J Mater Chem2012,22:11140–11145. 37. Lei Z, Lu L, Zhao XS:The electrocapacitive properties of graphene oxide
reduced by urea.Energy Environ Sci2012,5:6391–6399.
38. Li ZJ, Yang BC, Zhang SR, Zhao CM:Graphene oxide with improved electrical conductivity for supercapacitor electrodes.Appl Surf Sci2012,
258:3726–3731.
doi:10.1186/1556-276X-8-397
Cite this article as:Basirunet al.:Solid-phase electrochemical reduction of graphene oxide films in alkaline solution.Nanoscale Research Letters
20138:397.
Submit your manuscript to a
journal and benefi t from:
7 Convenient online submission
7 Rigorous peer review
7 Immediate publication on acceptance
7 Open access: articles freely available online
7 High visibility within the fi eld
7 Retaining the copyright to your article

![Figure 6 Cyclic voltammetry at 50 mV·s−1 with 23 mM [FeII(CN)6]4− / [FeIII(CN)6]3− redox couple and I vs](https://thumb-us.123doks.com/thumbv2/123dok_us/8864767.939691/7.595.61.538.82.646/figure-cyclic-voltammetry-feii-cn-feiii-redox-couple.webp)
